
ABSTRACT
A feeding trial was performed to evaluate the effects of dietary L-threonine supplementation on growth and body composition of fingerlings Rhamdia quelen (initial weight: 4.47 ± 0.39 g). Five diets (370 g/kg crude protein and 14.23 MJ / kg of digestible energy) containing levels of L-threonine (16.0, 22.0, 28.0, 34.0, 40.0 g threonine/kg protein) were fed to quadruplicate groups of fishes for 10 weeks. The analysed variables were influenced by the threonine levels. Fish fed with diet containing 16.0 g threonine/kg of CP showed lower growth and body deposition of nutrients. In addition to unsatisfactory performance, the fish subjected to lower levels of threonine presented higher hepatosomatic index scores and changes in the concentrations of some plasmatic metabolites. To determine the ideal level of threonine in the diet, the weight gain, specific growth rate and feed conversion ratio were subjected to broken-line and quadratic regression. The results showed indicate that a diet containing inadequate levels of threonine causes insufficient growth. Dietary threonine requirement of R. quelen was estimated between 24.5 and 32.5 g threonine/ kg of crude dietary protein, corresponding to 9.1 and 12.0 g/ kg threonine in the diet for the initial growth of silver catfish.
Introduction
Fish are well known for human diet, usually due to long chain polyunsaturated fatty acids and proteins (Hussain et al. Citation2022). Fish attain maximum performance only when their diet meet their nutritional requirements. Since the protein fraction is the most expensive constituent in fish feed (Meyer and Fracalossi Citation2004; Abidi and Khan Citation2008), it is fundamental to pay attention to the composition of amino acids in the diet, allowing reduction of the total protein level while still meeting the specific amino acid requirements for the species. Therefore, the correct supplementation of essential amino acids, meeting but not exceeding the requirement, may help reduce feed costs in commercial aquaculture (Abidi and Khan Citation2008).
Amino acids play a variety of metabolic functions such as maintenance and formation of tissues, hormones, enzymes and antibodies. They act in the transport of minerals and / or nitrogen compounds essential for metabolism during growth and reproduction, or they can be used as an energy source (Millward Citation1989). According to the same author, diets with insufficient AAs can reduce growth, feed efficiency, or immunity, mobilizing the protein of some tissues for the maintenance of vital functions. On the other hand, in diets with excess AAs, a portion is used for muscle building and growth, and the remainder is converted into energy. Fish require diets with adequate amounts and proportions of EAAs, namely, arginine, histidine, isoleucine, leucine, lysine, methionine, phenylalanine, threonine, tryptophan and valine (Wilson Citation2002).
Threonine (Thr), the last of the amino acids to be discovered, first reported in 1938 (Nelson and Cox Citation2011), is a polar, water-soluble amino acid with glycogenic and ketogenic functions, used in the biosynthesis of metabolic intermediates and non-essential amino acids precursors such as glycine and serine (Lehninger Citation2007). Thr supplementation in the diet is indispensable for the normal growth of fish, as it is essential for protein synthesis and is the first limiting amino acid in the production of immunoglobulins and mucin, which are synthesized in large amounts in the digestive tract of fish (Silva et al. Citation2006).
Threonine is the third limiting amino acid for growing fish fed with low protein diets and involved in many physiological and biochemical processes (Abidi and Khan Citation2008; Bodin et al. Citation2008; Gao et al. Citation2014; Habte-Tsion et al. Citation2015; Farhat Citation2016; Habte-Tsion et al. Citation2016). Dietary Thr regulated the TOR and 4E-BP2 gene expressions in the intestine, (Habte-Tsion et al. Citation2015). TOR signalling pathway plays an important role in regulating protein synthesis (Feng et al. Citation2013) and the 4E-BPs is one of the major downstream targets of TOR protein (Schmelzle and Hall Citation2000), which may explain further that dietary Thr enhanced growth performance and protein accretion in this fish (Habte-Tsion et al. Citation2015).
The silver catfish Rhamdia quelen, a fish well adapted to the climatic conditions of southern Brazil presents meat of excellent taste and quality, without intramuscular spines, characteristics that guarantee its good acceptance in the consumer market (Kubota and Emanuelli Citation2004; Lazzari et al. Citation2006). However, the studies to determine their true nutritional requirement in EAA are still incipient, highlighting protein and energy determination in the initial phase (Meyer and Fracalossi Citation2004; Salhi et al. Citation2004), determination of requeriment of lysine (Montes-Girao and Fracalossi Citation2006), estimation of the optimal level the tryptophan (Pianesso et al. Citation2015). Although information on lysine, tryptophan and methionine requirement of silver catfish is available, there is complete lack of information on threonine requirement of this fish (Rotili et al. Citation2017).
The variables of productive performance and body composition of the fish are commonly used to evaluate and estimate the best level of amino acids. However, it is essential to evaluate in parallel the biochemical composition of blood plasma and hepatic metabolites, which may indicate possible changes in tissue metabolism, organ function and the possible adaptation of the animal to nutritional, physiological and metabolic imbalance (Higuchi et al. Citation2011).
The present research was undertaken to determine the dietary threonine requirement for the maximum growth, evaluating body composition as well as the concentrations of some plasma and hepatic metabolites of R. quelen juveniles.
Material and methods
Diets
Experimental diets () were formulated to contain 370 g/ kg crude protein (CP) and 14.23 MJ / kg of digestible energy (Salhi et al. Citation2004). Casein, gelatin, fish meal (R. quelen), and a mixture of synthetic amino acids were used as protein sources. The amino acid profile of the diets was based on the amino acid profile of chicken egg albumin (Santiago and Lovell Citation1988; Wilson Citation2002) and on the nutritional requirements known for jundiá (Montes-Girao and Fracalossi Citation2006) and channel catfish (Ictalurus punctatus) (NRC Citation2011), with the exception of the test amino acid (Thr). The L-threonine levels of the diets were included in intervals of 6.0 g/ kg CP (16.0, 22.0, 28.0, 34.0, 40.0 g Thr / kg CP) replacing the non-essential amino acid L-glutamine. The basal diet was formulated to contain a minimum level of 16.0 g threonine/kg CP.
Table 1. Composition of the experimental diets (natural matter basis).
The individually weighed ingredients were mixed until complete homogenization, and then the pH values of all diets were adjusted to 7 using a solution of sodium hydroxide (6 N NaOH) (Nose et al. Citation1974). The mixture was then pelleted (4 mm) and oven dried at 50 °C for 24 h and stored in a freezer until delivery to the animals.
Experimental procedures
For the experimental conditions, the fish were acclimatized for 10 days to the experimental conditions at the Fish Culture Laboratory of the Federal University of Santa Maria. Were used 400 R. quelen juveniles (initial weight of 4.47 ± 0.39 g and average length of 8.16 ± 0.49 cm) obtained from the Fish Culture Station of the University of Passo Fundo, State of Rio Grande do Sul (RS), Brazil. The fish were distributed in 20 polyethylene tanks (70 L, 20 fish per tank) connected to a water recirculation system with individual supply systems, drainage and aeration, with mechanical and biological filtration of the water.
The water flow rate was approximately 2.0 L min−1 tank−1. The animals were fed three times a day (8:00 am, 1:30 pm and 6:00 pm) to apparent satiation. Daily cleaning of the tanks by siphoning was carried out twice daily to remove leftovers from feed and animal feces.
Analysis and measurements
Water quality
The water quality of the breeding system was measured twice a day (temperature and oxygen) and weekly (other parameters), yielding the following average values: temperature 25.6°C; dissolved oxygen 5.8 mg/L; pH 7.0; total ammonia 0.15 mg/L; nitrite 0.00 mg/L; alkalinity 31.9 mg/L CaCO3; total hardness 22.0 mg/L CaCO3. According to Baldisserotto and Silva (Citation2004), these values are adequate for the silver catfish rearing.
Sample collection
The all fish were fasted for 12 h and anesthetized with benzocaine solution (10%, 30 mg/L) to collect data on weight (g), length (cm) and samples (proximate composition and tissues). After blood collection (n = 8), the fish were euthanized for tissue collection (liver and digestive tract) as well as the fish used to compose samples for composition analysis (n = 8). Fish were euthanized by benzocaine overdose (10%, ≥ 250 mg/L), according to AVMA protocols (Citation2013). The procedures performed with the fish in this study are approved in their ethical and methodological aspects by the Ethics Committee on the Use of Animals (CEUA-UFSM) (n. 099/2013).
Plasma and liver metabolites
The blood was collected by puncturing the caudal vein using heparinized syringes; after collection, the samples were conditioned in microtubes and centrifuged (1000 g, 10 min at room temperature). The obtained plasma was stored and refrigerated for the determination of free amino acid concentration (Spies Citation1957), glucose, circulating total proteins, and albumin with commercial colorimetric kits (Doles®, Reagentes e Equipamentos de Laboratório Ltda. Goiânia, State of Goiás, Brazil).
After collection, the liver was separated into portions. Samples of 25 mg each were homogenized in trichloroacetic acid (TCA, 10%) and centrifuged at 3500 rpm for 10 min to separate the proteins. Glucose (Park and Johnson Citation1949) and ammonia (Verdouw et al. Citation1978) were quantified in this extract. For protein analysis (Bradford Citation1976), hepatic tissue samples (25 mg) were heated at 100°C with KOH after centrifuged (3500 rpm for 10 min) the protein in the extract was determined. For glycogen determination (Bidinotto Citation1997), ethyl alcohol was added for the hydrolysis and precipitation of glycogen. To quantify amino acids (Spies Citation1957) and alanine aminotransferase (ALT) (Melo et al. Citation2006), a 50 mg liver sample was homogenized in buffer (20 mM TFK – potassium phosphate buffer) and centrifuged at 3500 rpm for 10 min to obtain an extract for quantification of the aforementioned metabolites.
After blood collection, the fish were slaughtered and eviscerated to obtain the weight (g) and length of the whole fish (cm), weight (g) and length of the digestive tract (cm), liver weight (g) and weight visceral fat (g) to calculate the following parameters: DSI, digestive-somatic index (%) = (digestive tract weight/whole fish weight) × 100; HSI, hepatosomatic index (%) = (liver weight/whole fish weight) × 100; and VFI, visceral fat index (%) = (visceral fat weight/whole weight) × 100.
Chemical analysis
The analyses of the proximate composition of the diets () and centesimal composition of the fish followed the methodologies described by the Association of Official Analytical Chemists (AOAC Citation1995). At the beginning of the experiment, a sample of 20 fish was collected and slaughtered for analyses of centesimal composition. At the end of the experimental period, the moisture content (drying of samples at 105°C to constant weight), ash (incineration at 600°C for 4 h), crude protein of whole fish and experimental diets (Kjeldahl method – N × 6.25) and fat (extracted and quantified by the Bligh and Dyer method, Citation1959) were measured. The amino acid composition of the experimental diets was calculated based on the aminogram of the protein ingredients that composed the diets.
Table 2. Composition of the experimental diets (g/kg natural matter).
The AA content of the ingredients were extracted with hydrochloric acid (6 N) for 24 h (0.3 mg sample in 9 mL HCl) and then derivatized with phenylisothiocyanate. The derivatized samples were separated by high performance liquid chromatography (HPLC, Model P4000-Thermo Fisher Scientific, Waltham, MA) in reverse phase with UV detection at 254 nm, based on the methodology described by White et al. (Citation1986).
Growth performance
At the end of the 10-week experiment, the fish were weighed (0.01 g) and measured (cm). The analyses were as follows:
Weight gain (WG, g) = (FBW-IBW);
Specific growth rate (SGR (% / day)) = ((ln (FBW) – ln (IBW)) / feeding days) × 100;
Feed conversion ratio (FCR) = feed consumed (g) / WG (g);
Survival (%).
For calculating the nutrient retention, the following measures were calculated:
Body protein deposition (BPD, g) = (FBW × (% final body crude protein / 100)) − (IBW × (% initial body crude protein/100));
Protein retention coefficient: PRC (%) = 100 × ((FBW × final body crude protein) – (IBW × initial body crude protein))/feed consumed × crude protein diet (%);
Body fat deposition (BFD, g) = (FBW × (% final body fat / 100)) – (IBW × (% initial body fat / 100));
Protein efficiency ratio (PER) = weight gain / amount of protein consumed.
Experimental design and statistical analysis
The experimental design was completely randomized with 5 treatments (levels) and 4 replicates. Initially, the data were submitted to the Shapiro–Wilk test of normality, with those data that presented P > 0.05 being considered normally distributed.
The polynomial regression analyses for the level of Thr that reached the P < 0.05 level of significance were tested when more than one regression model was significant, choosing the model with the highest coefficient of determination (r²). The means of the variables that did not fit the regression models were compared by Tukey’s test (P < 0.05). Nonlinear regression analysis was used for the parameters of weight gain and specific growth rate to determine the optimal level of threonine for silver catfish.
Results
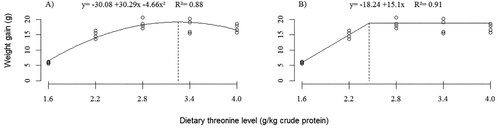
The growth of fish was influenced by threonine supplementation in the diet. For the maximum specific growth rate (SGR) (), Thr levels of 32.5 and 23.7 g/kg CP were estimated, according to the polynomial regression analysis (P < 0.0001) and broken line (P < 0.0001), respectively. The WG () of fish improved (P < 0.0001) as a function of increasing levels of dietary Thr up to 32.5 g/kg CP (polynomial regression) or 24.5 g/kg CP (broken line).
Figure 1. Effect of threonine level on the specific growth rate (SGR) of silver catfish (initial body weight, 4.47 ± 0.39 g). Calculated estimate using the mathematical models of polynomial regression (A) (P < 0.0001) and broken line (B) (P < 0.0001).
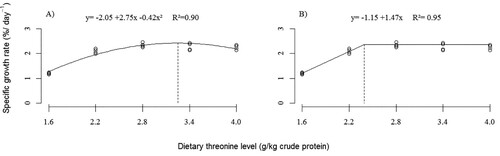
Figure 2. Weight gain (WG) of silver catfish (initial body weight, 4.47 ± 0.39 g) submitted to different levels of threonine in the diet. Estimated using mathematical model of polynomial regression (A) (P < 0.001) and broken line (B) (P < 0.0001).
No significant differences were observed () in the survival (P > 0.230) of the silver catfish fed with different dietary threonine levels. The apparent feed conversion ratio (FCR) was higher (P < 0.0001) for the animals that received the critical threonine level in the diet (16.0 g Thr/kg CP). The estimated optimal level of Thr for the minimum FCR was 32.0 g Thr/kg CP.
Table 3. Growth performance and somatic indices of silver catfish (initial body weight, 4.47 ± 0.39 g) fed experimental diets containing different threonine levels over 10 weeksTable Footnotez.
Fish fed diets containing the lowest levels of threonine showed higher HSI (P < 0.05) (). There was no difference (P > 0.05) for the somatic indices, VFI or DSI of the jundiás fed the different dietary Thr levels.
Regarding the variables of body composition (), no significant differences were observed (P > 0.05) in the fat or body moisture of the fish subjected to different Thr levels in the diet. The fish receiving the diet with the critical level of Thr showed lower (P < 0.0001) body protein content than did those receiving 28, 34 and 40 g Thr/kg CP. Greater ash content (P < 0.0001) in whole fish was observed for the animals that received the critical level of the AA in the diet.
Table 4. Body composition, nutrient deposition and body indices of silver catfish fed threonine levels for 10 weeksTable Footnotez.
For nutrients deposition in the whole fish varied () with the Thr levels in the diet. BPD was lower for fish fed a diet containing 16.0 g Thr/kg CP. Lower BFD and PER (P < 0.02) were observed in animals fed a critical threonine level in the diet. PRC was superior (P < 0.001) in fish subjected to the levels of 22.0–40.0 g Thr/kg CP, and the fish subjected to the lowest Thr level in the diet showed inferior PRC. The PER and BPD of the fish improved (P < 0.001) as a function of the increasing levels of dietary Thr, the optimal level being 32.7 g Thr/kg CP in the diet as estimated by the polynomial regression model.
The plasmatic variables of the silver catfish were altered after the ten weeks of feeding with diets containing varied Thr levels (). The fish receiving 28.0 g/kg CP of Thr in their diet presented higher (P < 0.05) total plasma protein concentrations without differing from those receiving 34.0 g Thr/kg CP. It was observed that serum albumin levels were higher (P < 0.05) for jundiás fed with 34.0–40.0 g Thr/kg CP in the diet than in those fed a diet containing 16.0 g/kg CP of the AA tested. The lowest concentration (P < 0.05) of free amino acids was observed () in animals fed the critical Thr level in the diet. No significant differences were observed for plasma glucose levels (P > 0.05).
Table 5. Effect of the concentration of dietary threonine on plasma physiology of silver catfishTable Footnotez.
Regarding hepatic metabolism (), no significant differences were observed (P > 0.05) for any of the analysed variables.
Table 6. Hepatic metabolism of silver catfish fed diets containing different levels of threonineTable Footnotez.
Discussion
The productive parameters of silver catfish (Rhamdia quelen) improved in response to dietary L-threonine supplementation, thus confirming the essentiality of this amino acid for the species studied. Providing the optimum amount of threonine is a prerequisite for formulating a nutritionally adequate diet for this fish for proper growth and health. The results indicate that for maximum fish growth, it is essential to provide threonine ranging between 24.5 and 32.5 g kg-1 of dietary protein (CP) for SGR () and WG (), respectively.
Because it is an essential amino acid, imbalances in threonine level lead to a reduction in growth rate and a decrease in food utilization in Labeo rohita (Abidi and Khan Citation2008). According to these same authors, fish fed with Thr levels below the dietary requirement exhibited a reduction in growth and increase in the oxidation of the other EAAs and NEAAs present in the diet. The reduced growth of silver catfish fed diets containing the highest levels of Thr is related to excess catabolism (Abidi and Khan Citation2008). According to Alam et al. (Citation2002), excessive levels of AAs may cause adverse effects on growth due to irregular ingestion that may interfere with the absorption and use of other AAs. Silva et al. (Citation2006) suggest in their study that lower growth, with the addition of higher levels of threonine in the tilapia diet, may be related to the difficulty of oxidizing the excess of this amino acid and to the reduction of serotonin secretion in the brain, due to the increased threonine concentration, which can induce less food intake. Pianesso et al. Citation2015, in a study to determine the dietary need for tryptophan for silver catfish, report that limiting AA was probably used for protein synthesis, while excess AA was available for oxidation, causing reduced silver growth due to limitation of the essential amino acid.
The ideal Thr level of 23.7–24.5 g/kg diet CP estimated for R. quelen in this study is higher than that found for Ictalurus punctatus, 22.0 g/kg CP (Wilson et al. Citation1978), Oncorhynchus kisutch 20.0 g/kg CP (Arai and Ogata Citation1993) Pactolinus major 18.0 g/kg CP (Forster and Ogata Citation1998). However, this requirement is lower than that found for Oreochromis niloticus 37.5 g/kg CP (Santiago and Lovell Citation1988), Chanos chanos 45.0 g/kg CP (Borlongan Citation1991), Catla catla 49.5 g/kg CP (Ravi and Devaraj Citation1991), Salmo salar 26.0 g/kg CP (Bodin et al. Citation2008), Heteropneustes fossilis, 32.0 g/kg CP (Ahmed Citation2007) and Cyprinus carpio 39.0 g/kg CP (Nose Citation1979).
This result is lower than the 30.0 g/kg dietary CP estimated for Rhamdia quelen through muscle composition (Meyer and Fracalossi Citation2005). According to Fracalossi et al. (Citation2012), some amino acids end up accumulating in the body of the fish, and for this reason, their determination by the ideal protein concept ends up being overestimated; these AAs are leucine, isoleucine, valine and threonine. The Thr requirements for R. quelen obtained in this study are similar to the requirements found for striped bass of 24.5 g/kg CP (Small and Soares Citation1999), for hybrid striped bass of 26.0 g/kg CP (Keembiyehetty and Gatlin Citation1997), and for red drum 22.8 g/kg CP (Boren and Gatlin Citation1995).
The AA requirements of fish are influenced by many factors they being the species, the feeding habit, size, age, feeding frequency, adequate levels of other nutrients, water temperature, flow rate, stocking density, and the environmental conditions and managements adopted by different laboratories (Cowey and Luquet Citation1983; Luzzanaa et al. Citation1998). In addition, the digestibility, AA profile and energy content may also alter the estimates of nutritional requirements (NRC Citation2011), and different statistical methodologies may yield different estimates of the ideal AA level. According to Pianesso et al. (Citation2015), this clarifies the differences observed in the studies carried out to determine the nutritional requirements of the fish.
Thr levels in the diet did not influence the survival of silver catfish, which is related to the absence of health challenges and/or stressful conditions, which tend to increase the requirement of Thr due to the excessive loss of mucus (mucin) by fish (Bomfim et al. Citation2008). FCR was greatest for fish fed the diet containing the critical level of Thr (16.0 g/kg CP). The high value of this variable can be explained by the imbalance of the AA of the diet, which leads to a reduction in the limiting AA levels in the blood plasma being detected in the anterior cortex of the brain, followed by behavioural changes in food intake (Gietzen Citation1993). Reduction of serotonin secretion in the brain, which may also be due to the increase in Thr concentration, reduces food intake (Henry and Sève Citation1993).
This mechanism is an attempt by the body to reduce the deleterious effects of a nutritionally unbalanced diet (Harper et al. Citation1970; Bertechini Citation2006). High FCR may also be the result of leftover food that has not been fully consumed by animals, overestimating consumption in this treatment. However, all the variables of productive performance indicate losses in the growth of the animals submitted to the diets containing the critical level of Thr.
The lower Thr levels in the diet (16.0 and 22.0 g Thr/ kg CP) of silver catfish caused an increase in hepatosomatic index. As this parameter may vary due to nutritional status (Roberts and Ellis Citation1989), we can relate it to a high rate of metabolism in this organ, indicating a metabolic overload, or to fat deposition in this organ (Nelson and Cox Citation2011). Diets containing levels that do not meet the requirement of Thr resulted in the deamination of unused AAs or their transamination into metabolic intermediates for use as a source of energy. In many studies to determine nutritional requirements L. calcarifer (Coloso et al. Citation2004), H. fossilis (Ahmed Citation2012), and C. catla, there is an increase in HSI values when animals are subjected to EAA-deficient diets. In addition, this same phenomenon has already been documented by Pianesso et al. (Citation2015) when determining the tryptophan requirement for R. quelen.
Upon examining the results of body composition and nutrient deposition, it is clear that critical levels of Thr cause imbalance in the use of the nutrients available in the diet, which leads to losses in body protein content, BPD, PRC and PER. This condition highlights the imbalance of AA in the diet containing 16.0 g Thr/ kg CP, which led to AA being deaminated and catabolized, its carbon skeletons being converted to fat (Nelson and Cox Citation2011), which can be confirmed by high body fat deposition in fish subjected to the critical level of threonine in the diet. This phenomenon was already observed by Borlongan (Citation1991) in studies with C. chanos Forsskal, where the fish presented impaired feeding efficiency when fed with threonine-deficient diets. Nutritionally adequate diets that meet the requirement of the species and are formulated with a balance between AAs allow adequate formation of body proteins.
Diets containing 22.0–40.0 g Thr/ kg CP show that an adequate supply of this AA provides the body with an equilibrium in the supply of AA, favouring the use of the ingested protein. In nutritional studies, Wilson et al. (Citation1978), Santiago and Lovell (Citation1988), Borlongan (Citation1991) and Ravi and Devaraj (Citation1991) observed this same phenomenon, where the supply of diets with inadequate levels of Thr caused a reduction in the retention of nitrogen. This event is explained by the rapid availability of AA, which can cause saturation of intestinal transport mechanisms, resulting in an imbalance in the absorption and oxidation of these amino acids, which negatively affects protein retention (Aragão et al. Citation2004).
The diet containing the critical level of the AA Thr favoured an increase in the body ash content, which is related to the smaller muscular protein deposition that proportionally increases the content of mineral matter. This result has already been explained by Pianesso et al. (Citation2015) when working with the tryptophan requirement for silver catfish and by Ahmed and Khan (Citation2004) when studying the lysine requirement for Cirrhinus mrigala.
The lower concentrations of these metabolites presented by the fish subjected to the lower level of Thr, associated with the high HSI and lower growth, express mobilization of the endogenous reserves and the use of the metabolic route of gluconeogenesis, a process by which excess amino acids are used for energy production. Plasma albumin acts as a mobile reservoir of amino acids to peripheral tissues; its lower concentration indicates lower amino acid intake, evidenced by the reduced total amino acid values, which, in conjunction with higher BFD, indicates that excess AAs were used for other purposes.
The levels of the AA Thr used in this study did not promote changes in hepatic metabolism. The concentrations of AA used were probably not high enough or low enough to cause marked liver disorders. The fact that the diets are isoproteic and isoenergetic and contain the same amounts of EAAs except for the tested AA may have contributed to the absence of differences in some variables.
The results indicate that a diet containing inadequate levels of Thr causes insufficient growth, reduction in the deposition of body nutrients, and metabolic alterations that compromise the adequate use of the nutrients provided in the diet. According to Ambardekar and Reigh (Citation2007), in the absence of certain AAs or in an asynchronous rhythm of their availability, protein synthesis will be impaired, causing AAs to be catabolized and used for energy. The metabolic cost for the organism to incorporate an AA in a protein chain is 4 molecules of ATP and, to eliminate it, 6 molecules per gram of nitrogen (MC Leod Citation1997), being greater energy expenditure is required to eliminate excess AAs.
Conclusion
According to the estimates from the linear and non-linear regression equations tested for WG, the authors recommend the inclusion of between 24.5 and 32.5 g Thr/ kg of the diet or between 9.1 and 12.0 g Thr / kg as crude protein of the diet for the initial growth of silver catfish.
Acknowledgments
This study was financed in part by the Coordenação de Aperfeiçoamento de Pessoal de Nível Superior – Brasil (CAPES) – Finance Code 001. The authors thank FAPERGS (Foundation for Research Support of the State of Rio Grande do Sul, Porto Alegre, RS, Brazil) for financial support (Case 11/1175-1); Mig-PLUS Agroindustrial Ltda. (Casca, RS, Brazil); CAPES for the master's-level scholarship awarded to the first author; and the CNPq (National Council for Scientific and Technological Development) for the research scholarship to João Radünz Neto and Rafael Lazzari [process n. 312849/2020-6].
Disclosure statement
No potential conflict of interest was reported by the author(s).
References
- Abidi SF, Khan MA. 2008. Dietary threonine requirement of fingerling Indian major carp, Labeo rohita (Hamilton). Aquac Nutr 39:1498–1505. doi:10.1111/j.1365-2109.2008.02018.x.
- Ahmed I. 2007. Dietary amino acid l-threonine requirement of fingerling Indian catfish, Heteropneustes fossilis (Bloch) estimated by growth and biochemical parameters. Aquac. Inter. 15(5):337–350. doi:10.1007/s10499-007-9097-y.
- Ahmed I. 2012. Dietary amino acid L-tryptophan requirement of fingerling Indian catfish, Heteropneustes fossilis (Bloch), estimated by growth and haemato-biochemical parameters. Fish Phys. Biochem. 38:1195–1209. doi:10.1007/s10695-012-9609-1.
- Ahmed I, Khan MA. 2004. Dietary lysine requirement of fingerling Indian major carp, Cirrhinus mrigala (Hamilton). Aquaculture. 235:499–511.
- Alam MS, Teshima S, Koshio S, Ishikawa M. 2002. Arginine requirement of juvenile Japanese flounder Paralichthys olivaceus estimated by growth and biochemical parameters. Aquaculture. 205:127–140. doi:10.1016/S0044-8486(01)00670-6.
- Ambardekar AA, Reigh RC. 2007. Sources and utilization of amino acids in catfish diets: a review. North Amer. Journ. Aquac. 69:174–179. doi:http://doi.org/10.1577/A06-007.1.
- Aragão C, Conceição LEC, Martins D, Rønnestad I, Gomes E, Dinis MT. 2004. A balanced dietary amino acid profile improves amino acid retention in post-larval Senegalese sole (Solea senegalensis). Aquaculture. 234:429–455. doi:10.1016/j.aquaculture.2003.08.007.
- Arai S, Ogata H. 1993. Quantitative amino acids requirements of fingerling Coho salmon. In: Collie MR, McVey JP., editors. Proceedings of the twentieth US-Japan symposium on aquaculture nutrition. Newport, Oregon: UJNR; p. 19–28.
- Association American Veterinary Medical (AVMA). 2013. Schaumburg, IL: guidelines on Euthanasia.
- Association of Official Analytical Chemists (AOAC). 1995. Official methods of analysis of official analytical chemists international, 16th ed. Arlington, USA: Association of Official Analytical Chemists.
- Baldisserotto, B, Silva, LVF 2004. Qualidade da água. In: Baldisserotto B. Radünz Neto, Criação de jundiá J. editors. Santa Maria. UFSM, p. 73–94.
- Bertechini AG. 2006. Nutrição de Monogástricos. Lavras, MG: ed. UFLA.
- Bidinotto PM. 1997. Hepatic glycogen and glucose in eight tropical freshwater teleost fish: A procedure for field determinations of micro samples. Boletim Técnico CEPTA. 10:53–60.
- Bligh EG, Dyer WJ. 1959. A rapid method of total lipid extraction and purification. Can. Journ. of Biochem. Physiol. 37:911–917. doi:https://doi.org/10.1139/o59-099.
- Bodin N, Mambrini M, Wautersa JB, Abboudi T, Ooghe W, Boulenge EL, Larondelle Y, Rollin X. 2008. Threonine requirements for rainbow trout (Oncorhynchus mykiss) and Atlantic salmon (Salmo salar) at the fry stage are similar. Aquaculture. 274(2):353–365.
- Bomfim MAD, Lanna EAT, Donzele JL, Quadros M, Ribeiro FB, Araújo WAG. 2008. Exigência em treonina, com base no conceito de proteína ideal, de alevinos de tilápia-do-nilo. Rev Bras Zootec 37:2077–2084. doi:http://doi.org/10.1590/S1516-35982008001200001.
- Boren RS, Gatlin M. 1995. Dietary threonine requirement of juvenile red drum Sciaenops ocellatus. Journ. Worl. Aquac. Soc. 3:279–283.
- Borlongan IG. 1991. Arginine and threonine requirements of milkfish (Chanos chanos Fosskal) juveniles. Aquaculture. 93:313–322.
- Bradford MM. 1976. A rapid and sensitive method for quantitation of microgram quantities of protein utilizing the principle of protein-dye-binding. Anal Biochem 72:248–254.
- Coloso RM, Murillo-Gurrea DP, Borlongan IG, Catacutan MR. 2004. Tryptophan requirement of juvenile Asian sea bass Lates calcarifer. Journ. Appl. Ichth. 20:43–47.
- Cowey CB, Luquet P. 1983. Physiological basis of protein requirements of fishes. critical analysis of allowances. In: Pion R, Arnal M, Bonin D, editors. Proceedings of the fourth international symposium on protein metabolismo and nutrition. Paris, France: INRA publications, Les Colloques de 1’ INRA; p. 365–384.
- Farhat KM. 2016. Growth, feed conversion and body composition of fingerling stinging catfish Heteropneustes fossilis (Bloch) fed varying levels of dietary L threonine. Aquac. Res. 48:2355–2368. doi:10.1111/are.13071.
- Feng L, Peng Y, Wu P, Hu K, Jiang WD, Liu Y, Jiang J, Li SH, Zhou XQ. 2013. Threonine affects intestinal function, protein synthesis and gene expression of TOR in Jian carp (Cyprinus carpio var. Jian). PLoS ONE. 8(7):e69974. doi:10.1371/journal.pone.0069974.
- Forster I, Ogata HY. 1998. Lysine requeriments of juvenile Japanese flounder Paralichthys olivaceus and juvenile red sea bream Pagrus major. Aquaculture. 161:131–142. doi:http://doi.org/10.1016/S0044-8486(97)00263-9.
- Fracalossi DM, Rodrigues APO, Castro e Silva TS, Cyrino JEP. 2012. Técnicas experimentais em nutrição de peixes. In: Fracalossi DM, Cyrino J E P, editors. NUTRIAQUA: nutrição e alimentação de espécies de interesse para a aquicultura brasileira. Florianópolis: Copiart; p. 37–63.
- Gao YJ, Yang HJ, Liu YJ, Chen SJ, Guo DQ, Yu YY, Tian LX. 2014. Effects of graded levels of threonine on growth performance, biochemical parameters and intestine morphology of juvenile grass carp Ctenopharyngodon idella. Aquaculture. 424–425:113–119.
- Gietzen DW. 1993. Neural mechanisms in the response to amino acid deficiency. The Journ. of Nutrit. 123:610–625. doi:10.1093/jn/123.4.610.
- Habte-Tsion HM, Liu B, Ren M, Ge X, Xie J, Zhou Q, Miao L, Pan L, Chen R. 2015. Dietary threonine requirement of juvenile blunt snout bream (Megalobrama amblycephala). Aquaculture. 437:304–311.
- Habte-Tsion HM, Ren M, Liu B, Ge X, Xie J, Chen R. 2016. Threonine modulates immune response, antioxidant status and gene expressions of antioxidant enzymes and antioxidant-immune-cytokine-related signaling molecules in juvenile blunt snout bream (Megalobrama amblycephala). Fish Shellfish Immunol. 51:189–199. doi:10.1016/j.fsi.2015.11.033.
- Harper AE, Benevenga NJ, Wohlhueter RM. 1970. Effects of ingestion of disproportionate amounts of amino acids. Phys Rev 50:428–558. doi:10.1152/physrev.1970.50.3.428.
- Henry Y, Sève B. 1993. Feed intake and dietary amino acid balance in growing pigs with special reference to lysine, tryptophan and threonine. Pig News Information. 14:35–43. http://prodinra.inra.fr/record/109560
- Higuchi LH, Feiden A, Maluf MLF, Dallagnol JM, Zaminhan M, Boscolo WR. 2011. Avaliação eritrocitária e bioquímica de silver catfish (Rhamdia quelen) submetidos à dieta com diferentes níveis proteicos e energéticos. Ciên. Anim. Bras. 12:70–75.
- Hussain SM, Khalid MA, Bashir F, Shahzad MM, Hussain AI. 2022. Impact of lycopene supplemented canola meal based diet on growth performance, nutrient digestibility and antioxidant status of catla catla fingerlings. The Jour. of Anim. Plan. Scien. 32(2):571–577.
- Jobling M. 1983. A short review and critic of methodology used in fish growth and nutrition studies. Journ. Fish Biol. 23:685–703. doi:10.1111/j.1095-8649.1983.tb02946.x.
- Keembiyehetty CN, Gatlin DM. 1997. Dietary threonine requirement of juvenile hybrid striped bass (Morone chrysops♀ × M. saxatilis♂). Aquac. Nut. 3(4):217–221. doi:10.1046/j.1365-2095.1997.00089.x.
- Kubota EH, Emanuelli T. 2004. Processamento do pescado. In: Baldisserotto B, Radünz Neto J, editors. Criação de jundiá. Santa Maria: ed. UFSM; p. 201–222.
- Lazzari R, Radünz Neto J, Emanuelli T, Pedron FA, Costa ML, Losekann ME, Correia V, Bochi VC. 2006. Diferentes fontes protéicas para a alimentação do jundiá (Rhamdia quelen). Ciên. Rur. 36:240–246. doi:http://doi.org/10.1590/S0103-84782006000100037.
- Lehninger A. 2007. Aminoácidos, peptídios e proteínas. In: Nelson DL, Cox MM, editors. Lehninger. Princípios de bioquímica. 4th. ed. São Paulo: Salvier; p. 74–111.
- Luzzanaa U, Hardy RW, Halver JE. 1998. Dietary requirements of arginine of Oncorhynchus kisutch. Aquaculture. 163:137–150. doi:http://doi.org/10.1016/S0044-8486(98)00228-2.
- MC Leod M. 1997. Effects of amino acid balance and energy: protein ratio on energy nitrogen metabolismo in male broiler chicken. Brit. Poul. Sci. 38:405–411. doi:10.1080/00071669708418010.
- Melo JFB, Lundstedt ML, Méton I, Baanante IV, Moraes G. 2006. Effects of dietary levels of protein on nitrogenous metabolism of Rhamdia quelen (Teleostei: Pimelodidae). Comp. Biochem. Physiol. A. 145:181–187. doi:10.1016/j.cbpa.2006.06.007.
- Meyer G, Fracalossi DM. 2004. Protein requirement of jundia fingerlings, Rhamdia quelen, at two dietary energy concentrations. Aquaculture. 240:331–343. doi:10.1016/j.aquaculture.2004.01.034.
- Meyer G, Fracalossi DM. 2005. Estimation of jundiá (Rhamdia quelen) dietary amino acid requirements based on muscle amino acid composition. Scient. Agr. 62:401–405. doi:http://doi.org/10.1590/S0103-90162005000400015.
- Millward DJ. 1989. The nutritional regulation of muscle growth and protein turnover. Aquaculture. 79:1–58. doi:10.1016/0044-8486(89)90441-9.
- Montes-Girao PJ, Fracalossi DM. 2006. Dietary lysine requirement as basis to estimate the essential dietary amino acid profile for jundiá, Rhamdia quelen. Jour. Wor. Aquac. Soc. 37:388–396.
- National Research Council (NRC) 2011. Nutrients requirements of fish and shrimp. Washington, DC: National Academy Press; p. 392.
- Nelson DL, Cox MM. 2011. Lehninger principles of biochemistry. (5th ed.) New York: Freman. p. 1052.
- Nose T. 1979. Summary reporto n the requirements of essential amino acids for carp. In: Halver JE, Tiews K., editors. Finfish nutrition and fish feed tecnology. Berlin: Heenemann Gmbh; p. 145–156.
- Nose T, Arai S, Lee DL, Hashimoto Y. 1974. A note on amino acids essential for growth of young carp. Bull. Jap. Soc. Scien. Fis. 40:903–908.
- Park JT, Johnson MJ. 1949. Submicro determination of glucose. The Journ. Biol. Chem. 181:149–151.
- Pianesso D, Radünz Neto J, da Silva LP, Goulart FR, Adorian TJ, Mombach PI, Loureiro BB, Dalcin MO, Rotili DA, Lazzari R. 2015. Determination of tryptophan requirements for juvenile silver catfish (Rhamdia quelen) and its effects on growth performance, plasma and hepatic metabolites and digestive enzymes activity. An. Fe. Scien. Tech. 210:172–183. doi:http://doi.org/10.1016/j.anifeedsci.2015.09.025.
- Ravi J, Devaraj KV. 1991. Quantitative essential amino acid requirements for growth of Catla catla (Hamilton). Aquaculture. 96:281–289.
- Roberts RJ, Ellis AE. 1989. The anatomy and physiology of teleosts. In: Roberts RE, editor. Fish pathology. London: Bailliere Tindall; p. 13–55.
- Rossato S, Pretto A, Freitas IL, Battisti EK, Lazzari R, Radünz Neto J. 2013. Incorporação de farinhas de resíduos de jundiá na dieta: bioquímica plasmática, parâmetros hepáticos e digestivos. Cien. Rur. 43:1063–1069.
- Rotili DA, Rossato S, Freitas IL, Martinelli SG, Radünz Neto J, Lazzari R. 2017. Determination of methionine requirement of juvenile silver catfish (Rhamdia quelen) and its effects on growth performance, plasma and hepatic metabolites at a constant cystine level. Aquac Res 00:1–9.
- Salhi M, Bessonart M, Chediak G, Bellagamba M, Carnevia D. 2004. Growth, feed utilization and body composition of black catfish, Rhamdia quelen, fry fed diets containing different protein and energy levels. Aquaculture. 231:435–444.
- Santiago CB, Lovell LT. 1988. Amino acid requirement for grow of Nile tilapia. The Journ. Nutrit. 118:1540–1546.
- Schmelzle T, Hall MN. 2000. TOR, a central controller review of cell growth. Cell. 103:253–262.
- Silva LCR, Furuya WM, Santos LD, Santos VG, Silva TSC, Pinsetta PJ. 2006. Níveis de treonina em rações para tilápias-do-Nilo. Rev. Bras. Zoot. 35:1258–1264. doi:http://doi.org/10.1590/S1516-35982006000500002.
- Small BC, Soares JH. 1999. Quantitative dietary threonine requirement of juvenile striped bass Morone saxatilis. Journ. Wor. Aquac.Soc. 30:319–323.
- Spies JR. 1957. Colorimetric procedures for amino acids. Methods Enzymol. 3:467–477.
- Van Soest PJ, Robertson JB, Lewis BA. 1991. Methods for dietary fiber, neutral detergent fiber, and nonstarch polysaccharides in relation to animal nutrition. Journ. Dai. Scien. 74:3583–3597.
- Verdouw H, Van Echteld CJA, Dekkers EMJ. 1978. Ammonia determination based on indophenols formation with sodium salicylate. Water Resear. 12:399–402.
- White JA, Hart RJ, Fry JC. 1986. An evaluation of the Waters Pico-Tag system for the aminoacidanalysis of food materials. J. Autom. Chem. 8:170–177.
- Wilson RP. 2002. Amino acids and protein. In: Halver JE, Hardy RW, editors. Fish nutrition (3th. Revised). New York: Academic Press. p. 143–179.
- Wilson RP, Allen OW, Robinson EH, Poe WE. 1978. Tryptophan and threonine requirements of fingerling channel catfish. The Journ. Nutrit. 108:1595–1599. doi:10.1093/jn/108.10.1595.