
 ?Mathematical formulae have been encoded as MathML and are displayed in this HTML version using MathJax in order to improve their display. Uncheck the box to turn MathJax off. This feature requires Javascript. Click on a formula to zoom.
ABSTRACT
This study aimed to provide a better understanding of the type, function, and production potential of Central Highland goats. Morphometric measurements were collected from 510 heads of goats. About 17 biologically important structural indices were computed using morphological trait measurements. The data were analyzed using SAS’s general linear model, principal component analysis, and stepwise multiple regression techniques. Body index value indicate that the Central Highland goat’s shape is rectangular, which is good conformation for meat production. The dactyl thorax, transverse pelvic, longitudinal pelvic, relative depth of thorax, and width indices suggest their suitability for meat production. However, proportionality and length indices showed an aptitude for milk production. Besides, the body ratio and depth indices indicate less susceptibility of this goat breed to dust infestation and arthritis, good walking ability, good foraging capability, and move easily in sloppy areas. In conclusion, structural indices showed that Central Highland goats could be classified as having a dual purpose and better aptitude for meat production. The results of this study could be an input for designing genetic improvement and conservation programmes for the sustainable utilization of indigenous goats.
Introduction
Goats are vital animals particularly in the tropics because of their adaptation to harsh climates conditions, disease tolerance capacity, and they can provide a full range of products for humans. The goat population in Ethiopia is about 51 million and almost entirely, (99.9%) is composed of indigenous goats (CSA Citation2020). Despite the large population, importance for resource-poor farmers, and adaptability of wide agroecology, the current level of productivity is low (Abraham et al. Citation2019) and not fully exploited Desta et al. (Citation2013). Thus, improving their productivity and conservation are quite important activities for the sustainable use of this species in this challenging world. Knowledge of the characteristics, type, function, and production potential of a specific goat breed is quite important for designing a genetic improvement and conservation programme.
The major aim of goat production is for meat and milk production, as well as for income generation through the selling of live animal and their products. Meat and milk production is associated with live weight, type, morphometric measurements, and structural indices of animals (Chacon et al. Citation2011). Morphological measures are important parameters to describe the growth of animals and used as selection criteria for domestic animals (Putra and Ilham Citation2019). Moreover, the combination of morphological traits in the form of structural indices is quite important for determining the type, aptitude, function, and production performance of animals (Chiemela et al. Citation2016; Worogo et al. Citation2022). Besides, structural indices could support the genetic improvement programme through selection and are more reliable than individual zoometric measures (Salako Citation2006). In addition, structural indices are used to select animals at an early age as these indices are independent of the age of animals (Salako Citation2006). Indeed, structural indices for different goat breeds were reported in previous studies elsewhere (Chacon et al. Citation2011; Khargharia et al. Citation2015; Chiemela et al. Citation2016; Dea et al. Citation2019; Tade et al. Citation2021; Getaneh et al. Citation2022). Nevertheless, the heritability of these traits is low and hence largely influenced by non-genetic factors (Banerjee Citation2016) and also affected by breed, as the type, function, and aptitude of production are varied among different goat breeds.
Besides, most goat producers live in rural areas where measuring the live weight of goats is very difficult due to lack of scales used to weigh their animals. Moreover, drug administration and sale prices depend entirely on the live weight of goats. However, there is little information available in the literature about the utilization of morphological measures as an estimation of live weight and no information on the type, function, and production potential of Central Highland goats. Therefore, this study aimed to determine structural indices in Central Highland goats to provide a better understanding of their type, function, and production potential and also to develop live weight prediction equations using morphological measurements.
Materials and method
Study area
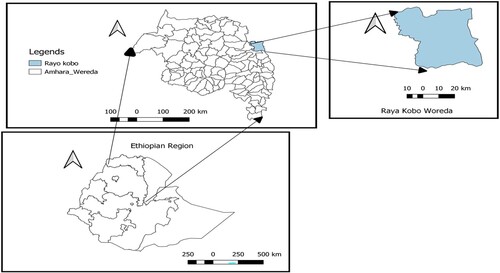
The study was conducted in Raya Kobo district, north Wollo zone of Amhara National Regional State of Ethiopia. The administrative capital Kobo is 50 km from the zonal capital Woldia and 470 km from the regional capital, Bahr Dar. Geographically it is located from 12°50″ 0″ N to 13°20″ 0″ N latitude and 36°50″ 0″ E to 37°30″ 0″ E longitude. The map of the study area is shown in .
Figure 1. Map of the study area.
Sampling techniques
Raya Kobo district was selected purposively based on the potential of the goat population and the relative importance of goats. Group discussions were held with experts working at district and kebele levels, with elders representing the study areas and other key informants. These discussions were used to obtain appropriate information about goat distribution and population before the commencement of the actual survey. Purposively three kebeles were selected based on goat population and agroecology (one kebele from each highland, midland, and lowland). Kebele is the smallest unit of administrative state structure similar to peasant association. Then, 510 healthy and non-pregnant goats from three agro-ecology, i.e. 111, 205, and 194 goats were selected purposively from highland, midland, and lowland agro-ecology, respectively according to FAO (Citation2011).
Morphological trait measurement and structural indices
Morphological traits were collected from 510 heads of goats (411 female and 99 male goats). The morphological measured traits include live weight, wither height, body length, chest girth, chest width, chest depth, rump height, ramp width, rump length, cannon bone circumference, punch girth, head length, head width, ear length, neck girth, scrotum circumference, and horn length. Height and length were measured using 1.5-meter long tape and live weight was measured using a weighing balance with a 50 kg capacity. All measurements were taken with the animals standing on a flat surface with heads held up. The morphological traits of goats were measured properly without any invasive procedure according to FAO (Citation2011). Thus, ethical approval was not applicable. Seventeen biologically important structural indices () were computed using the data obtained from nine morphological trait measurements shown in .
Figure 2. Morphological trait measurements (1, head length (HL); 2, head width (HW); 3, ear length (EL); 4, horn length (HOL); 5, neck girth (NG); 6, chest width (CW); 7, chest depth (CD); 8, wither height (WH); 9, cannon bone circumference (CBC); 10, chest girth (CG); 11, body length (BL); 12, paunch girth (PG); 13, rump height (RH); 14, rump length (RL); 15, rump width (RW)).
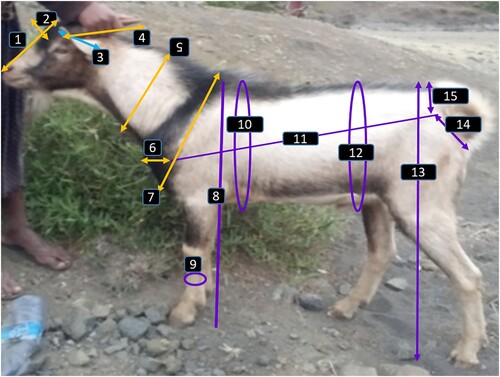
Table 1. Equation for computation of structural indices for Central Highland goats and their biological interpretation.
Data analysis
The general linear model procedure of statistical analysis system (SAS) was employed to analyze the effect of agro-ecology on structural indices of goats. General linear model is the appropriate technique for unbalanced data. Based on the result of general linear model, the post hoc analysis (least square mean separation) was done using the adjusted Tukey–Kramer test. Pearson’s correlation was used to estimate the correlation coefficient among investigated traits (among structural indices and among morphological traits) and the stepwise multiple regression procedure of SAS was used to obtain models for estimation of live weight from morphological traits. Stepwise regression is used to design a regression model to introduce only relevant and statistically significant variables and it's computationally efficient. The higher values of coefficient of determination (R2) were used to determine those traits that contribute much to the response variable. Principal component analysis (PCA) was performed using the PRINCOMP procedure of SAS to evaluate the multivariate relationship of structural indices. In addition, PCA is a data reduction technique to examine the modes of variation of a multivariate random variable in a high dimension.
The model for goat morphological indices was:
Where Yij is the structural indices of goats; µ is the overall mean; Ai is the effect of ith agroecology (i = lowland, midland, and highland), and eij is random residual error.
The model for multiple linear regression was:
Where Y is the response variable or live weight; β0 is the intercept; X1 … .Xn is the explanatory variables (body length, wither height, chest girth, chest width, chest depth, rump height, rump length, rump width, punch girth, neck girth, head length, head width, ear length, scrotum circumference (for male only), muzzle circumference, and horn length); β1 … , βn = regression coefficients of the variables X1 … , Xn and ej is random error. The potential biases in sample selection and the influence of environmental factors on morphological traits could be the limitation of this study.
Results and discussion
Structural indices to determine the type and function of goats
The most important structural indices for indigenous Central Highland goats are shown in . Agroecology exerted a significant influence on most of the structural indices of goats except body ratio (BR) and height slope (HS). Goats in the lowland area had significantly lower BI, but higher DTI, TD, CI, CPI, PP, and DI compared to goats in midland and highland agroecology. However, goats in highland and midland agroecology had statistically similar values of BI, DTI, DI, WDS, and BAL. Goats in the highland area had lower TD, CI, CPI, and AI than goats in the other agroecology. The inconsistency of morphological indices across locations was noted elsewhere (Dea et al. Citation2019; Hankamo et al. Citation2020; Getaneh et al. Citation2022). The different values of structural indices across agroecology could be explained by the variability of management and physical environment across locations.
Table 2. Structural indices (LSM ± SE) of indigenous goats.
The magnitude of structural indices has biological interpretation, which could used to identify the type and function of animals. Besides, the uses of structural indices for the prediction of the live weight of animals are more reliable when compared to linear measurements alone (Banerjee Citation2016). Body index (BOI) is one of the ethnological indexes associated with the proportion of animals (Cerqueira et al. Citation2011). As per the value of BOI, indigenous Central Highland goats in the highland and midland agroecology could be classified as longiline, while goats in the lowland area are categorized as mesolinear according to Khargharia et al. (Citation2015). In addition, BOI is associated with the type and shape of animals and lower BOI values indicate that the animal is rectangular, which is good conformation for meat production (Cerqueira et al. Citation2011). The value of BOI also indicates that the chest girth is higher than body length, which is an indicator of foraging capability, particularly in rugged topography (Banerjee et al. Citation2014; Khargharia et al. Citation2015). The value of BOI in this study is comparable with the report of Getaneh et al. (Citation2022), higher than the report of Chiemela et al. (Citation2016), Dea et al. (Citation2019), Putra and Ilham (Citation2019), and Tade et al. (Citation2021), but lower than the value noted by Hankamo et al. (Citation2020). The variability of values of structural indices among studies could be explained by the difference in type and function of goat breeds and due to inconsistency of management of goats across studies.
The DTI indicates skeletal fineness and it is greater in meat animals compared to milk animals (Salako Citation2006; Chacon et al. Citation2011; Khargharia et al. Citation2015). Besides, according to Chacon et al. (Citation2011), the DTI may not be >10.5 in light animals, up to 10.8 in intermediary, up to 11.0 in light meat animals, and up to 11.5 in heavy meat type. Based on DTI value, Central Highland goats could be classified as heavy meat-type animals. Consistently, several authors (Deribe and Taye Citation2013; Gatew et al. Citation2019; Tesema and Kebede Citation2022) noted a higher body weight (13.8–16.3 kg at six months and 20.6 kg at yearling) for this goat breed compared to other Ethiopian indigenous goat breeds/populations. The DTI in this study is higher than the result reported elsewhere (Chacon et al. Citation2011; Chiemela et al. Citation2016; Putra and Ilham Citation2019; Getaneh et al. Citation2022; Tade et al. Citation2021). The BR value indicates that the wither was higher than the rump which indicates Central Highland goats are higher in the front. This result is in agreement with Banerjee (Citation2016) and Worku (Citation2019). Animals with such type of BR may not be prone to dust infestations and related infections, and not suffer from arthritis at a later age as well according to Hankamo et al. (Citation2020). The variation of DTI and BR across studies may not be surprising, as these indices are influenced by genetic and non-genetic factors.
The value of THD obtained in this study is nearly similar to the result reported by previous studies for different goat breeds (Chiemela et al. Citation2016; Getaneh et al. Citation2022) and lower than the result noted by other studies (Khargharia et al. Citation2015; Chiemela et al. Citation2016; Dea et al. Citation2019). However, the current result is higher than the report of (Tade et al. Citation2021). Particularly in highland altitudes, THD indicates the thorax development, fitness, and capacity of the respiratory system of animals (Chacon et al. Citation2011; Khargharia et al. Citation2015). In addition, thoracic development is correlated with the muscular development and strength of the animal (Bravo and Sepulveda Citation2010). The obtained values of THD in this study indicate that Central Highland goats have moderate thoracic development and are more adapted to mid-altitude rather than high altitude.
Proportionality index (PPI) is a good indicator of the shape of animals according to Silva-Jarquin et al. (Citation2019). The value of proportionality in this study is comparable to the report of Getaneh et al. (Citation2022) and higher than the report of Dea et al. (Citation2019) and Tade et al. (Citation2021). The value of PPI was higher than 100 for the goat population in all agroecology. According to Silva-Jarquin et al. (Citation2019), the proportionality index >100 indicates that the animals are square in shape, which is a characteristics of the dairy type. However, if the value of PPI is <100, the shape of animals is tending to be rectangular, which is the character of meat-type animals. The average daily milk yield and lactation milk yield of Central Highland goats under a semi-intensive management system are 0.28 and 34.5 kg, respectively according to Tesema et al. (Citation2020). The milk production potential of indigenous Ethiopian goats under semi-intensive (on-station) management ranges from 0.28 kg/day for Afar goat (Awigchew et al. Citation1989) to 1.13 kg/ day for Arsi Bale goat (Mestawet et al. Citation2012). These phenotypes indicate that the milk production potential of Central Highland goats is within the range noted for indigenous goats under a semi-intensive management system.
According to Salako (Citation2006), morphological indices related to bone growth, length slope, and height slope indicates the type of animals. The value of the length index in this study indicates that the animals are near a square in shape and such types of animals are less susceptible to spinal problems according to Chacon et al. (Citation2011). The balance of body length and wither height is quite important and goats with short legs and extended bodies are likelier to have sliding disc issues. However, goats in this study are less prone to such problems. The forequarter of goats was longer than the hindquarter as the value of height slope shows. This type of body structure enables them to move more easily in sloppy or in mountain areas than goats with a longer hind quarter.
Structural indices such as depth index, width index, balance, and cumulative index are associated with the function of animals (Salako Citation2006; Chacon et al. Citation2011). The width index (WDI) indicates that the rump width is slightly lower than the chest width of animals. This result is in agreement with the result of Salako (Citation2006), Banerjee (Citation2016), and Worku (Citation2019) for sheep. However, WDI is lower than the result noted by Getaneh et al. (Citation2022) but higher than other studies (Khargharia et al. Citation2015; Chiemela et al. Citation2016). The value of WDI implies that Central Highland goats have well-sprung ribs with enough space for large lung space and the higher value of chest width than rump width shows their suitability for meat production.
The depth index (DI) in this study indicates that the chest depth of goats was 50–54% of the wither height and this suggests that this goat population have a good walking ability and can graze by travelling long distance due to their good capacity of the lung. Besides, according to Nurfaridah et al. (Citation2014), animals with a depth index value >0.5 can be classified as the fat type with short-legged, while the fat type with long-legged has a DI index value of <0.5. The DI value of goats in the lowland area in this study was higher than 0.5, which indicates that goats in this agroecology are fat-type and short-legged, while goats in midland and highland are classified as fat-type with long-legged.
The pelvic index is one of the important structural indexes associated with the reproductive traits of goats (Silva-Jarquin et al. Citation2019) and indicates animals’ potential for meat production (Dauda Citation2018), and is used to examine the uniformity of the hind limbs of animals. The value obtained in the current result indicates that the goats are convexilinear or have a convex rump, as the value is less than 100. This result is consistent with the report of Silva-Jarquin et al. (Citation2019) for Black Creole goats. The pelvic index in this study is lower than the value noted by Chacon et al. (Citation2011), Dea et al. (Citation2019), and Tade et al. (Citation2021). The BAL is positively associated with meat quantity, particularly with the dressing percentage of animals (Salako Citation2006; Banerjee Citation2016).
Transverse pelvic (TPI) and longitudinal pelvic indices (LPI) are functional indices that show animals potential for meat production. A TPI greater than 33 and an LPI less than 37 are indicators of meat breeds (Silva-Jarquin et al. Citation2019). The TPI and LPI values of the goat population in this study were 19.4 and 28.4, respectively, which is an indicator of meat-type animals and a medium tendency that allows it to develop muscle tissue as well. The TPI and LPI value obtained in this study is comparable with the result reported by Getaneh et al. (Citation2022). Likewise, the value of LPI is comparable with other studies (Dea et al. Citation2019) and higher than the result noted by Silva-Jarquin et al. (Citation2019). However, Dea et al. (Citation2019) and Silva-Jarquin et al. (Citation2019) reported higher TPI values than the current finding. A higher value of relative depth of thorax index (RDI) corresponds to animals with long-legs and animals with higher RDI have a higher kinetic capacity, being more adapted to plains and long treks with bodies further from the ground to avoid heat radiation according to Sastre (Citation2003) and Chacon et al. (Citation2011). In addition, an RDI value greater than 50 indicates the animal’s tendency to a meat phenotype (Silva-Jarquin et al. Citation2019), and thus the value of RDI in this study indicates that Central Highland goats are suitable for meat production.
Correlation among structural indices
The Pearson correlation estimates, which indicates the relationship between the most important zoometric indices are presented in . A higher and positive correlation was observed for BR-HS (0.99), BR-AI (0.90), WDS-BAL (0.88), CI-THD (0.82), CPI-AI (0.83) and CI-CPI (0,82). Likewise, a moderate and positive correlation was obtained for TPI-PLI (0.75), DI-THD (0.67), DI-CI (0.62), LI-BOI (0.62), RDI-THD (0.67), RDI-CI (0.62) and PLI-WDS (0.61). On the contrary, moderate to higher and negative correlation was obtained for LI-PPI (−0.99), PPI-BOI (−0.62), AI-DTI (−0.56), and BOI-THD (−0.54). The correlation estimate for most of the remaining traits was found to be low and negative. In line with this study, Chacon et al. (Citation2011) noted low and negative correlation estimates for structural indices of goats. The correlation of structural indices in this study was in agreement with previous studies on different goat breeds (Banerjee Citation2016; Chiemela et al. Citation2016; Putra and Ilham Citation2019; Getaneh et al. Citation2022). Moderate to high and positive correlation estimate among structural indices suggests that one zoometric index could be the indicator for the other index and thus selection could be conducted using one of them.
Table 3. Pearson correlation estimates for structural indices.
Principal component analysis of structural indices
Based on the Kaiser method (Kaiser Citation1960) and the proportion of variance explained, five principal components were identified. PC1, PC2, PC3, PC4, and PC5 explained about 32.4, 22.9, 13.5, 11.4, and 6.4% of the variation, respectively (). These five principal components explained 86.7% of the variation of the structural indices. The reduction from 17 structural indices to five PCs could be due to a strong and positive correlation between the structural indices, which can also create redundant information in genetic evaluations that consider these all indices at the same time as selection criteria.
Table 4. Eigenvectors and eigenvalues of the selected principal components for structural indices of Central Highland goats.
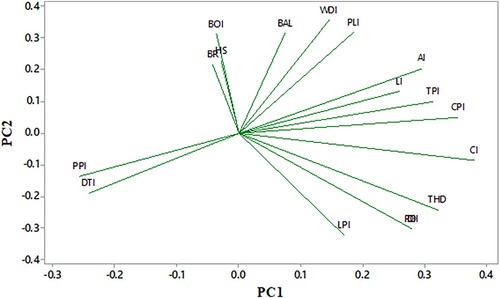
The eigenvectors of the selected principal components for the 17 structural indices are shown in . THD, CI, CPI, AI, and TPI have a large positive loading or weight on PC1. The positive coefficient for these indices shows that there is a common underlying association among all these indices. However, the relative weight of PLI, WDI, DI, and RDI was better in PC2. The coefficient indicates that DI and RDI responded differently from PLI and WDI. BR, HS, LI, and PPI were more associated with PC3, whereas BOI more correlated with PC4, and structural indices such as DTI, BAL, and LPI had a greater and positive weight in PC5. This is because the elements in the same cluster are likely controlled by the same genomic locations (Khargharia et al. Citation2015). Therefore, the association between PCs and structural indices suggests the possibility of selection for multiple indices using the more associated PC. The selection of animals for any principal component will produce an independent response in terms of other principal components. The loading plot for the first two principal components is shown in . The angle between vectors of structural indices shows the correlation among indices, i.e. the low and high angle between vectors indicates a strong and low correlation, respectively. In addition, the more parallel to a principal component axis is a vector, the more it contributes only to that principal component.
Figure 3. Loading plot of structural indices of Central Highland goats.
Correlation of live weight and morphometric traits
Correlation is the measure of the relationship between two variables or traits Abegaz (Citation2014). The Pearson correlation coefficient (r) which measures the association of live weight with morphological traits of male and female Central Highland goats is presented in . The result of this study revealed that all structural traits were positively and significantly correlated (r = 0.44–0.91, P < 0.001) with the live weight of female goats. Traits such as chest girth (CG), paunch girth (PG), wither height (WH), chest depth (CD), rump height (RH), rump length (RL), and rump width (RW) were highly correlated with the live weight of female goats (r = 0.82–0.91, P < 0.001). Several authors (Hassen et al. Citation2012; Gatew Citation2014; Dorantes-Coronado et al. Citation2015) reported a strong correlation between chest girth and live weight. High correlations between morphological traits and the live body weight of female goats in this study show that the live weight of female goats can be predicted from these measurements of goats.
Table 5. Phenotypic correlation between live weight and morphological traits for female (below diagonal) and male (above diagonal) goats.
For males, the live weight was positively and significantly correlated (r = 0.25–0.91) with all morphological traits. The estimates of the correlation coefficient in this study were higher than the report of Gatew (Citation2014) for indigenous goats. Wither height (WH), rump height (RH), chest girth (CG), body length (BL), chest depth (CD), and rump width (RW) had a higher correlation with the live weight of male goats and the correlation coefficient (r) ranged from 0.84 to 0.91. Similarly, high correlations of CG, BL, WH, and CD with the live weight of male goats were reported by Dorantes-Coronado et al. (Citation2015). In contrast, PG and HW had a low and moderate correlation with the live weight. The observed high relationship between live weight and morphological traits (WH, RH, CG, BL, CD, and RW) in this study suggests that either of these variables or their combination could provide a good estimate for predicting the live weight of goats and could be used for indirect selection of male Central Highland goats for live weight.
Bio-prediction of live weight using morphological trait measures
Even though using weighing scales is the best approach to determine an animal’s live weight, reliable weight measurements in villages are sometimes difficult due to a shortage of weighing scales (Dorantes-Coronado et al. Citation2015). In this situation, the prediction of live weight using a few morphological traits would be preferable. Therefore, in this study, a stepwise multiple regression procedure was conducted to generate prediction equations for the live weight of a goat from different morphological traits. The multiple regression analyses of live weight on morphological traits for female and male goats are shown in and , respectively. For female goats, CG, BL, PG, RH, MC, HW, NG, and HL significantly (P < 0.05) contributed to the model or prediction of live weight. For males, WH, CG, BL, RH, RW, PG, and HOL significantly (P < 0.05) contributed to the model. However, using these morphological traits for live weight prediction is difficult, and thus need to prioritize the most important morphological traits of goats.
Table 6. Multiple regression analysis of live weight on different morphological traits of female Central Highland goats.
Table 7. Multiple regression analysis of live weight on morphological traits of male Central Highland goats.
Chest girth (CG) and wither height (WH) were of the utmost importance in the prediction of the live weight of female (R2 = 0.825) and male (R2 = 0.830) goats, respectively. Similarly, Leng et al. (Citation2010), Hassen et al. (Citation2012), Bello and Adama (Citation2012), Gatew (Citation2014) reported the highest correlation between live weight and chest girth. Muscle, some fat, and bone structure contribute to the formation of chest girth (Leng et al. Citation2010), this could explain its association with the live weight of goats. The coefficient of determination (R2) which indicates the proportion of the total variability explained by the model was the criterion used to select the best model for the estimation of the live weight. The inclusion of other explanatory variables besides CG and WH increased the coefficient of determination (R2) to 0.910 in females and 0.911 in male goats. For females, the inclusion of other variables in Model 3 (CG + BL + PG) would result in an insignificant improvement in the coefficient of determination. Similarly, for male goats, the addition of other independent variables in model 3 (WH, CG, and BL) had not a substantial improvement in the precision of prediction. Besides statistics, however, considering the simplicity and applicability of prediction equations under an extensive production system is important. Thus, the CG and WH would be of the upmost importance in the estimation of the live weight of female and male Central Highland goats, respectively. The prediction equation for males, live weight = −41.3 + 0.95*WH, and for females, live weight = −34.5 + 0.83*CG. Morphometric traits are more feasible and less expensive to measure in the field than body weight traits since they can be recorded in a single assessment. Therefore, morphometric features may help the producer make wise management decisions, such as ensuring that animals receive the appropriate feed, properly administering medications, and estimating the potential for profit.
Conclusion
Most of the structural indices showed that the Central Highland goat breed was classified as meat-type with characteristics of rectangular, well-sprung ribs, moderate thoracic development, and higher fore-quarter. In addition, proportionality and length indices showed an aptitude of this goat breed for milk production. Chest girth and wither height would be of the upmost importance in the estimation of the live weight of female and male goats, respectively. The results of this study also indicate the possibility of selection for meat and milk productivity through morphological measures and indices. Therefore, the results of this study could be an input for designing genetic improvement and conservation programmes for the sustainable utilization of Central Highland goats.
Author contributions
Tesfamichael Assefa, Zeleke Tesema: Conceived and designed the experiments, analyzed, interpreted the data and wrote the paper.
Kefyalew Alemayehu: Advise and contributed reagents, materials, analysis tools, or data. All authors review this paper.
Acknowledgment
The authors would like to acknowledge Raya Kobo district for the financial support and goat producers in the study area for their time and support.
Data availability
None of the data were deposited in an official repository. However, the data that support the study findings are available to reviewers, available from authors upon request.
Disclosure statement
No potential conflict of interest was reported by the author(s).
Additional information
Funding
References
- Abegaz S. 2014. Designing of community based breeding programs for two indigenous goat breeds of Ethiopia [PhD thesis]. Vienna: University of Natural Resources and Life Sciences.
- Abraham H, Gizaw S, Urge M. 2019. Simulated alternative breeding schemes for optimizing Begait goat improvement programs in Western Tigray, northern Ethiopia. Agric Sys. 176(2019):102669. doi:10.1016/j.agsy.2019.102669.
- Awigchew K, Yacob Y, Fletcher I. 1989. Productivity of purebred Adal and quarterbred Saanen x Adal goats in Ethiopia. In: Wilson RT, Azeb M, editors. African small ruminant research and development. Proceeding of a conference held at Bamenda, Cameroon,18–25 Jan 1989; p. 510–523.
- Banerjee S. 2016. Body indices of Garole sheep reared in West Bengal (India). In: Proceedings of the Zoological Society. New Delhi: Springer India; p. 61–73.
- Banerjee S, Beyan M, Bekele H. 2014. Some traditional livestock selection criteria as practiced by several indigenous communities of Southern Ethiopia. Anim Genet Resour/Resources Genetiques Animales/Recursos Geneticos Animales. 54:153–162. doi:10.1017/S2078633614000083.
- Bello AA, Adama TZ. 2012. Studies on body weight and linear body measurements of castrates and non-castrate Savannah Brown goats. Asian J Anim Sci. 6:140–146. doi:10.3923/ajas.2012.140.146.
- Bravo S, Sepulveda N. 2010. Indices zoometrics en ovejas criollas Araucanas. Int J Morphol. 28:489–495.
- Cerqueira JOL, Feás X, Iglesia A, Pacheco LF, Araújo JPP. 2011. Morphological traits in Portuguese Bordaleira de Entre Douro e Minho sheep: divergence of the breed. An Prod Sci. 51:635–641. doi:10.1071/AN10147.
- Chacon E, Macedo F, Velazquez F, Paiva SR, Pineda E, McManu C. 2011. Morphological measurements and body indices for Cuban Creole goats and their crossbreds. Rev Brasil Zoot. 40(8):1671–1679. doi:10.1590/S1516-35982011000800007.
- Chiemela PN, Sandip B, Mestawet TA, Egbu CF, Ugbo EH, Akpolu ES, Umanah IJ. 2016. Structural indices of Boer, Central highland and their F1 crossbred goats reared at Ataye farm, Ethiopia. J Agric Res 2:1–19.
- CSA. 2020. Agricultural sample survey 2019/20 [2012 E.C.]. Volume II report on livestock and livestock characteristics (private peasant holdings). Addis Ababa, Ethiopia: Central Statistical Agency (CSA).
- Dauda A. 2018. Morphological indices and stepwise regression for assessment of function and type of Uda sheep. J Res Rep Genet. 2:1–14.
- Dea D, Melesse A, Mekasha Y. 2019. Application of morphometric traits and body indices in assessing the type and function of local goats reared in two districts of Gamo-Gofa zone. Ethiopian J Anim Product. 19:73–90.
- Deribe B, Taye M. 2013. Growth performance and carcass characteristics of central highland goats in Sekota district. Ethiopia Agric Adv. 2(8):250–258.
- Desta D, Hagos H, Belay S, Gizaw S, Legese G. 2013. Analysis of goat value chains in Tanqua Abergelle district, Tigray, Ethiopia. Addis Ababa: ICARDA.
- Dorantes-Coronado EJ, Torres-Hernandez G, Hernandez-Mendo O, Rojo-Rubio R. 2015. Zoometric measures and their utilization in prediction of live weight of local goats in southern México. SpringerPlus. 4(2015):695. doi:10.1186/s40064-015-1424-6
- [FAO] Food and Agriculture Organization of the United Nations. 2011. Draft guidelines on phenotypic characterization of animal genetic resources. Rome, Italy: FAO.
- Gatew H. 2014. On-farm phenotypic characterization and performance evaluation of Bati, Borena and Shart eared Somali goat populations of Ethiopia [MSc thesis]. Dire Dawa: Haramaya University.
- Gatew H, Hassen H, Kebede K, Haile A, Lobo RNB, Rischkowsky B. 2019. Early growth trend and performance of three Ethiopian goat ecotypes under smallholder management systems. Agric Food Secur. 8(4):1–7.
- Getaneh M, Taye M, Kebede D, Andualem D. 2022. Structural indices of indigenous goats reared under traditional management systems in East Gojjam Zone, Amhara Region, Ethiopia. Heliyon. 8(2022):e09180. doi:10.1016/j.heliyon.2022.e09180.
- Hankamo A, Woldeyohannes T, Banerjee S. 2020. Morphometrical characterization and structural indices of Indigenous goats reared in two production systems in Sidama zone, Southern Ethiopia. Int J Anim Sci Technol. 4:6–16. doi:10.11648/j.ijast.20200401.12.
- Hassen H, Baum M, Rischkowsky B, Tibbo M. 2012. Phenotypic characterization of Ethiopian indigenous goat populations. Afr J Biotechnol. 11(73):13838–13846.
- Hernández JS, Franco FJ, Herrera M, Rodero E, Sierra AC, Bañuelos A, Delgado JV. 2002. Estudio de los recursos genéticos de México: Características morfológicas y morfoestructurales de los caprinos nativos de Puebla. Arch Zootec. 51:53–64.
- Kaiser HF. 1960. The application of electronic computers to factor analysis. Educ Psychol Meas. 20:141–151. doi:10.1177/001316446002000116.
- Khargharia G, Kadirvel G, Kumar S, Doley S, Bharti PK, Das M. 2015. Principal component analysis of morphological traits of Assam Hill goat in Eastern Himalayan India. J Anim Plant Sci. 25:1251–1258.
- Leng J, Zhu R, Zhao G, Yang Q, Mao H. 2010. Quantitative and qualitative body traits of longling yellow goats in China. Agric Sci China. 9:408–415. doi:10.1016/S1671-2927(09)60111-5.
- Mestawet TA, Girma A, Adnoy T, Devold TG, Narvhus JA, Vegarud GE. 2012. Milk production, composition and variation at different lactation stages of four goat breeds in Ethiopia. Small Ruminant Res. 105:176–181. doi:10.1016/j.smallrumres.2011.11.014.
- Nurfaridah A, Bandiati SK, Nurachma S. 2014. Cumulative index of body sizes and body weights of female composite sheep as beef sheep. J Ilm Pet. 2(1).
- Parés PM. 2009. Zoometría. In: Sañudo C, editor. Valoración morfológica de los animales domésticos. Madrid, España: Ministerio de Medio Ambiente y Medio Rural y Marino; p. 171–198.
- Putra WPB, Ilham F. 2019. Principal component analysis of body measurements and body indices and their correlation with body weight in Katjang does of Indonesia. J Dairy Vet Anim Res. 8(3):124–134. doi:10.15406/jdvar.2019.08.00254.
- Salako AE. 2006. Application of morphological indices in the assessment of type and function in sheep. Int J Morphol. 24(1):13–18. doi:10.4067/S0717-95022006000100003.
- Sastre HJ. 2003. Descripción, situación actual y estrategias de conservación de la raza bovina colombiana criolla Casanare. 330f. Tesis (Doctor en Veterinaria) -Universidad de Córdoba – Córdoba, España.
- Silva-Jarquin JC, Roman-Ponce IV, Duran-Aguilar M, VeraAvila HR, Cambron-Sandoval VH, Andrade-Montemayor HM. 2019. Morphostructural characterization of the Black Creole Goat raised in Central Mexico, a currently threatened zoogenetic resource. Animals (Basel). 9:459. doi:10.3390/ani9070459.
- Tade B, Melesse A, Betsha S. 2021. Characterization of the Indigenous goat populations of south gonder based on their morphometric traits and body indices. Ethiop J Agric Sci. 31(4):71–87.
- Tesema Z, Alemayehu K, Kebede D, Getachew T, Kefale A, Deribe B. 2020. Reproductive performance and milk production potential of Central Highland goat and their cross with Boer goat. Heliyon. 6(2020):e05836. doi:10.1016/j.heliyon.2020.e05836.
- Tesema Z, Kebede D. 2022. Do crossbreeding using exotic breeds in goat is the right solution for a low-input production system in Ethiopia? A review. Agric Rev. 43(1):11–19.
- Worku A. 2019. Structural indices of Arsi-Bale sheep. Int J Agric Agribus. 2(1):137–149.
- Worogo HSS, Offoumon TOTL, Alabi CDA, Tchokponhoue U, Idrisso UY, Assani AS, Soule F, Iwaka C, Traore IA. 2022. Zoometric index analysis in borgou cattle breed reared on station in northern Benin. J Anim Health Prod. 10(1):129–134.