
ABSTRACT
Dynamic among animal, microbiota and environment can influence the health outcome of animals. Intensive production systems, with environmental challenges and implications, are increasing important due to land limitation and market demand especially in populous regions. Analysis of temporal changes of microbiota diversity will provide baseline information and contribute to animal welfare and health management in dairy goats raised under intensive systems and influence economic outcome. The analysis of changes in microbiota population over time is made possible by employing 16S rDNA amplicon sequencing technology. Our study documented these changes in dairy goats of various physiological stages raised under the enclosed environment.
Introduction
The world's population of dairy goats has been rising in recent years. There is still no extensive breeding system, though, and other problems must be resolved expeditiously. For instance, brucellosis and other bacterial infectious diseases in dairy goats are common in many regions (Memish and Balkhy Citation2004), and these diseases are closely linked to the local climate, the health of the animal, the degree of cleaning and disinfection, and the relative abundance of the environmental microbiome. Research has found that different feeding methods and management practices do have some influence on the milk production of Saanen dairy goats. (de Souza et al. Citation2014, Adjassin et al. Citation2022). Improving the breeding environment and management practices can have a positive impact on the overall health of Saanen goats, thereby further enhancing milk production or dairy product quality.
The microbiome is the synthesis of microbial populations that are constantly evolving in a particular environment or ecosystem. Animal health and individual traits may be indicated by the microbiome associated with that animal (Liu et al. Citation2020). Changes in the composition of the microbes in the mammalian gut are crucial for determining changes in host health and immunity (Desselberger Citation2018). The microbiome of an animal's skin also gives insight into its health (Rodrigues Hoffmann et al. Citation2014). The protection and balance of the skin are impacted by skin microorganisms, which are typically found on the skin's surface, its appendages, the deep layers of the epidermis, etc. (Dréno et al. Citation2016, Bay et al. Citation2020). Studies have revealed that there are connections between the animal microbiome, the environment, and animal disease and health, and that the microbiome associated with animals might serve as an indicator of animal health and individual traits (Bernardo-Cravo et al. Citation2020). And these same changes in the microbiome can affect dairy goat health. Many bacteria present in the air can affect animal health. For example, some common respiratory symbiotic bacteria include Pasteurella, Staphylococcus, Streptococcus pneumoniae, Actinobacillus pleuropneumoniae, Haemophilus, and Klebsiella pneumoniae (Amit et al. Citation2012; Yesuf et al. Citation2012). These bacteria can cause respiratory diseases in dairy goats and, in severe cases, lead to death. Furthermore, airborne transmission can also occur for certain infectious diseases, such as zoonoses caused by Brucella, resulting in widespread infections (Ganter Citation2015). Analyzing the diversity of the microbial community and immune-related bacterial genera in dairy goat feces can potentially be considered as one of the indicators for evaluating the immune function of the organism in the future (Luo et al. Citation2022). The microbiota on the surface of dairy goats is an ecosystem that can prevent the colonization of external pathogens and regulate the immune response of the skin. However, when the balance of the skin microbiota is disrupted, it can lead to inflammation and other diseases (Hsu et al. Citation2020).
Changes in environmental risk factors (such as temperature, humidity, ventilation, lighting, etc.) can trigger stress responses in dairy goats. Clinically, veterinarians consider temperature + humidity as an accurate measurement method for heat stress (Arsoy Citation2020). Changes in temperature and humidity can also increase the incidence of infectious diseases. For example, high temperature and humidity can lead to diseases like lamb dysentery and calf coccidiosis (Coffey Citation2014), while low temperatures can potentially cause diseases like goat pneumonia (Ershaduzzaman et al. Citation2007). Moreover, studies have found that changes in environmental factors such as temperature, humidity, ventilation, and lighting can affect the susceptibility of microorganisms present in the environment, thereby impacting animal health. For example, when there is weak lighting and poor ventilation in cold conditions, Escherichia coli becomes more pathogenic, leading to septicemia in lambs (Sonawane et al. Citation2012).
In order to identify the diversity variations in the three months of spring, we examined the microbiomes of the skin, feces, and surroundings of Saanen dairy goats of various sexes and growth phases. We hypothesize that alterations in the diversity of certain groups and alterations in the microbiome both within and outside of those groups are related. We also looked at the connections between the microbiota and environmental variables. In conclusion, we hypothesize that the skin, feces, and microbiota of the Saanen dairy goat are interconnected, impact one another, and diversify through time. Skin, feces, and the environment's microbiome are examples of biological elements that may influence the microbiome's diversity (temperature, relative humidity, wind speed, light intensity).
Materials and methods
The experiment was carried out with the approval of the Animal Use and Care Committee of [blinded for peer review] University in China (Yangling, China) (permit number: 15–516, data:2015-9-13).
The experimental site is located at Saanen Dairy Goat Farm in Qianyang County, Shaanxi Province, China. The coordinates of the farm are approximately between latitude 34°34’34” to 34°56’56” N and longitude 106°56’15” to 107°22’31” E. The farm currently consists of 1 buck pen, 6 doe pens, 1 kid pen, and 2 young goat pens. The dairy goat pens used in this study represent the typical barns currently used in China. They are double-row, single-story brick and wood structures, measuring 30 metres in length, 7.5 metres in width (including a 1.5-metre feeding passage), and 5 metres in height. The doe pens and kid pen are enclosed buildings equipped with ventilation systems s, while the buck pen is a semi-enclosed building. All the pens have central loggers installed to monitor temperature and humidity. The randomly selected doe pens are specifically for lactating does, which are 32 months old and in their second parity. The kids are 70 days old, and the bucks are 32 months old. All the dairy goats used in this study are Saanen Dairy Goats. The Saanen dairy goats used in the trial were locally bred, stress- and disease-free.
Sample collection
A total of 81 samples (27 each of air feces and body surface samples, including 9 each of ram and ewe lamb pens) were collected from March through May of spring 2021 at the Saanen Dairy Goat breeding farm in Qianyang, Shaanxi, China.
Samples were collected once a month between March and May 2021. Air, feces and body surface samples of dairy goats were collected separately from buck, lactating doe and kid pens in dairy goat farms. Feeding and sterilization cleaning conditions were kept the same in the same pen.
Air samples were collected by passive deposition. The TSB culture medium (Hopebio, HB4114) is open and placed at a height of 1 metre above the ground level of the pen, exposed to the environment for 24 h. samples were placed in an incubator at 37°C for 48 h (Aarnaes et al. Citation1984; Cordeiro et al. Citation2010; Canha et al. Citation2015; Haas et al. Citation2017). The sampling locations are shown in . Each pen randomly collects three fecal samples and puts them separately into centrifuge tubes. Each pen randomly selects three dairy goats to collect surface samples. A small amount of sebum is collected from the dorsum of these dairy goats, and a small amount of wool is cut and placed into centrifuge tubes. indicates the specific locations for the collection of body surface samples. After the sample collection is complete, the samples are sent to Beijing Novogene Co., Ltd. for DNA extraction, sequencing, and analysis.
Figure 1. Schematic diagram of sampling sites. 
 Measurement points for E and WS. Height of 1 m.
Figure 2. Schematic diagram of the sampling area of microbes on the body surface. The centre of the area indicated by the red box is the sampling point.

Measurement strategy
Environmental data (including temperature, relative humidity, light intensity, and wind speed) inside the dairy goat pen were measured at 8:00, 12:00, and 16:00 on the day of sampling. Temperature and relative humidity data were recorded using logger (Beijing Huahui Shengye Technology Development Co., Ltd.) positioned at the centre of the pen. Light intensity was measured using a handheld light intensity tester (Deli high-precision illuminance metre) at a distance of 1 metre from the ground at the centre of the pen. Wind speed was measured using a digital anemometer (Habotest digital anemometer) at the same location.
Bioinformatics analysis
Each cultured bacterial sample was analyzed for 16S rDNA amplicon sequencing, and the V3-V4 region of 16S rDNA was selected for amplified sequencing (Beijing Nuohezhiyuan Technology Co., Ltd. Beijing, China).
The library is subjected to paired-end sequencing using the Illumina NovaSeq sequencing platform. The raw paired-end (PE) data obtained is then subjected to read merging and quality control to generate clean tags. These clean tags are further filtered to obtain effective data (effective tags) for subsequent analysis. The sequences are clustered into operational taxonomic units (OTUs) with a 97% identity threshold. The OTUs are then compared against the Silva138 database for taxonomic classification and species annotation at different hierarchical levels. Statistical analysis and visualization of microbial community composition and structure are performed based on OTUs and annotation results. Dilution curves are constructed using the sequencing data and corresponding species numbers extracted. Dilution curves directly reflect the rationality of sequencing data volume and indirectly reflect the richness of species in the samples. Based on the species annotation results, species with relatively high abundance at the phylum and genus levels in each group are selected. A column cumulative abundance chart of species relative abundance is generated to visualize the high-abundance species and their proportions in different classifications across samples. A correlation coefficient plot is created to illustrate the correlations between microbial communities in the samples. Spearman correlation coefficient, which measures the strength and direction of monotonic relationships between variables, is used. Spearman correlation coefficient is a non-parametric statistical method that allows for analysis of the ranking order of variables without assumptions about the distribution of the original variables, making it widely applicable. Spearman correlation is employed to investigate the relationship between environmental factors and microbial species abundance and to study the mutual changes between environmental factors and species, providing information on the correlation and significance (P-values) between pairs of variables.
Data obtained from samples were expressed as mean ± SEM. One-way ANOVA for repeated measures was used to determine changes in environmental factors in various pens from March to May. The Duncan's multiple range test was used to identify significant differences (SPSS 21.0). The significant differences between the means were at P < 0.05. When the homogeneity of variance test is not uniform, a nonparametric test is used to judge the significance.
Results
Through the splicing of reads, an average of 101,671 tags were measured per sample, and an average of 97,967 valid data were obtained after quality control. The sequences were clustered into Operational Taxonomic Units (OTUs) with 97% identity and a total of 4,931 OTUs were obtained. Afterwards the OTUs sequences were species-annotated with the Silva138 database. A total of 2,326 (47.17%) OTUs were annotated to the genus level. According to the species annotation results, bacterial phyla and genera with obvious abundance at the bacterial taxonomic level were identified. A total of 55 phyla, 126 classes, 297 orders, 460 families and 832 genera were identified. In the construction of relative abundance in , only the top 10 phyla and the top 30 genera were listed individually. The remaining phyla and genera with low relative abundance were combined and displayed in the ‘Other’ category.
Figure 3. The dilution curve of the microbial community. G1 = air samples of buck; G2 = fecal samples of buck; G3 = body surface samples of buck; M1 = air samples of doe; M2 = fecal samples of doe; M3 = body surface samples of doe; X1 = air samples of kid; X2 = fecal samples of kid; X3 = body surface samples of kid.
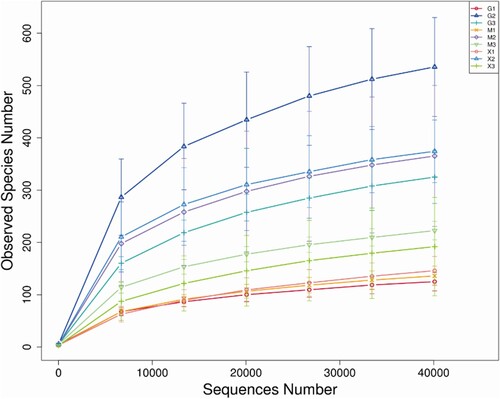
Figure 4. The relative abundance of bacteria at the phylum and genus levels in the buck pen. (a) Phylum in March, (b) Genus in March, (c) Phylum in April, (d) Genus in April, (e) Phylum ln May, and (f) Genus in May.
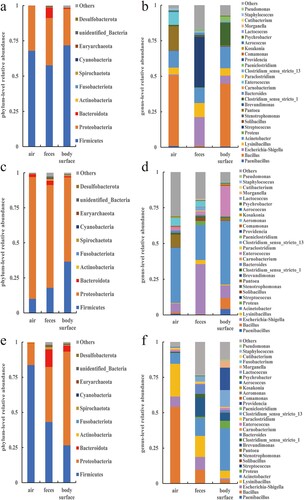
Figure 5. The relative abundance of bacteria at the phylum and genus levels in the doe pen. (a) Phylum in March, (b) Genus in March, (c) Phylum in April, (d) Genus in April, (e) Phylum ln May, and (f) Genus in May.
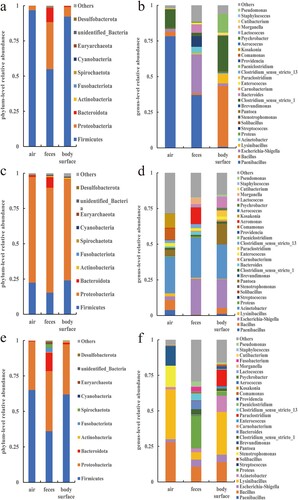
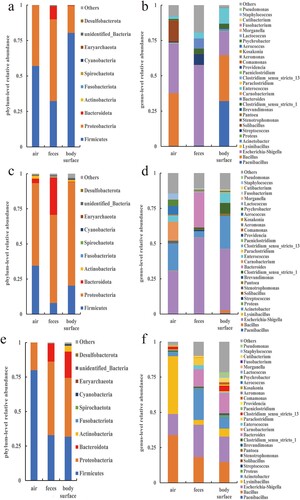
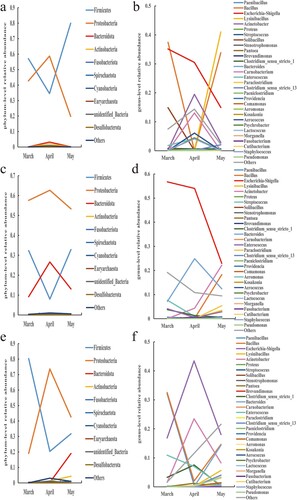
Figure 6. The relative abundance of bacteria at the phylum and genus levels in the kid pen. (a) Phylum in March, (b) Genus in March, (c) Phylum in April, (d) Genus in April, (e) Phylum ln May, and (f) Genus in May.
The dilution curve of the microbial community tends to flatten as the sequencing depth increases. This indicates that the amount of measured data is reasonable and has essentially reached the sequencing depth, as shown in .
Dominant bacterial phyla and genera in the air, feces and body surface
show the relative abundance of bacterial phyla and species from March to May in various samples from the three pens. Firmicutes and Proteobacteria were the most prevalent bacterial taxa found in samples of the air, feces, and body surfaces taken from buck, doe, and kid pens. Opportunistic pathogenic bacteria, including Bacillus, Escherichia-Shigella, and Acinetobacter, are among the prominent bacterial genera. Although the major bacterial phyla and genera of several sample groups were essentially the same, the relative abundance ratios varied and also changed with time.
Temporal changes in relative abundance of bacteria in various goat pens
Each pen sample's major bacterial phyla and species saw dynamic changes in relative abundance over time (). It is not difficult to discover that the shifting tendencies for the two major bacterial phyla, Firmicutes and Proteobacteria, are visibly at odds with one another. The relative abundances of the predominate bacterial phyla in all other samples – apart from the body surface samples of the buck – showed clear inflection points in April. Proteobacteria increased first and then reduced in almost all samples from March to May, whereas Firmicutes decreased first and then increased in relative abundance. Based on the information provided, it can be speculated that the environmental conditions within the pens in April may be more suitable for the growth and reproduction of bacteria belonging to the phylum Proteobacteria, while potentially inhibiting the proliferation of bacteria belonging to the phylum Firmicutes. Although April marked the inflection point for the relative abundance trends of the genera, which were similar to those of the phyla to which they belonged, the overall picture was more complex. The majority of genera’ relative abundance variations are consistent with the phyla to which they belong, with the exception of a few (such Bacillus, Acinetobacter, Escherichia-Shigella, etc.) that are marginally different and may be attributed to their own traits influenced by outside causes. The relative abundance of Bacillus was also lower in April. The relative abundance changes of Acinetobacter were similar to those of Bacillus. However, the relative abundance of Shigella showed an opposite trend compared to Bacillus. Over time, the relative abundance of Shigella gradually increased, reaching a higher level in April, and then decreased again in May.
Figure 7. Trends of relative abundances of bacteria in air, feces, and body surface in the buck pen. (a) Air phylum, (b) Air genus, (c) Fecal phylum, (d) Fecal genus, (e) Body surface phylum, and (f) Body surface genus.
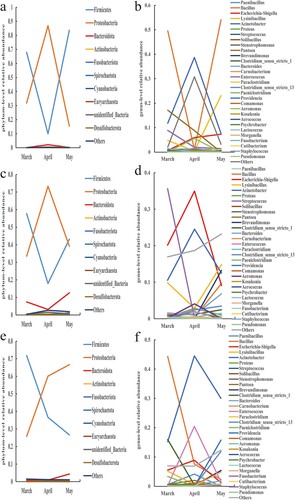
Figure 8. Trends of relative abundances of bacteria in air, feces, and body surface in the doe pen. (a) Air phylum, (b) Air genus, (c) Fecal phylum, (d) Fecal genus, (e) Body surface phylum, and (f) Body surface genus.
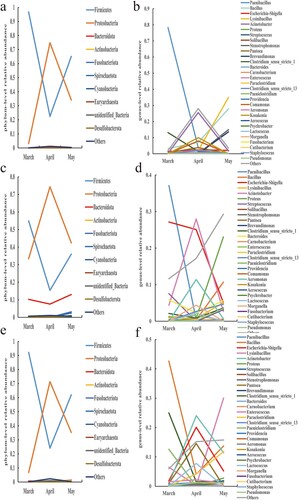
Figure 9. Trends of relative abundances of bacteria in air, feces, and body surface in the kid pen. (a) Air phylum, (b) Air genus, (c) Fecal phylum, (d) Fecal genus, (e) Body surface phylum, and (f) Body surface genus.
Correlations among bacterial flora in the air, feces and body surface
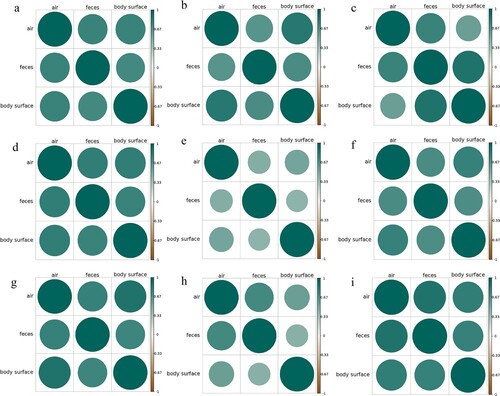
Body surface, fecal, and air samples were taken over a three-month period from adult buck, doe, and kid pens in order to identify relationships between microbiome species (). The study species’ association between the juvenile and lactation periods in April was poor, with all correlation values falling below 0.6. There is a significant and consistent correlation between the microbial populations in the air, feces, and skin, even in different types of pens (bucks, does, kids) and different months. The correlation coefficient is typically higher than 0.6 and occasionally even exceeds 0.8. In summary, during the three-month experimental period in spring, there is a generally strong positive correlation among the microbial communities in the air, feces, and on the body surface. They mutually influence each other and are interconnected.
Figure 10. Correlation analysis at the bacterial genus level between different samples in each pen from March to May. (a) Buck pen in March, (b) Buck pen in April, (c) Buck pen in May, (d) Doe pen in March, (e) Doe pen in April, (f) Doe pen in May, (g) Kid pen in March, (h) Kid pen in April, and (i) Kid pen in May.
Correlation between environmental factors and relative abundance of bacteria
As expected, air temperature increased (P < 0.01) progressively from March to May (). Relative humidity remained in the low to mid 70% in all three pens except in the low 60% in the buck and doe pens in May. From March to May, the light intensity of the three pens showed an upward trend, and the light intensity of the doe pen in May was higher (P = 0.076) than that in the previous two months. Little wind speed was observed in all three pens in all three months.
Table 1. Temperature, relative humidity, light intensity and wind speed in various pens from March to May.
Although the dominant bacterial genera in the three pens have slight differences over these three months, environmental factors have similar impacts on many bacteria. For example, temperature and relative humidity have opposite effects. However, wind speed does not have a significant impact on the growth of many bacterial genera.
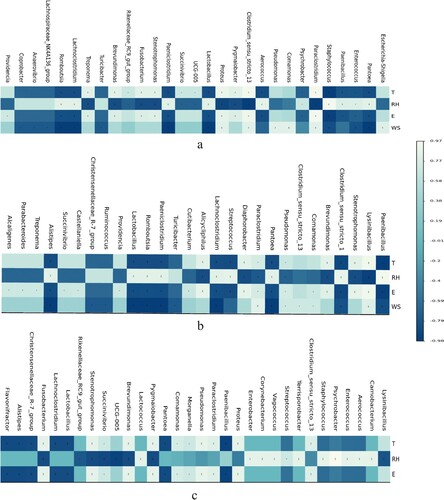
Conditionally pathogenic bacteria positively correlated with temperature include Proteus, Clostridium_sensu_stricto_13, and Lysinibacillus; conditionally pathogenic bacteria positively correlated with relative humidity include Enterococcus, Pantoea, and Aerococcus; conditionally pathogenic bacteria positively correlated with light intensity include Lysinibacillus and Stenotrophomonas; bacterial genera positively correlated with wind speed include Lysinibacillus and Proteus ().
Figure 11. Spearman correlation analysis of bacterial genera with environmental factors in air samples from each pen during the spring period from March to May. (a) Buck pen, (b) Doe and (c) Kid pen. * P < 0.05; ** P < 0.01. T = temperature; RH = relative humidity; E = light intensity; WS = wind speed.
Discussion
As expected, microflora in the environment was complex after 55 phyla, 126 classes, and 832 genera were analyzed. Standing out were Proteobacteria and Firmicutes at the phylum level and Bacillus at the genus level. Numerous potential pathogenic bacteria such as Bacillus, Acinetobacter, Escherichia-Shigella, Enterococcus, and Bacteroides were found. It suggested that routine disinfection measures might be needed to minimized infections attributed to pathogenic bacteria.
The dominant bacteria in the intestinal tract of dairy goats were Firmicutes and Bacteroidetes (Wang et al. Citation2017; Wang et al. Citation2018). Our study indicated that the dominant bacterial phyla in the feces were Firmicutes and Proteobacteria, and the relative abundance of Bacteroidetes that was previously reported was less apparent in this study. Bacterial phyla dominated by Firmicutes and Proteobacteria in the feces in this experiment could be attributed to high-fibre diets as well as inflammation in the digestive tract. The study revealed seasonal variations in the gut microbiome and demonstrated links between nutrition, animal health, and other variables, as well as the relative abundance of the dominant bacterial phylum in blue sheep (Pseudois nayaur) (Liu et al. Citation2018; Zhu et al. Citation2020). The relative abundance of Firmicutes and Bacteroidetes in the gut of Altay sheep could be related to diet and growth rate. The relative abundance of Firmicutes, and the ratio of Firmicutes to Bacteroidetes increased with the growth and development of Altay sheep (Li et al. Citation2020). Firmicutes utilized vitamins to produce energy and nutrients (Ley et al. Citation2008), and the relative abundance of Firmicutes increased when the diet was high in fibre (Fernando et al. Citation2010). Bacteroidetes degraded carbohydrates and proteins and their relative abundance increases when more starch was added to the feed (Spence et al. Citation2006). The increase in Proteobacteria, the largest phylum, may be associated with inflammation (Moon et al. Citation2018). Acinetobacter, Escherichia-Shigella and other dominant pathogenic bacteria are known to cause gastrointestinal inflammation and diarrhea. The relative abundance of Escherichia-Shigella increased in the fecal microflora of piglets with epidemic diarrhea (Bin et al. Citation2018). Proteobacteria can be used to identify dysbiosis, and an increase in the relative abundance of these dominant pathogenic genera suggests diseases related to digestion and metabolism (Shin et al. Citation2015). The Proteobacteria is generally more abundant on the surface of dairy goats, but in this experiment, the increased proportion in the fecal samples may be influenced by air and the skin microbiota. Since the samples were collected from feces and not directly from the rectum, bacteria belonging to the Proteobacteria from the air or the skin might have attached to the surface of the feces as they circulated in the air, resulting in an increased proportion of Proteobacteria.
Opposite temporal changes observed in the dominance between Proteobacteria and Firmicutes could be attributed to their differences in biological characteristics. Firmicutes are mostly gram-positive bacteria with thicker cell walls and high peptidoglycan content (Proft and Baker Citation2009), while Proteobacteria are all gram-negative bacteria, and their outer membranes are mainly composed of lipopolysaccharides with extremely high species and genetic diversity (Putker et al. Citation2015). The biological characteristics of these two dominant bacterial phyla are different. It is possible that they have different growth trends under the influence of the same external environmental conditions. The changing trends of the dominant genera were generally consistent with the phyla to which they belonged. However, the temporal changes of pathogenic bacteria genera, such as Bacillus, Acinetobacter, and Escherichia-Shigella, were slightly different from the phyla to which they belong. This might be a reflection of the influence of environmental factors on their individual characteristics and the complexity of interactions among them.
The sources of indoor environmental microorganisms are diverse. Indoor animals, production activities, feces, and feed dust are the main sources of microorganisms in the environment, and they interact with each other (Islam et al. Citation2019). In a closed environment, there were correlations and interactions among microorganisms from different sources (Zhao et al. Citation2014). In this experiment, the bacterial diversity and abundance were most similar in the air and body surface, followed by those in the feces and air. It was apparent that the main sources of bacteria in the air were from the body surface and feces. A large number of bacteria attached to the animal body surface and feces were brought into the air with animal and air movements. When the feces could not be removed immediately, the fecal-derived bacteria were brought into the air then into body surface. The diversity of air, feces, and body surface microflora were relatively similar, which suggested that they were related to each other.
The comprehensive effect of various environmental factors affecting the bacterial community structure had been reported (Kowalski and Pastuszka Citation2018). Through Spearman correlation analysis, temperature, relative humidity, and light intensity could affect microflora diversity in the reported experiment. Temperature and relative humidity had more profound effects on opportunistic pathogens than wind speed and light intensity. Their effects on the growth and reproduction of genus such as paenibacillus, Stenotrophomonas, Bacteroides, Enterococcus, and pantoea are mutually antagonistic, which may be related to their own characteristics. In the daily feeding and management, the control of pathogenic microorganisms could be enhanced through temperature and relative humidity control.
Conclusion
The main environmental factors affecting the bacterial genera in the air of a dairy goat pen are temperature and relative humidity, which have opposite effects on the growth of the bacterial community. The composition of the airborne bacterial community is not only influenced by environmental factors but also by the bacterial composition in dairy goat feces and on their bodies within the same environment. These three factors are interconnected, and fecal and surface bacteria are important sources of the airborne bacterial community.
Availability of data and materials
The datasets analysed during the current study are available from the corresponding author on reasonable request.
Authors’ contributions
Conceptualization: L. F. and H.S.; methodology: J.S.; investigation: L.F., J.S., and H.S.; data curation: X.L. and H.L.; statistical analysis: L.F. and H.L.; writing-original draft preparation: L.F., J.S.; writing-review & editing: X.L., Y.S., Christopher D. Lu and H.S.; funding acquisition: H.S.
Disclosure statement
No potential conflict of interest was reported by the author(s).
Additional information
Funding
References
- Aarnaes SL, Peterson EM, De La Maza LM. 1984. The effect of media and temperature on the storage of chlamydia trachomatis. Am J Clin Pathol. 81(2):237–239. doi:10.1093/ajcp/81.2.237.
- Adjassin JS, Assani AS, Bani AA, Sanni Worogo HS, Adégbeïga Alabi CD, Comlan Assogba BG, Virgile Azando EB, Alkoiret IT. 2022. Impact of heat stress on reproductive performances in dairy goats under tropical sub-humid environment. Heliyon. 8(2):e08971. doi:10.1016/j.heliyon.2022.e08971.
- Amit K, Verma A, Gangwar N, Anu R. 2012. Isolation, characterization and antibiogram of mycoplasma bovis in sheep pneumonia. Asian J Anim Veterinary Adv. 7(2):149–157. doi:10.3923/ajava.2012.149.157.
- Arsoy D. 2020. Herd management and welfare assessment of dairy goat farms in northern Cyprus by using breeding, health, reproduction, and biosecurity indicators. Trop Anim Health Prod. 52(1):71–78. doi:10.1007/s11250-019-01990-3.
- Bay L, Barnes CJ, Fritz BG, Thorsen J, Restrup MEM, Rasmussen L, Sørensen JK, Hesselvig AB, Odgaard A, Hansen AJ, et al. 2020. Universal Dermal Microbiome in Human Skin. mBio. 11(1). doi:10.1128/mBio.02945-19.
- Bernardo-Cravo AP, Schmeller DS, Chatzinotas A, Vredenburg VT, Loyau A. 2020. Environmental factors and host microbiomes shape host–pathogen dynamics. Trends Parasitol. 36(7):616–633. doi:10.1016/j.pt.2020.04.010.
- Bin P, Tang Z, Liu S, Chen S, Xia Y, Liu J, Wu H, Zhu G. 2018. Intestinal microbiota mediates enterotoxigenic escherichia coli-induced diarrhea in piglets. BMC Vet Res. 14(1):1–13. doi:10.1186/s12917-018-1704-9.
- Canha N, Almeida SM, Freitas M, Wolterbeek HT. 2015. Assessment of bioaerosols in urban and rural primary schools using passive and active sampling methodologies. Arch Environ Prot. 41(4):11–22. doi:10.1515/aep-2015-0034.
- Coffey B. 2014. Coccidiosis: symptoms, prevention and treatment in sheep, goats and calves. NCAT Agriculture Specialist.
- Cordeiro RA, Brilhante RS, Pantoja LD, Moreira Filho RE, Vieira P, Rocha MF, Monteiro AJ, Sidrim JJ. 2010. Isolation of pathogenic yeasts in the air from hospital environments in the city of Fortaleza, northeast Brazil. Braz J Infectious Diseases. 14:30–34. doi:10.1016/S1413-8670(10)70007-6.
- de Souza PT, Salles MGF, da Costa ANL, Carneiro HAV, de Souza LP, Rondina D, de Araújo AA. 2014. Physiological and production response of dairy goats bred in a tropical climate. Int J Biometeorol. 58(7):1559–1567. doi:10.1007/s00484-013-0760-x.
- Desselberger U. 2018. The mammalian intestinal microbiome: composition, interaction with the immune system, significance for vaccine efficacy, and potential for disease therapy. Pathogens. 7(3):57. doi:10.3390/pathogens7030057.
- Dréno B, Araviiskaia E, Berardesca E, Gontijo G, Sanchez Viera M, Xiang LF, Martin R, Bieber T. 2016. Microbiome in healthy skin, update for dermatologists. J Eur Acad Dermatol Venereol. 30(12):2038–2047. doi:10.1111/jdv.2016.30.issue-12.
- Ershaduzzaman M, Rahman MM, Roy BK, Chowdhury SA. 2007. Studies on the diseases and mortality pattern of goats under farm conditions and some factors affecting mortality and survival rates in Black Bengal kids. Bangladesh J Veterinary Med. 5(1 & 2):71–76.
- Fernando SC, Purvis H, Najar F, Sukharnikov L, Krehbiel C, Nagaraja T, Roe B, Desilva U. 2010. Rumen microbial population dynamics during adaptation to a high-grain diet. Appl Environ Microbiol. 76(22):7482–7490. doi:10.1128/AEM.00388-10.
- Ganter M. 2015. Zoonotic risks from small ruminants. Vet Microbiol. 181(1-2):53–65. doi:10.1016/j.vetmic.2015.07.015.
- Haas D, Galler H, Fritz C, Hasler C, Habib J, Reinthaler FF. 2017. Comparative study of impaction and sedimentation in an aerosol chamber using defined fungal spore and bacterial concentrations. PloS one. 12(12):e0187039. doi:10.1371/journal.pone.0187039.
- Hsu DK, Fung MA, Chen H-L. 2020. Role of skin and gut microbiota in the pathogenesis of psoriasis, an inflammatory skin disease. Med Microecology. 4:100016. doi:10.1016/j.medmic.2020.100016.
- Islam MA, Ikeguchi A, Naide T. 2019. Concentrations of aerosol numbers and airborne bacteria, and temperature and relative humidity, and their interrelationships in a Tie-stall dairy barn. Animals (Basel). 9(12):1023. doi:10.3390/ani9121023.
- Kowalski M, Pastuszka JS. 2018. Effect of ambient air temperature and solar radiation on changes in bacterial and fungal aerosols concentration in the urban environment. Ann Agric Environ Med. 25(2):259–261. doi:10.26444/aaem/75877.
- Ley RE, Hamady M, Lozupone C, Turnbaugh PJ, Ramey RR, Bircher JS, Schlegel ML, Tucker TA, Schrenzel MD, Knight R. 2008. Evolution of mammals and their gut microbes. Science. 320(5883):1647–1651. doi:10.1126/science.1155725.
- Li Y, Zhu Y, Wei H, Chen Y, Shang H. 2020. Study on the diversity and function of gut microbiota in pigs following long-term antibiotic and antibiotic-free breeding. Curr Microbiol. 77(12):4114–4128. doi:10.1007/s00284-020-02240-8.
- Liu F, Xie Y, Zajac AM, Hu Y, Aroian RV, Urban JF, Li RW. 2020. Gut microbial signatures associated with moxidectin treatment efficacy of Haemonchus contortus in infected goats. Vet Microbiol. 242:108607. doi:10.1016/j.vetmic.2020.108607.
- Liu Z, Zhu Z, Gao H, Zhao C, Sun Y, Teng L. 2018. Comparative analysis of winter diets and habitat use by the sympatric blue sheep (Pseudois nayaur) and Alashan red deer (Cervus alashanicus) in the helan mountains, China. J Vertebrate Biol. 67(1):43–53. doi:10.25225/fozo.v67.i2.a6.2018.
- Luo T, Li Y, Zhang W, Liu J, Shi H. 2022. Rumen and fecal microbiota profiles associated with immunity of young and adult goats. Front Immunol. 13:978402. doi:10.3389/fimmu.2022.978402.
- Memish ZA, Balkhy HH. 2004. Brucellosis and international travel. J Travel Med. 11(1):49–55. doi:10.2310/7060.2004.13551.
- Moon CD, Young W, Maclean PH, Cookson AL, Bermingham EN. 2018. Metagenomic insights into the roles of proteobacteria in the gastrointestinal microbiomes of healthy dogs and cats. MicrobiologyOpen. 7(5):e00677. doi:10.1002/mbo3.677.
- Proft T, Baker EN. 2009. Pili in gram-negative and gram-positive bacteria - structure, assembly and their role in disease. Cell Mol Life Sci. 66(4):613–635. doi:10.1007/s00018-008-8477-4.
- Putker F, Bos MP, Tommassen J. 2015. Transport of lipopolysaccharide to the gram-negative bacterial cell surface. FEMS Microbiol Rev. 39(6):985–1002. doi:10.1093/femsre/fuv026.
- Rodrigues Hoffmann A, Patterson AP, Diesel A, Lawhon SD, Ly HJ, Stephenson CE, Mansell J, Steiner JM, Dowd SE, Olivry T, et al. 2014. The skin microbiome in healthy and allergic dogs. PLoS ONE. 9(1):e83197. doi:10.1371/journal.pone.0083197.
- Shin NR, Whon TW, Bae JW. 2015. Proteobacteria: microbial signature of dysbiosis in gut microbiota. Trends Biotechnol. 33(9):496–503. doi:10.1016/j.tibtech.2015.06.011.
- Sonawane G, Singh F, Tripathi B, Dixit S, Kumar J, Khan A. 2012. Investigation of an outbreak in lambs associated with Escherichia coli O95 septicaemia.
- Spence C, Wells WG, Smith CJ. 2006. Characterization of the primary starch utilization operon in the obligate anaerobe bacteroides fragilis: regulation by carbon source and oxygen. J Bacteriol. 188(13):4663. doi:10.1128/JB.00125-06.
- Wang J, Fan H, Han Y, Zhao J, Zhou Z. 2017. Characterization of the microbial communities along the gastrointestinal tract of sheep by 454 pyrosequencing analysis. Asian-Australas J Anim Sci. 30(1):100–110. doi:10.5713/ajas.16.0166.
- Wang Y, Zhang H, Zhu L, Xu Y, Liu N, Sun X, Hu L, Huang H, Wei K, Zhu R. 2018. Dynamic distribution of gut microbiota in goats at different ages and health states. Front Microbiol. 9:2509. doi:10.3389/fmicb.2018.02509.
- Yesuf M, Mazengia H, Chanie M. 2012. Histopathological and bacteriological examination of pneumonic lungs of small ruminants slaughtered at Gondar, Ethiopia. Am J Sci Res. 7(6):226–231. doi:10.5829/idosi.aejsr.2012.7.6.66140.
- Zhao Y, Aarnink AJA, De Jong MCM, Groot Koerkamp PWG. 2014. Airborne microorganisms from livestock production systems and their relation to dust. Crit Rev Environ Sci Technol. 44(10):1071–1128. doi:10.1080/10643389.2012.746064.
- Zhu Z, Sun Y, Zhu F, Liu Z, Pan R, Teng L, Guo S. 2020. Seasonal variation and sexual dimorphism of the microbiota in wild blue sheep (Pseudois nayaur). Front Microbiol. 11:1260. doi:10.3389/fmicb.2020.01260.