
 ?Mathematical formulae have been encoded as MathML and are displayed in this HTML version using MathJax in order to improve their display. Uncheck the box to turn MathJax off. This feature requires Javascript. Click on a formula to zoom.
ABSTRACT
The visual morphologies in animals are associated positively or negatively with production, adaptation, and behavioral characteristics. For rural farmers with limited records, these features are considered reliable phenotypic markers. Thus, this study was intended to explore the unique morphological features of indigenous chickens as a farmer's selection guide. A total of 1,060 adult chickens from four rural districts were investigated for nine morphological traits. The single-comb type, supposed to be of good fertility, was the most prevalent. Yellow and white shanks were predominant, followed by gray, greenish-yellow, green, and black pigmentations. Crested and silky chickens were more frequent in highland areas, whereas naked-neck chickens were observed in lowlands. Chickens of the lowlands have brighter, more uniform plumage colors and yellow shank, beak, and earlobe colors. On the other hand, the highland and mid-altitude chickens are characterized by dark, colorful combinations of various feather colors: laced plumage, white shank, rose, and deformed rose combs. Moreover, multiple correspondence analyses revealed that morphological features have special associations with districts. Thus, the observed morphological heterogeneity of the indigenous chickens can be used as a good indicator of selective breeding. Therefore, the associations of these characteristics with productivity qualities could be confirmed by quantitative and molecular tools.
Introduction
The selection process for adaptive merits, producers and consumers preferred traits, and diversified production habitats has shaped the genetic makeup and morphology of today’s chicken populations (Wragg et al. Citation2012; Lawal and Hanotte Citation2021). Moreover, indigenous chickens, predominantly kept by rural communities in Africa and Asia, have large physical variations in body conformation, plumage color, comb type, and other morphological characteristics that can have potential for conservation and genetic improvement (Hassaballah et al. Citation2014; Negassa et al. Citation2014; Liyanage et al. Citation2015; Habimana et al. Citation2021; Maharani et al. Citation2021; Winaya et al. Citation2023).
These morphological features have a variety of potential associations with the production, health, physiological, and behavioral characteristics of birds under varied production conditions. For instance, comb shape and size are associated with sexual maturity (Mukhtar and Khan Citation2012), male social rank, mate choice, heat regulation, egg production, fecundity, bone mass (Pizzari and Snook Citation2003; Cornwallis and Birkhead Citation2007), and shank length (Johnsson et al. Citation2012). Hens with larger combs have greater bone density and lay more eggs. Males with the smallest, reddest combs had the highest percentage of viable sperm (Navara et al. Citation2012). Rose-comb has pleiotropic effects in homozygous cocks, which is associated with poor sperm mobility (Wang et al. Citation2017). Moreover, the presence of a single-comb helps to reduce body heat by 40%, which is advantageous in tropical conditions (Duguma Citation2006). A vibrant red comb indicates the bird is healthy and sexually mature. Likewise, calcium mobilizes into the eggshell more easily when hens have larger combs (Johnsson et al. Citation2012). Genetically, the alleles that increase comb width also shorten duration at the onset of sexual maturity (Wright et al. Citation2012), and the comb in female broiler breeders begins to grow larger as the pullets’ approach sexual maturity before laying.
Similarly, plumage color has been associated with a variety of adaptive functions, including temperature regulation, camouflage, and mate choice (Hill Citation1991; Hamilton et al. Citation2013). Bright feather coloration has been linked with better fertility and indicates semen characteristics that influence fertility (Mehlis et al. Citation2013). It has also been suggested that naked-neck chickens have greater body weight in the hot season due to genes that cause a reduction in the number of feathers in their neck region. This could result in increased growth and productivity (Rajkumar et al. Citation2010; Sharifi et al. Citation2010). However, naked-neck cocks have complained of lower packed sperm volume, lower sperm motility, higher abnormal sperm counts, and higher coiled tail defects. On the other hand, the weights of the egg, yolk, albumen, and eggshell were significantly greater in the non-feathered shank hens compared to the shank-feathered hens (Shaker and Aziz Citation2017).
Ricardo et al. (Citation2016) reported that yellow skin color is associated with an individual’s adaptive fitness, reflecting its nutritional status (carotenoid pigments in the skins of birds) or health conditions, which are indicative of foraging efficiency and immune status (Eriksson et al. Citation2008). Likewise, earlobe color variations are associated with adaptability to local conditions (Cabarles et al. Citation2012). The development of a larger and more voluminous feather crest has been linked to cerebral hernia (Yoshimura et al. Citation2012); however, Li et al. (Citation2021) disproved this association by demonstrating that a 197-bp duplication (mutation) of the HOXC10 gene on chromosome 33 is necessary for the development of a large crest and susceptibility to cerebral hernia. In addition, to satisfy their cultural and religious requirements, smallholder farmers under traditional production conditions select chickens primarily based on visual appearances (Dana et al. Citation2010; Melesse and Negesse Citation2011). Thus, understanding the visual characteristics of chickens is important for proper flock management and to run a reasonable selection, particularly under farmer conditions where records are hardly available.
Moreover, in Ethiopia, several studies have been conducted on breeding practices and trait preferences for indigenous chickens, in which farmers give much priority to observable morphologies (Dana et al. Citation2010; Chebo and Nigussie Citation2016; Terfa et al. Citation2019; Kassa et al. Citation2020; Markos et al. Citation2020; Fekede and Tadesse Citation2021). Morphological and genetic variations and unique adaptation features of the Ethiopian indigenous chicken populations have been studied by several scholars (Dana et al. Citation2010; Melesse and Negesse Citation2011; Taye et al. Citation2013; Moreda et al. Citation2014; Negassa et al. Citation2014; Assefa and Melesse Citation2018; Kebede Citation2018; Tadele et al. Citation2018; and others). However, these studies did not exhaustibly explore all existing chicken genetic resources in Ethiopia in general and in the study areas in particular. Thus, this study was aimed at investigating and describing the unique morphological features of indigenous chickens reared in rural communities as selection criteria practiced by farmers.
Materials and methods
Description of the study areas
The study was conducted in the newly formed state of Ethiopia, the Sidama region, located in southern Ethiopia. Four rural districts (Shebedino (mid-altitude), Boricha (lowland), Aleta Chuko (mid-altitude), and Hula (highland)), which have potential for indigenous chicken populations and diversity, were purposefully selected. The first, Shebedino District, is partly rooted in the Great Rift Valley. It is located at 6°44’ to 6° 84’ N and 37° 92’ to 38° 60’ E with an altitude range of 1001–2500 meters above sea and represents midland. The annual range of rainfall varies from 800 mm to 1600 mm, with a mean average rainfall of 1170 mm. The maximum and minimum annual temperatures are 16°C and 25°C, respectively. Boricha district is the second district selected for this study, which is situated at 6°46'N to 7°01'N longitude and 38°04'E to 38°24'E latitude. It has mainly two agro-ecological zones: the mid-altitude, with elevations ranging from 1500–2000 meters above sea level, and the dry lowland, which is less than 1500 meters above sea level and accounts for 78% of the total land coverage. The district receives a low rainfall distribution, and most months remain dry. The third district is Aleta Chuko district, whose geographical location extends from 6046’N to 7001’N and 38004’E to 38024’E. It has an altitude of 1400–2300 meters above sea level and an average annual rainfall of about 1200–1400 mm. The district mainly represents midland agro-ecology. The mean annual temperature of the district ranges from 18°C to 28°C. The area is mainly characterized by mid-altitude agro-ecological zones. The fourth district is Hula district, which is situated at an altitude ranging from 2650 to 2850 meters above sea level and is typically characterized by highland agro-ecology. The total indigenous chicken populations of the selected districts were: Aleta Chuko has 158,420 chickens; Shebedino district has 156,625; Boricha district has 66,874; and Hula district has 59,830 chickens, as obtained from the Sidama Region Livestock and Fishery Resource Development Bureau (2023) (unpublished).
Data collection and statistical analysis
A total of 1,060 adult (≥ one year) indigenous chickens (854 females and 206 males) were observed for qualitative features. Feather morphology (feather distribution and patterns, plumage color), shank color and presence/absence of shank feather, beak color, earlobe color, comb and head types were recorded by observation following the FAO’s checklist for phenotypic characterization of indigenous chickens’ genetic resources (FAO Citation2012). The total number of studied chickens was taken following the Yamane (Citation1967) formula.
where, n = sample size, N = total number of chickens in each district.
e = level of precision (7%).
Households with more than four adult indigenous chickens were selected; however, 2–3 chickens were observed for morphological recording. PROC FREQ was run to generate descriptive statistics, cross-tabulation, and frequency values. A chi-square test was performed to evaluate the effect of districts and sex on the qualitative morphological features. Multiple correspondence analysis using PROC CORRESP was also employed to check the variability and distributions of qualitative phenotypes of chickens across districts. Statistical analysis was run by SAS Version 9.4 (Citation2012).
Results
Comb types
Two predominant comb types were noticed: single and rose combs. The third, deformed rose, which has various shapes and sizes, was also recorded (). Across all the districts, single-comb types are more frequently observed, followed by rose and deformed-rose types (). On the other hand, males have single-comb types in a larger proportion, whereas females have rose and single-combs. The observed comb types of the studied chickens were significantly varied across districts (p < 0.0001).
Figure 1. Single, rose and deformed-rose comb type as presented from left to right.
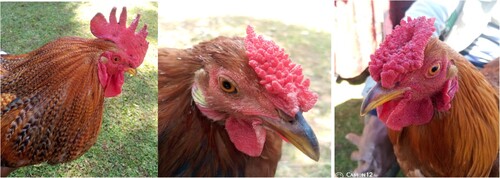
Table 1. Comb type, shank color and shank feather variations across districts.
Shank color and shank feather
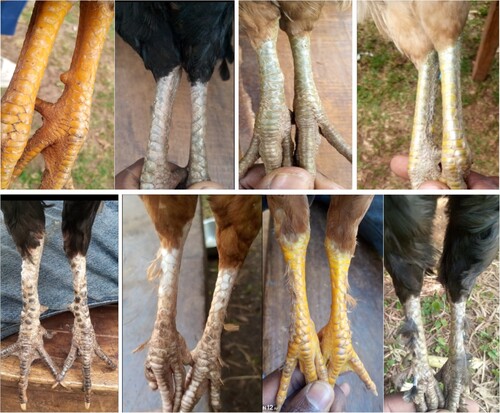
The observed shank color and shank feather morphology of the chicken populations are presented in and . Accordingly, yellow and white shank colors are the major phenotypes observed across all districts, followed by gray, greenish-yellow, green, black spotted white, and black shank pigmentations. Most males have yellow-colored shanks, while females have more diversified shank color types. There is no significant (p = 0.35) variations observed among districts for both shank color types and the presence or absence of shank feathers. Moreover, about 97.7–100% of chickens were observed with no shank feathers across districts (). Shank feathers were observed regardless of shank color or any phenotype of chicken ().
Figure 2. Shank color variants: Yellow, Gray, Green, Greenish-yellow, Blackspotted – white, White feathered, Yellow feathered, Gray feathered as presented order from top-left to bottom right.
Beak color variations
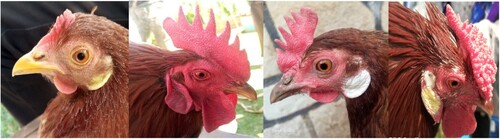
In the studied chickens, brownish-yellow, yellow, and brown beak color variants were the most commonly observed, followed by black and white beak colors across districts (, ). Male chickens have predominantly black and brownish-yellow beaks, whereas females have brownish-yellow, yellow, and brown beaks, which were the most observed types. Chickens with a brighter plumage color frequently have yellow or white beak and shank colors. On the other hand, darker plumage-colored (black, gray, or a combination of their various forms) birds have mostly black beaks and black or gray shanks. Beak color variants showed highly significant variation across districts (p < 0.0001).
Figure 3. Beak color variants: black, yellow, brown and brownish-yellow from left to right.
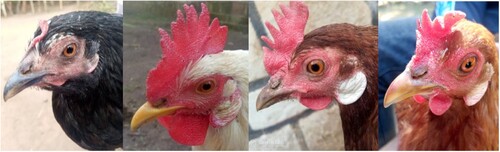
Table 2. Beak and ear-lobe color variations across districts.
Ear lobe color variations
As presented in , white, white-spotted-red, and red earlobe color phenotypes were dominantly observed, followed by creamish, yellow-spotted-red, and yellow earlobes across the study districts. In males, the red earlobe phenotype and, in females, the white earlobe phenotype were most frequently observed (, ). A highly significant (p < 0.0001) variation was observed between study districts for earlobe colors.
Figure 4. Ear lobe variants: yellow, red, white and, yellow-spotted-red as displayed from left to right.
Plumage color variations
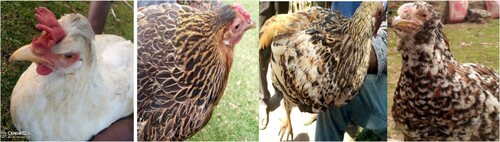
Red-brownish, red, and light-brown were more frequent, followed by several other plumage color phenotypes that were observed and significantly (p < 0.0001) varied across districts, as presented in . Highly diversified plumage colors were commonly observed for female birds; males have relatively more uniform feather colors across districts. Across all districts, plumage color was the most diversified phenotype of all observed features, but no unique color was noticed in any of the districts. In line with the current study and review of literature, chickens with similar plumage colors were observed from different regions, as presented in , and . In (this study), plumage color variants of indigenous chickens in the Sidama region (at highland, mid-altitude, and lowland areas) were displayed. In , the plumage colors of indigenous chickens kept by different communities in Eastern Amhara (Getu et al. Citation2014) were presented. In , the plumage colors of indigenous chickens from the Sheka zone in Southwestern Ethiopia were displayed (Assefa and Melesse Citation2018). The detailed information on the chicken populations is described in the .
Figure 5. Plumage color variants of indigenous chicken of the current study (Sidama region). chickens were sampled from four districts (Hula, Shebedino, Aleta Chuko, and Boricha) of the Sidama region, southern Ethiopia. These locations are characterized by three agro-ecologies and altitude ranges from 1100 to 2850 m above sea level, annual average temperatures ranging from 16 to 28 °C, an annual rainfall of 1170 to 1400 mm, and a much more diversified natural vegetation.
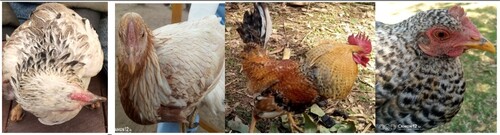
Figure 6. Plumage color of indigenous chickens of Eastern Amhara, Ethiopia (Getu et al. Citation2014). These chickens were studied from three districts (Ziqualla from Sekota zone, Teneta and Jamma from South Wollo Zone) of Eastern Amhara region. The altitude of the districts ranges from 500 to 3500 meter above sea level with annual rainfall of 500 to 1700 mm and temperature ranging from 15 to 40 °C. In the study, chickens were studied from dryland to highland elevations with huge diversity of natural habitats and various climatic conditions.
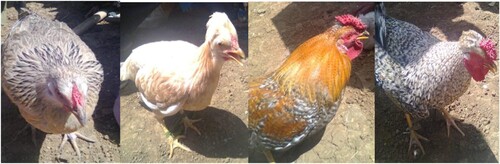
Figure 7. Plumage color of indigenous chickens of Southwestern Ethiopia (Assefa and Melesse Citation2018). Chickens of the study were sampled from three districts of the Sheka Zone (Masha, Yeki, and Andracha) of Southwestern Ethiopia. These locations are characterized by evergreen vegetation cover, elevations ranging from 1001 to 3400 m above sea level, a mean annual temperature range of 15.1–27.5 °C, and a mean annual rainfall range of 117–2200 mm. Furthermore, the mentioned districts across regions are much apart from one another; for instance, the Hula district of the Sidama region is at the Southern tip, and the Sekota district of Eastern Amhara is at the Northern tip, about 1250 km away. Thus, the observed similarity between chickens for morphometric and physical features (plumage color morphology) could be explored in depth.
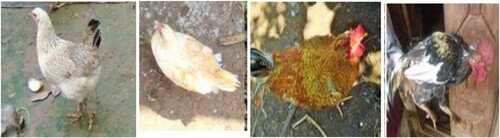
Table 3. Plumage color variations of male and female chicken populations.
Plumage morphology
Normal plumage morphology was predominant over silky type across all study districts (). The majority of female chickens have normal plumage morphology, while males have a mostly silky type. Silky-feather chickens were more abundant in Hula and Boricha districts. There were no frizzled chickens observed in the current study. Significantly different variation was observed between study districts (p = 0.006) for plumage color phenotypes.
Table 4. Plumage variations across districts.
Feather distribution
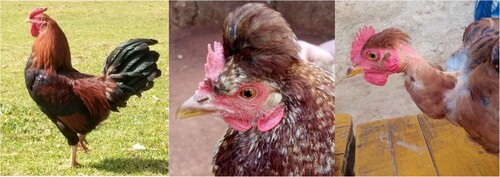
Normal feather was more prevalent than naked-neck and crest chickens across districts and between sexes ( and ). There is no significant (p = 0.109) variation across districts for feather distribution. Next to normal feather distribution, crested chickens were more frequently seen in Hula and Boricha districts. Female chickens commonly possess normal feather distribution, followed by the crest, and very few heterozygotes are naked-neck hens. Male crested chickens were rarely observed in all districts. As observed during field inventory and on-farm monitoring, all crested hens were much more alert and aggressive than other chickens in the flock.
Figure 8. Feather distribution phenotypes: Normal feathered, Crested and heterozygote naked-neck chickens as displayed from left to right.
Feather pattern
Feather patterns in chickens are the unique and distinct markings on the feathers made up of lacing, trims, lines, bars, or spots. In the current study, four plumage patterns were identified: plain, laced, mottled, and barred variants (, ). In all districts, plain and laced phenotypes were the most predominant. Red was the dominant plain color of chickens, followed by white and black feather colors. Males have a predominantly red plain plumage pattern; however, most females have laced plumage patterns. Laced phenotypes were observed on various plumage colors and marked on either both breasts and backs or at one part of the chicken. Significantly (p < 0.001) different variations were observed between districts for plumage color pattern phenotype in the study chickens.
Figure 9. Feather patterns: Plain, Laced, Mottled and Barred variants as displayed from Left to right.
Multiple correspondence component analysis
Multiple correspondence analysis is used to locate all the categories of a particular variable in a Euclidean space. Usually, the first two dimensions of this space are plotted to examine the associations among the categories. Variables placed at a far distance from the origin are more likely to group populations into respective groups. In the current study, since different morphological features have the same category names (e.g. white phenotype can be used for plumage color, shank color, earlobe color, or beak color), analyses were run separately, and four graphical plots were obtained as displayed in , , and .
Figure 10. Multiple correspondence analysis of the feather morphology, plumage color, plumage pattern, comb type & earlobe color phenotypes. Districts (Hula, Shebedino, Aleta Chuko & Boricha), feather morphology (Normal feather & Silky), Plumage pattern (Plain, Laced, Mottled & barred), comb type (single, rose & deformed rose), earlobe color (creamish, red, white, yellow, white spotted-red, yellow spotted-red) and feather distribution (normal, naked-neck & crested).
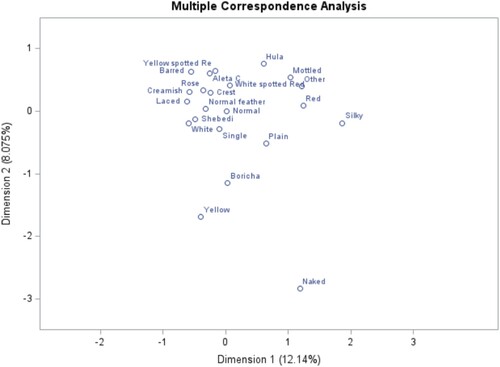
Figure 11. Multiple correspondence analysis of Plumage color features and districts.
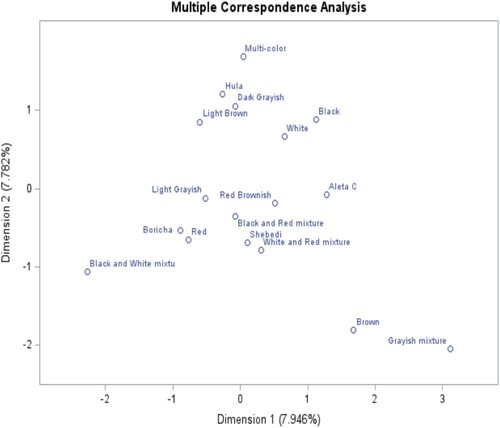
Figure 12. Multiple correspondence analysis of shank color phenotypes and districts.
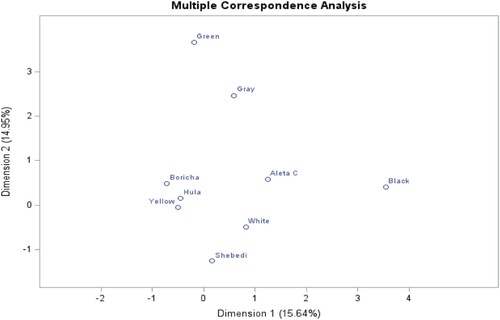
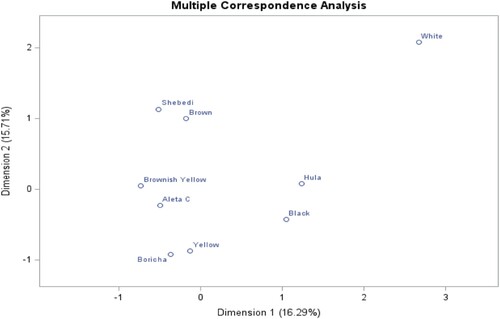
Figure 13. Multiple correspondence analysis of beak color phenotypes and districts.
In , feather morphology, plumage pattern, feather distribution, comb type, and earlobe color characters were analyzed, and the two dimensions (Dim1 and Dim2) explained 12.14% and 8.07% of the total variation, respectively. In the top-left quadrant, features like rose comb, creamish earlobe, yellow-spotted-red earlobe, crest feather distribution, and laced plumage pattern were more associated with and characterized in the chickens of Aleta Chuko district. In the top-right quadrant mottled plumage pattern, deformed-rose comb, white-spotted-red earlobe, and red earlobe were associated and grouped with Hula district, whereas Boricha district is associated with naked-neck, yellow earlobe, plain plumage pattern, and silky plumage morphology. Moreover, Shebedino district was characterized by chickens with white earlobes, single-combs, normal feather distribution and pattern.
Similarly, in , plumage color features were displayed along with the districts. As a result, the first two dimensions, Dim 1 and Dim 2, described the plumage color variations by about 7.94% and 7.78%, respectively. Moreover, multi-color, dark grayish, light-brown, black, and white plumage color phenotypes are strongly associated with and closest to the Hula district. This implies that the indigenous chicken populations of Hula district are characterized by these plumage color types in combination with other phenotypes displayed in other graphic plots. Shebedino district was associated with white and red mixed colors, grayish mixtures, brown, black, and red mixture colors, and so on.
In the plot, , the shank color of chicken and districts were presented in two dimensions, each contributing 15.64% and 14.95%, respectively, to the total variation. Green, gray, and black features are associated with and close to Aleta Chuko, which has shown the higher explanatory power of shank color variation among the studied chickens. Shebedino district is associated with white shank color; Hula and Boricha are closely associated with yellow shank color.
Moreover, in , dimensions 1 and 2 explain the total variation of the beak color of chickens across districts by 16.29% and 15.71%, respectively. Boricha district is more associated with yellow beak color; Hula is associated with black; Aleta Chuko is closely associated with brownish-yellow; and Shebedino district is associated with brown and white beak color.
Discussion
Comb type shows considerable variability among domestic chickens (Shen et al. Citation2016). The higher proportion of single-comb cocks over rose and deformed-rose cocks has the advantage of increasing fertility in chicken flocks. This argument has been supported by a report by McLean and Froman (Citation1996), who found that single-comb breeds have a higher fertility rate than rose-comb breeds. Moreover, rose-comb has pleiotropic effects, as dominant homozygosity in males has been associated with poor sperm motility (Parker Citation2003). The observed higher proportion of single-comb chickens could be considered a positive impact on flock fertility since single-combed chickens are believed to be more fertile than rose-combed ones. Moreover, the low proportion of rose-combed chickens observed in this study has a positive effect on the fertility of chickens under open breeding conditions. Thus, knowing the proportion of the predominant comb type is good information to select cocks and hens against unfavorable phenotypes. However, during field inventory, most farmers prefer to keep rose-combed chickens, which are assumed to be less fertile than single-combed chickens. As farmers revealed, rose-combed chickens, especially cocks, fetch better money and are highly demanding for cultural values than singe-combed chickens.
Moreover, the observed deformed-rose comb type in this study was most probably formed because of the recombination effect as a result of uncontrolled crossing of chickens between single and rose comb types. This phenotype has varied deformed forms of ridge at the back and is clearly different from the other possible types of chickens’ comb (walnut, V-shape, strawberry, cushion, and duplex) reported by several studies. The single-comb phenotype was frequently observed in males, whereas females have exhibited higher proportions of rose and deformed rose combs across districts. Similarly, Tadele et al. (Citation2018) reported that single, rose, and deformed-rose comb types were observed in indigenous chickens of south-western Ethiopia. The other rare and breed-specific comb types (walnut, V-shape, strawberry, cushion, and duplex) that have been reported by several authors in Ethiopia were not observed in this study. Likewise, a higher proportion of single-combed chickens were observed in “Bangkok’ native chickens (Winaya et al. Citation2023), native chickens in Indonesia (Maharani et al. Citation2021), zoar chickens native to Mizoram, India (Lalhlimpuia et al. Citation2021), native chickens of Chhajjian, Pakistan (Bibi et al. Citation2021), and black-bone chickens native to Thailand (Buranawit et al. Citation2016).
The probable reason for the presence and absence of several comb types and forms were genetic effects, and random mating occurs in villages that favor the expression of existing comb types. As a remark and revealed in other studies, the association of single and rose comb types with fertility and production parameters can be taken as relevant information for selections made by farmers.
The observed diversified shank colors in this study are in accordance with the genetic effect of shank pigmentation in domestic chickens, as stated by Knox (Citation1935). Knox has stated that the shank color of domestic chickens varies from black to blue, green, yellow, or white, which is determined by loci inhibitor of dermal melanin, extended black, yellow legs, and other regulatory genes, including sex-linked barring, dominant white, and the recessive allele at the sex-linked yellow skin locus, which affect the presence or absence of melanin and xanthophylls in the dermis and epidermis. This implies that; besides the genetic effect, nutrition has greatly influenced shank coloration in chickens. A xanthophyll-rich diet and free-scavenging on natural vegetation have resulted in high frequencies of yellow shank colors observed in this study.
Furthermore, similar to this study, several studies have reported yellow and white shank as predominantly followed by other shank color phenotypes under free-scavenging indigenous chickens in Ethiopia (Melesse and Negesse Citation2011; Taye et al. Citation2013; Moreda Citation2015; Assefa and Melesse Citation2018). Correspondingly, yellow and white dominant shank color types were reported for indigenous chickens in Africa, as reported by Eganhi et al. (Citation2010) and Rotimi et al. (Citation2013) for indigenous chickens of Northcentral Nigeria; Gwaza et al. (Citation2018) reported for Tiv and Fulani indigenous chickens of Nigeria. Moreover, a study conducted on five ecotypes of indigenous chickens in Rwanda reported that yellow shank was the most common, followed by white, black, and grey shank colors (Habimana et al. Citation2021). In addition, similar to this study, white and yellow shanks were dominant in native chicken in Bangladesh (Sarker et al. Citation2014), in South-Western Ethiopia (Tadele et al. Citation2018; Bayou et al. Citation2022), in Eastern and Western Samar of the Philippines (Godinez et al. Citation2020), and in the transboundary area of Jammu and Kashmir in India (Singh et al. Citation2022). Moreover, Suyatno et al. (Citation2023) reported white and yellow shank colors were predominant over greenish grey and blackish grey pigmentations in four native chickens of East Java, Indonesia.
The probable cause of shank color variations in domestic chicken was a combination of specific genes that influence carotenoid and melanin pigmentations, polygenic modifiers, and environmental factors such as diets. Ricardo et al. (Citation2016) reported that yellow skin color is the result of the expression of carotenoid pigments in the skins of birds, and Eriksson et al. (Citation2008) and Lalhlimpuia et al. (Citation2021) also noted that shank color is associated with the individual’s adaptive fitness, reflecting its nutritional status or health conditions, which are indicative of its foraging efficiency and immune status.
Chickens with shanks feathered were less frequent. Shank feathers were observed regardless of shank color or any phenotype of chicken. In agreement with this, Taye et al. (Citation2013) reported that 97.9% of Horro and 97.8% of Jarso chicken ecotypes have no feathers on their shanks. Likewise, Moreda (Citation2015) reported that about 98.48% of chickens have no shank feathers in the Southwestern Showa and Gurage zones. In line with this study, Hassen (Citation2007) also reported that indigenous chickens with feathers present on their shanks (2.48%) were less frequent than those without feathers (97.52%) on their shanks. This can be justified as the inheritance of the shank feathering (ptilopody) trait is dominant over the non-feathering shank trait in chickens, which is based on two factors: pti-1L and pti-1B that are located on Chromosomes 13, 15, and 24 (Somes Citation1990; Moiseyeva et al. Citation2012). Shaker and Aziz (Citation2017) also reported significantly higher egg, yolk, albumen, and shell weights for non-feathered than feathered Kurdish chickens in Iraqi Kurdistan. Thus, it is advisable to use the most populated non-feathered chickens that were observed in this study to benefit from the higher egg weight and egg internal quality confirmed by these studies.
We have frequently observed that chickens with a brighter plumage color have yellow, brownish-yellow, and white beak colors. This association might be a genetic or diet effect, and due to social behavior between chickens, chickens with the same phenotype come together, and mating can occur more frequently between them. This has been justified by Dey et al. (Citation2015), who found that beak coloration can be used as a signal in mate selection and is also strongly associated with social grouping behaviors. Moreover, beak phenotypes are associated with ecological adaptation, as confirmed by Erik et al. (Citation2021). The beak color polymorphism in birds has been formed by a mutation associated with a regulatory change in the BCO2 gene (beta-carotene oxygenase 2) and maintained in a population by ecological selection associated with survival and diet. In this study, the predominant phenotype of black beak colors in males and varied beak colors in females might be sex dimorphism between chickens for the beak phenotype.
The beak color phenotypes of this study were similar to those of other related studies on indigenous chickens in Ethiopia. For instance, Taye et al. (Citation2013) reported that yellow, brownish-yellow, and black beak colors were the most frequently observed beak color phenotypes. Similarly, several authors (Getu et al. Citation2014; Moreda Citation2015; Assefa and Melesse Citation2018; Kebede Citation2018) reported that yellow and brown beak colors were the predominant phenotypes of indigenous chickens.
Yellow-colored earlobe chickens were more frequently observed in lowland flocks; however, white-colored earlobe chickens were dominant in highland and midland agro-ecologies. We also noticed that the dark plumage-colored chickens have most frequently white or red earlobes across all districts. Chickens with yellow shanks and beaks most frequently have red and white earlobe colors. Yellow and yellow-spotted-red earlobe phenotypes were more identified in Boricha, the lowland district. On the other hand, males commonly have red or white-spotted earlobes. These variations might be observed due to the genetics, sex effects, feeding habits, and ecological adaptations of indigenous chickens.
In another morphological study, Kebede (Citation2018) reported that red and white earlobe colors were predominantly observed. Assefa and Melesse (Citation2018) reported five earlobe colors – white, red, gray, black, and yellow – in indigenous chickens of southwestern Ethiopia. The red ear lobe color was the most abundant, followed by a mixture of white and red colors and white color in the indigenous chickens of central Nigeria (Habimana et al. Citation2021). Similarly, red earlobe color was observed to be predominant for native chickens in Chhajjian, Haripur, Pakistan (Bibi et al. Citation2021).
Plumage patterns are characterized by different colors occurring as a result of the separation of alleles from random mating between birds of variable color patterns (Liyanage et al. Citation2015). The plumage color diversity is also maintained as an indication of random mating and that many genes control the trait with respect to plumage colors (Aklilu et al. Citation2013). Similarly, in our observation, the plumage color of chickens was so diverse across districts and between sexes. We noticed that in unselected indigenous chickens, no other qualitative trait is as diverse as plumage color and distribution.
Moreover, as we generated from different literature evidence, the prevalence of similar plumage color phenotypes recorded across different regions (presented in , , and ) clearly indicates that there is little evidence that supports plumage color variations being location- or population-specific. Unless a targeted selection is conducted to maintain chickens with a specific plumage color under controlled breeding, it is not possible to definitely distinguish a particular non-descript population based on plumage color phenotype.
Other similar studies reported diverse plumage color phenotypes among indigenous chickens under natural breeding and free-ranging conditions in the tropics. For instance, Assefa and Melesse (Citation2018) reported 22 different plumage color types from three districts in Ethiopia; Kebede (Citation2018) reported 16 different plumage color types summarized from several research findings in Ethiopia; Habimana et al. (Citation2021) also reported eight plumage color types predominantly multi-color phenotypes from indigenous chickens of Rwanda reared by rural farmers; Moreda (Citation2015) reported eight plumage color phenotypes in indigenous chickens of Ethiopia; and Hassen (Citation2007) also reported eight plumage color types in indigenous chicken populations reared in different communities of Ethiopia. Melesse and Negesse (Citation2011) reported eight different plumage color variants of indigenous chickens reared in southern Ethiopia.
The most likely causes of the diverse plumage color of traditional chickens in rural communities are uncontrolled random mating practices, evolutionary changes in responding to changing environmental conditions, farmer preferences for colorful chickens, and the mating candidate preference behavior of birds toward colorful individuals. Furthermore, qualitative features such as plumage color are regulated by a small number of genetic loci and are highly heritable in the population as a result of uncontrolled mating in the villages.
Across study districts, there was no significant variation for feather distribution phenotypes, but there was variation between three observed phenotypes. Hetrozygote naked-neck chickens were observed very rarely (only seven naked-neck chickens out of 1,060 studied) in lowland districts. Similarly, Kebede (Citation2018) reported that normal feather distribution was predominant, followed by the crest and the naked-neck. Dana (Citation2011) also reported a higher proportion of normal feather distribution than naked-neck phenotypes in indigenous chickens in Ethiopia. Phenotypically, in heterozygote states, the naked-neck phenotype can be identified by a small tuft of feathers on the ventral side of the neck above the crop, which is almost absent in the homozygote (Fathi Citation1987). In the homozygous state, there is a 40% reduction in feather coverage compared to normal plumage.
Regarding plumage morphology, there were no frizzled chickens observed in the current study that had been found in a previous study by Melesse and Negesse (Citation2011), reported as 5.7% frizzled chickens in the Sidama region. Similar to this study, Kebede (Citation2018) reported that normal plumage morphology was predominant over silky and frizzled chickens in Ethiopia. Moreover, a higher proportion of normal-feather and silky-feather chickens were observed in indigenous chickens reared in different communities in Ethiopia (Dana et al. Citation2010). But this depends mainly on the probability of chickens mating with a particular plumage morphology for successful inheritance and phenotypic display.
Moreover, the multiple correspondence analysis confirmed the strong association between morphological features and the respective districts in Euclidean space. For instance, rose comb, yellow-spotted-red earlobe, and laced plumage patterns were more associated with each other and grouped with the Aleta Chuko district. On the other hand, mottled plumage patterns, deformed rose combs, and red earlobes were associated with and grouped in Hula district. Moreover, Boricha district is characterized by chickens with a naked-neck phenotype, a yellow earlobe, a plain plumage pattern, and a silky plumage morphology. Morphological features like single-comb, white shank, red-brownish plumage color, normal feather distribution and morphology, white earlobe, and brown and white beak color are among others that characterize the chicken populations of Shebedino district.
In conclusion, this study showed the existence of rich morphological variability among unselected and traditionally managed indigenous chickens in the Sidama Region. This diversity can be considered regional and national genetic wealth and is used for genetic improvement and climatic resilience. Moreover, the body part structures of chickens have been greatly associated with productivity, health, and adaptability signals; in some instances, they are equally important as production traits. Thus, these morphological shapes and structures could effectively be incorporated into selection criteria when setting a sustainable breeding program for various production habitats in the tropics. The true relationships between the physical characteristics observed and the conditions of adaptation, productivity, and health for the chickens under study should be explored using data that has been regularly measured.
Acknowledgements
We greatly acknowledge Hawassa University College of Agriculture as well as School of Animal and Range science for arranging field transportation and services during data collection. The chicken owners, experts and field assistant of all districts were duly thanked for their good hospitality.
Disclosure statement
No potential conflict of interest was reported by the author(s).
References
- Aklilu E, Kefelegn K, Tadelle D, Banerjee K. 2013. Phenotypic characterization of indigenous chicken population in Ethiopia. Intern J Interdiscip Multidiscip Stud. 1(1):24–32.
- Assefa H, Melesse A. 2018. Morphological and morphometric characterization of indigenous chicken populations in Sheka zone, south western Ethiopia. Poultr Fisher Wildlif Sci. 6(2):1–9. doi:10.4172/2375-446X.1000200.
- Bayou Y, Bayou E, Genzebu D, Assefa H. 2022. Phenotypic characterization of indigenous chicken ecotypes in selected districts of Bench Maji Zone, South West Ethiopia. Int J Food Sci Agric. 6(3):293–300. doi:10.26855/ijfsa.2022.09.009.
- Bibi S, Muhammad F, Shumaila N, Aqsa R, Nasir K, Me S, Muzafar S. 2021. Morphological characteristics of native chicken of village Chhajjian, Haripur Pakistan. Poult Sci. 100(3):100843. doi:10.1016/j.psj.2020.11.022.
- Buranawit K, Chailungka C, Wongsunsri C, Laenoi W. 2016. Phenotypic characterization of Thai native black-bone chickens indigenous to Northern Thailand. Thai J Vet Med. 46(4):547–554. doi:10.56808/2985-1130.2773.
- Cabarles JC, Lambio AL, Vega SA, SS C, Mendioro MS. 2012. Distinct morphological features of traditional chickens (Gallus gallus domesticus L.) in Western Visayas, Philippines. Anim Genet Resour. 51:73–87. doi:10.1017/S2078633612000410.
- Chebo C, Nigussie H. 2016. Performances, breeding practices and trait preferences of local chicken ecotypes in southern zone of Tigray, northern Ethiopia. Asian J Poult Sci. 10:158–164. doi:10.3923/ajpsaj.2016.158.164.
- Cornwallis CK, Birkhead TR. 2007. Experimental evidence that female ornamentation increases the acquisition of sperm and signals fecundity. Proc R Soc B Biol Sci. 274(1609):583–590. doi:10.1098/rspb.2006.3757.
- Dana N. 2011. Breeding programs for indigenous chicken in Ethiopia: Analysis of diversity in production systems and chicken populations. [Dissertation]. Wageningen University, the Netherlands.
- Dana N, Dessie T, van der Waaij LH, van Arendonk JAM. 2010. Morphological features of indigenous chicken populations of Ethiopia. Anim Genet Resour. 46:11–23. doi:10.1017/S2078633610000652.
- Dey CJ, Valcu M, Kempenaers B, Dale J. 2015. Carotenoid-based bill coloration functions as a social, not sexual, signal in songbirds (Aves: Passeriformes). J Evolut Biol. 28(1):250–258. doi:10.1111/jeb.12560.
- Duguma R. 2006. Phenotypic characterization of some indigenous chicken ecotypes of Ethiopia. Livest Res Rur Develop. 18(9):#131. Retrieved June 22, 2023, from http://www.lrrd.org/lrrd18/9/dugu18131.htm.
- Eganhi JO, Dim NI, Momoh OM, Gwaza DS. 2010. Variation in qualitative traits in the Nigerian local chicken. Intern J Poult Sci. 9(10):978–979. doi:10.3923/ijps.2010.978.979.
- Erik D, Enbody C, Grace S, Arhat A, Huijuan B, Dobreva MP, Owen GO, Carl-Johan R, Peter RG, Rosemary BG, et al. 2021. A multispecies BCO2 beak color polymorphism in the Darwin’s finch radiation. Curr Biols. 31(24):5597–5604.e7. doi:10.1016/j.cub.2021.09.085.
- Eriksson J, Larson G, Gunnarsson U, Bed'hom B, Tixier-Boichard M, Strömstedt L, Dominic W, Annemieke J, Addie V, Ettore R, et al. 2008. Identification of the yellow skin gene reveals a hybrid origin of the domestic chicken. PLoS Genet. 4(2):e1000010. doi:10.1371/journal.pgen.1000010.
- FAO (Food and Agriculture Organization). 2012. Phenotypic characterization of animal genetic resources. FAO Animal Production and Health Guidelines No. 11. Rome.
- Fathi MM. 1987. Effect of naked neck gene on some quantitative characters in chickens. [master’s thesis] Ain Shams University, Egypt.
- Fekede G, Tadesse Y. 2021. Breeding practices and preferred traits of indigenous chicken in Western Oromia region, Ethiopia. J Livestock Sci. 12(2):85–94. doi:10.33259/JLivestSci.2021.85-94.
- Getu A, Alemayehu K, Zewdu W. 2014. Phenotypic characterization of indigenous chicken ecotypes in North Gondar Zone, Ethiopia. Anim Genet Resour. 54(3):43–45. doi:10.1017/S2078633614000113.
- Godinez CJ, Nishibori M, Espina DM. 2020. Qualitative traits and genetic characterization of native chicken (Gallus gallus domesticus) in selected areas of Eastern and Western Samar, Philippines. Ann Trop Res. 42(2):52–70. doi:10.32945/atr4225.2020.
- Gwaza DS, Dim NI, Momoh OM. 2018. Distribution of qualitative traits within and between two populations of Nigerian local chicken ecotypes. J Res Rep Genet. 2(2):6–14.
- Habimana R, Okeno TO, Ngeno K, Mboumba S, Assami P, Gbotto AA, Keambou CT, Nishimwe K, Mahoro J, Yao N, et al. 2021. Genetic diversity and population structure of indigenous chicken in Rwanda using microsatellite markers. PLoS One. 15(4):e0225084. doi:10.1371/journal.pone.0225084.
- Hamilton DG, Whiting MJ, Pryke SR. 2013. Fiery frills: carotenoidbased coloration predicts contest success in frillneck lizards. Behav Ecol. 5:1138–1149. doi:10.1093/beheco/art041.
- Hassaballah K, Zeuh V, Sembene M. 2014. Phenotypic diversity of local chickens (Gallus domesticus) in three ecological zones of Chad. Intern J Curr Res Biosci Plant Biol. 1(4):1–8.
- Hassen H. 2007. Phenotypic and genetic characterization of indigenous chicken populations in Northwest Ethiopia. [Dissertation]. University of the Free State, Bloemfontein, South Africa. pp.186.
- Hill GE. 1991. Plumage coloration is sexually selected indicator of male quality. Nature. 350:337–339. doi:10.1038/350337a0.
- Johnsson M, Gustafson I, Rubin CJ, Sahlqvist AS, Jonsson KB, Kerje S, Ekwall O, Andersson L, Jensen P, Wright D, et al. 2012. A sexual ornament in chickens is affected by pleiotropic alleles at HAO1 and BMP2, selected during domestication. PLoS Genet. 8(8):e1002914. doi:10.1371/journal.pgen.1002914.
- Kassa B, Yosef T, Esatu W, Dessie T. 2020. Village chicken breeding objectives and trait preferences of chicken producers in western Amhara, Ethiopia. J Biol Agric Healthc. 10(9). doi:10.7176/JBAH/10-9-03.
- Kebede A. 2018. Whole genome based characterization of indigenous chicken populations in Ethiopia. [PhD Dissertation] Addis Ababa University, Ethiopia.
- Knox CW. 1935. The inheritance of shank color in chickens. Genetics. 20(6):529–544. doi:10.1093/genetics/20.6.529.
- Lalhlimpuia C, Singh NS, Mayengbam P, Chaudhary JK, Tolenkhomba TC. 2021. Phenotypic characterization of native chicken ‘Zoar’ of Mizoram, India in its home tract. J Entol Zool Stud. 9(1):1756–1759.
- Lawal RA, Hanotte O. 2021. Domestic chicken diversity: Origin, distribution, and adaptation. Anim Genet. 52(4):385–394. doi:10.1111/age.13091.
- Li J, Lee MO, Davis BW, Wu P, Hsieh Li SM, Chuong CM, Andersson L. 2021. The crest phenotype in domestic chicken is caused by a 197 bp duplication in the intron of HOXC10. G3 (Bethesda). 11(2):jkaa048. doi:10.1093/g3journal/jkaa048.
- Liyanage RP, Dematawewa CMB, Silva LP. 2015. Comparative study on morphological and morphometric features of village chicken in Sri Lanka. Trop Agric Res. 26(2):261–273. doi:10.4038/tar.v26i2.8090.
- Maharani D, Mustofa F, Sari AP, Fathoni A, Sasongko H, Hariyono DN. 2021. Phenotypic characterization and principal component analyses of indigenous chicken breeds in Indonesia. Vet Word. 14(6):1665–1676. doi:10.14202/vetworld.2021.1665-1676.
- Markos S, Belay B, Tadelle D, Astatkie T. 2020. Morphometric characterization of local and exotic chicken genotypes in three agro-ecologies of northern Ethiopia. J Anim Plant Sci. 31(4):937–943. doi:10.36899/JAPS.2021.4.0287.
- McLean DJ, Froman DP. 1996. Identification of a sperm cell attribute responsible for subfertility of roosters homozygous for the Rose Comb allele. Biol Reprod. 54(1):168–172. doi:10.1095/biolreprod54.1.168.
- Mehlis M, Hilke LK, Bakker TCM. 2013. Attractive males have faster sperm in three-spined sticklebacks Gasterosteus aculeatus. Curr Zool. 59(6):761–768. doi:10.1093/czoolo/59.6.761.
- Melesse A, Negesse T. 2011. Phenotypic and morphological characterization of indigenous chicken population in Southern Region of Ethiopia. Anim Genet Resour. 49:19–31. doi:10.1017/S2078633611000099.
- Moiseyeva IG, Romanov MN, Nikiforov AA, Avrutskaya NB. 2012. Studies in chicken genetics. commemorating the 120th anniversary of the outstanding soviet geneticist A.S. serebro vsky (1892-1948). Russ J Genet. 48(9):869–885. doi:10.1134/S1022795412090074.
- Moreda E. 2015. Phenotypic and genetic characterization of indigenous chicken in Southwest Showa and Gurage Zones of Ethiopia. [Dissertation] Addis Ababa University, Ethiopia.
- Moreda E, Singh H, Sisaye T, Johansson AM. 2014. Phenotypic characterization of indigenous chicken population in south west and south part of Ethiopia. Brit J Poult Sci. 3:15–19. doi:10.5829/idosi.bjps.2014.3.1.8370.
- Mukhtar N, Khan S. 2012. Comb: An important reliable visual ornamental trait for selection in chickens. Worlds Poult Sci J. 68(3):425–434. doi:10.1017/S0043933912000542.
- Navara K, Anderson E, Edwards M. 2012. Comb size and color relate to sperm quality: A test of the phenotype-linked fertility hypothesis. Behav Ecol. 23(5):1036–1041. doi:10.1093/beheco/ars068.
- Negassa D, Melesse A, Sandip B. 2014. Phenotypic characterization of indigenous chicken populations in South-Eastern Oromia Regional State of Ethiopia. Anim Genet Resour. 55:101–113. doi:10.1017/S2078633614000319.
- Parker TH. 2003. Genetic benefits of mate choice separated from differential maternal investment in red junglefowl (Gallus gallus). Evolution. 57(9):2157–2165. doi:10.1111/j.0014-3820.2003.tb00393.x.
- Pizzari T, Snook RR. 2003. Perspective: sexual conflict and sexual selection: chasing away paradigm shifts. Evolution. 57(6):1223–1236. doi:10.1111/j.0014-3820.2003.tb00331.x.
- Rajkumar U, Rajaravindra KS, Niranjan M, Reddy BN, Bhattacharya TK, Chatterjee RN, Sharma RP. 2010. Evaluation of naked neck broiler genotypes under tropical environment. Ind J Anim Sci. 80:463–466.
- Ricardo JL, James DJ, Matthew BT, Mafalda SF, Pedro MA, José MF, Andersson L, Hill JC, Miguel C. 2016. Genetic basis for Red coloration in birds. Curr Biol. 26(11):1427–1434. doi:10.1016/j.cub.2016.03.076.
- Rotimi EA, Egahi JO, Adeoye AA. 2013. Phenotypic characterization of indigenous chicken population in Gwer-West, Benue State, Nigeria. World Scient News. 53(3):343–353.
- Sarker NR, Hoque A, Faruque S, Islam N, Bhuiyan FH. 2014. An ex-situ study on body characteristics and effect of plumage color on body weight of indigenous chicken (Gallus domesticus) in Bangladesh. Acta Sci Anim Sci. 36(1):79–84. doi:10.4025/actascianimsci.v36i1.20118.
- SAS (Statistical Analysis System). 2012. SAS for Windows, ver. 9.4. Cary, NC: SAS Institute, Inc.
- Shaker AS, Aziz SR. 2017. Internal traits of eggs and their relationship to shank feathering in chicken using principal component analysis. Poult Sci J. 5(1):1–5. doi:10.22069/PSJ.2016.11053.1188.
- Sharifi AR, Horst P, Simianer H. 2010. The effect of naked neck gene and ambient temperature and their interaction on reproductive traits of heavy broiler dams. Poult Sci. 89(7):1360–1371. doi:10.3382/ps.2009-00593.
- Shen M, Qu L, Ma M, Dou T, Lu J, Guo J, Hu Y, Yi G, Yuan J, Wang K, et al. 2016. Genome-Wide association studies for comb traits in chickens. PLoS One. 11(7):e0159081. doi:10.1371/journal.pone.0159081.
- Singh S, Taggar RK, Chakraborty D, Kumar D, Kumar N, Azad MS. 2022. Characterization of local chicken of transboundary region of Jammu and Kashmir (India). Res Sq. doi:10.21203/rs.3.rs-1568349/v1.
- Somes RG. 1990. Mutations and major variants of plumage and skin in chickens. In: RD Crawford, editor. Poultry breeding and genetics. Amsterdam: Elsevier; p. 173–174.
- Suyatno S, Sujono S, Winaya A, Zalizar L, Pangestu M. 2023. Characterization of qualitative and quantitative traits of four types of Indonesian native chickens as ancestor of New strains of local super laying hens. Jordan J Biol Sci. 16(2):171–179. doi:10.54319/jjbs/160201.
- Tadele A, Melesse A, Taye M. 2018. Phenotypic and morphological characterizations of indigenous chicken populations in Kaffa Zone, South-western Ethiopia. J Anim Husb Dairy Vet Sci. 2(1):2–9. doi:10.15761/AHDVS.1000128.
- Taye T, Dessie T, Bettridge J, Lynch SE, Melese K, Collins M, Christley RM, Wigley P, Kaiser P, Terfa Z, et al. 2013. Signature of artificial selection and ecological landscape on morphological structures of Ethiopian village chickens. Anim Genet Resour. 52:17–29. doi:10.1017/S2078633613000064.
- Terfa ZG, Garikipati S, Kassie GT, Tadelle D, Christley RM. 2019. Understanding farmers’ preference for traits of chickens in rural Ethiopia. Agric Econ. 50(4):451–463. doi:10.1111/agec.12502.
- Wang Y, Li J, Feng C, Zhao Y, Hu Y, Li N. 2017. Transcriptome analysis of comb and testis from Rose-comb Silky chicken (R1/R1) and Beijing Fatty wild type chicken (r/r). Poult Sci. 96(6):1866–1873. doi:10.3382/ps/pew447.
- Winaya A, Fahmiady DI, Suyatno S, Malik A, Mahmud A, Jaganathan R. 2023. Morphometric diversity and genetic relationship of “Bangkok” chicken (Thai game fowl) in east java, Indonesia. Jordan J Biol Sci. 16(2):189–197. doi:10.54319/jjbs/160203.
- Wragg D, Mwacharo JM, Alcalde JA, Hocking PM, Hanotte O. 2012. Analysis of genome-wide structure, diversity and fine mapping of Mendelian traits in traditional and village chickens. Heredity. 109(1):6–18. doi:10.1038/hdy.2012.9.
- Wright D, Rubin C, Schutz K, Kerje S, Kindmark A, Brandström H, Andersson L, Pizzari T, Jensen P. 2012. Onset of sexual maturity in female chickens is genetically linked to loci associated with fecundity and a sexual ornament. Reprod Domest Anim. 47:31–36. doi:10.1111/j.1439-0531.2011.01963.x.
- Yamane T. 1967. Statistics, an introductory analysis, 2nd ed. New York: Harper and Row.
- Yoshimura K, Kinoshita K, Mizutani M, Matsuda Y, Saito N. 2012. Inheritance and developmental pattern of cerebral hernia in the crested Polish chicken. J Exp Zool (Mol Dev Evol). 318:613–620. doi:10.1002/jez.b.22464.