?Mathematical formulae have been encoded as MathML and are displayed in this HTML version using MathJax in order to improve their display. Uncheck the box to turn MathJax off. This feature requires Javascript. Click on a formula to zoom.
ABSTRACT
The most critical challenge in early lactation is to meet the increasing energy demand for milk production, which results in a negative energy balance (EB). The objective of this study was to evaluate the productive performance and plasma metabolite responses of early lactating dairy cows fed diets supplemented with increasing levels of different fat sources. Diets were categorized as diets supplemented with saturated fatty acid rich fat sources (SFAR), with Ca-soaps of fatty acids (CaFA), and with polyunsaturated fatty acid rich fat sources (PUFAR). There was an interaction between crude fat level and source for dry matter intake (DMI); each percentage-unit increase reduced DMI by 0.38 and 0.77 kg/d in CaFA and PUFAR, respectively, and increased DMI by 0.55 kg/d in SFAR. Corrected milk yield increased by 0.44 kg/d for each percentage-unit increase in crude fat level. Plasma non-esterified fatty acid (NEFA) concentration increased with 0.04 mmol/L per percentage-unit increase. In conclusion, the increased crude fat level increased corrected milk yield. Fat supplementation in early lactation does not seem to cause negative effects on productive performance or metabolism, and despite a small increase, both plasma NEFA and β-hydroxybutyrate (BHB) concentrations stayed below the threshold for incidence of subclinical ketosis.
1 Introduction
The feeding strategy and management of cows during the transition period have a key role in health, productivity, and profitability (Moallem et al. Citation2007). A successful transition from late pregnancy is highly linked to delivering a healthy calf with a minimum occurrence of metabolic disorders and infectious diseases in early lactation (Nikkhah and Alimirzaei Citation2023). Transition from late pregnancy with low nutrient requirements to early lactation with high demand for nutrients creates tremendous metabolic changes, and it demands adaptation of the metabolic system and other physiological parameters (Bell Citation1995; Nikkhah and Alimirzaei Citation2023). The most critical challenge is to meet the increasing energy demand for milk production in early lactation, where DMI is limited (Drackley Citation1999), which results in a negative EB.
In order to compensate for the high energy demand in early lactation, body fat resources are mobilized as an adaptive metabolic approach to supply the energy deficiency (Zachut et al. Citation2013), which results in an increased plasma NEFA concentration (González et al. Citation2011). However, due to the controlling effect of hepatic NEFA oxidation on feed intake postpartum, the increased supply of NEFA into the liver may further decrease energy intake (Allen and Piantoni Citation2013), resulting in intensified negative EB (Piantoni et al. Citation2015). Pronounced negative EB is a well-known risk factor for metabolic disorders as ketosis and fatty liver. Fat supplement has been a long tradition to obtain increased energy concentration, thereby improving the energy status in early lactation (Grummer Citation1993). However, caution should be considered when fat is supplemented in the early lactation period because cows are already mobilizing body fat reserves. Therefore, the combination of fat supplementation and mobilization may decrease the feed intake and increase the risk of subclinical ketosis (Kuhla et al. Citation2016). Therefore, it is crucial to evaluate the effect of fat supplementation in early lactation on plasma NEFA and BHB concentrations. The objective of this meta-analysis was to evaluate the effects of different levels of different fat supplements on productive performance, plasma NEFA, and BHB concentrations in early lactation cows.
2 Materials and methods
2.1 Search strategy
To perform the current study, we searched for peer-reviewed studies that studied the effect of either different fat sources or different fat/fatty acid levels during early lactation (0-100 DIM). In the databases (Scirus, CAB, Cambridge University Press, Elsevier, Google Scholar, PubMed, ScienceDirect, Web of Science, and Springer), we searched using the following keywords: ‘early lactating cows and transition cows combined with either fat supplements, fat level, calcium salt (soap) of fatty acids, palm fat, oilseeds, flax seed/oil, sunflower seed/oil, safflower seed, canola (rape) seed/oil, oleic acid, palmitic acid, and stearic acid’. Based on the criteria, 25 studies were found. However, our final data set consisted of 15 studies published between 1990 and 2020 and the last search was done in 2021.
2.2 Inclusion and exclusion criteria
The criteria for including studies were that they include all or part of the period from calving until 100 DIM irrespective of prepartum feeding. Studies that started in the period 0–100 DIM but finished after 100 DIM were not included unless data before 100 DIM were shown separately. In studies where either crude fat level or source was confounded with other treatment factors, such data were removed from the data set (). Both continuous and crossover designs were included in the analysis because, in the meta-analysis by dos Santos Neto et al. (Citation2021), no interaction between study design and treatments (Control and calcium salts of palm fatty acids) was observed (dos Santos Neto et al. Citation2021). The EB (NEL) was obtained from the included studies, which were calculated according to NRC (1989; EB = total NEL intake - (net energy for maintenance + net energy for lactation)) in studies by Jerred et al. Citation1990 and Beam and Butler Citation1998 and NRC (2001; EB = total NEL intake - (net energy for maintenance + net energy for pregnancy + net energy for lactation + net energy for growth)) in studies by Gandra et al. (Citation2016a), De Souza et al. (Citation2019), Zhang et al. (Citation2020), and Daneshvar et al. (Citation2021). The body condition score (BCS) was reported on a 1–5 scale. The number of studies and treatments and the details of included studies are presented in and . The data were collected in an Excel spread sheet and examined according to the criteria for this meta-analysis. All variables were not reported in all studies ().
Table 1. Description of the studies included in the data set.
Table 2. Number of studies, number of observations within fat source, means ± SD, and minimum and maximum value across fat source for each parameter, and Root Mean Square Error (RMSE) in the meta-analyses.
Since different fat sources were supplied in different studies, the diets from these studies were grouped based on the fatty acid profile of the added fat source as follows: (i) saturated fatty acid rich group (SFAR), which were diets supplemented with prilled fat, palmitic acid, stearic acid, and palm fat, (ii) Ca-soaps of fatty acids group (CaFA), which were diets supplemented with Ca-soaps of fatty acids differing in degree of saturation, and (iii) polyunsaturated fatty acid rich group (PUFAR), which were diets supplemented with flax seeds, soybean seeds/oil or sunflower seeds. In two studies performed as a factorial design, the forage level (Piantoni et al. Citation2015) and starch level (Daneshvar et al. Citation2021) within the fat sources were considered as a replicate within the study. In the study by Mendoza et al. (Citation2008), the means for primiparous and multiparous cows were reported separately, and primiparous and multiparous cows were included as replicate within the study. Within each study where responses were reported for different periods of DIM, data from each period were included as replicates within the study in the analysis (Piantoni et al. Citation2015; Daneshvar et al. Citation2021). Due to different modes of action of conjugated linoleic acids (CLA) (Baumgard et al. Citation2001), CLA studies were removed from the data set. Studies with neither crude fat nor fatty acid values, as well as studies with only one level for each fat source, were removed from the analysis. In four of the studies, the fatty acid percentage was reported instead of crude fat (Jerred et al. Citation1990; Leiber et al. Citation2011; de Souza and Lock Citation2019; De Souza et al. Citation2019), and crude fat was calculated according to the equation: ether extract % in DM = fatty acids % in DM + 1 (NRC, 2001). For the milk yield, 3.5% fat corrected milk (FCM), 4% FCM, and energy corrected milk (ECM) were used in the analysis and hereafter defined as corrected milk yield. Since equations for calculating FCM and ECM were not reported in all studies, we were not able to synchronize the 3.5% FCM, 4% FCM, and ECM to the same unit. However, the effect of fat supplement on 3.5% FCM, 4% FCM, and ECM will supposedly be parallel irrespective of correction for either fat or energy.
2.3 Calculations and statistical analysis
The data were analyzed using the mixed models procedure by SAS (version 9.4; SAS Institute) using the following statistical model:
(1)
(1) where Y was the response variable in question for study i (1-15), S the fixed effect of fat source (j = SFAR, CaFA, and PUFAR), β was the regression coefficient for the effect of crude fat level of diets as a continuous variable (F varying from 1.5 to 8.8% of DM), γ was the regression coefficient for the S × F interaction between fat source and level. Moreover, p was the random effect of studies, r was the random effect of sub-studies (replication within study using e.g. different diet compositions) nested within the study (k(i) = 1 to ni, where ni ≤ 4 is the combinations of different periods of DIM and unsupplemented treatments in study i), and ϵ was the residual error. These random effects are assumed to be independent and normally distributed with zero mean and variances
,
, and
, respectively. Significance level was chosen at p ≤ 0.05 and tendencies at 0.05 < p ≤ 0.10. When the interaction between crude fat level and the source was significant, the estimated slopes were compared, and p values adjusted for multiple comparisons (padj) by Monte Carlo simulations were reported in results section. In cases where this interaction was non-significant, the overall slope across fat sources (common slope ± standard error; SE) was reported in the results section when the crude fat level was significant.
2.4 Weighting of observations and funnel plots
The means or least squares means of dependent variables extracted from selected peer-reviewed studies were weighted by the inverse of the squares of their standard error of mean (SEM) (St-Pierre Citation2001). This allowed us to maintain the expressions of dispersion in the original scale of the measurements (St-Pierre Citation2001; St-Pierre Citation2007). Therefore, studies or parameters that did not report SEM, or SD and sample size, could not be included in the analyses.
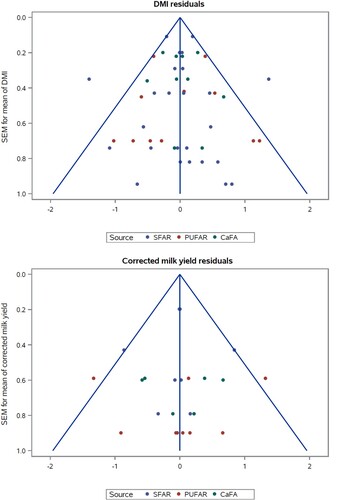
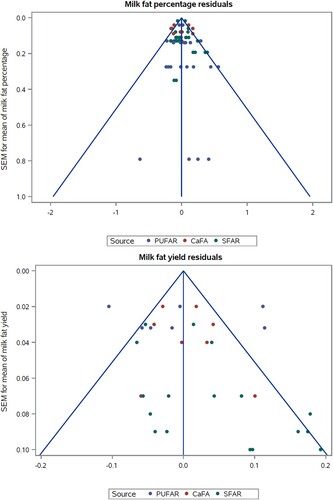
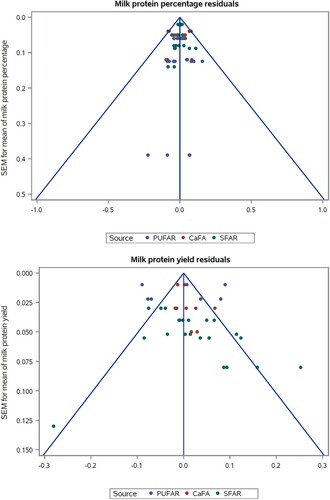
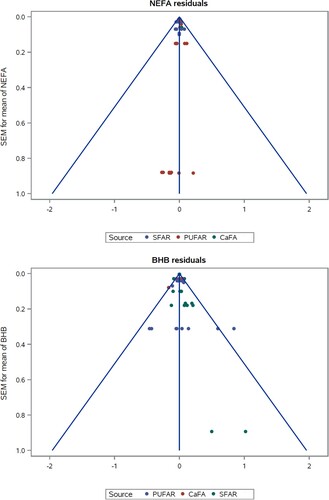
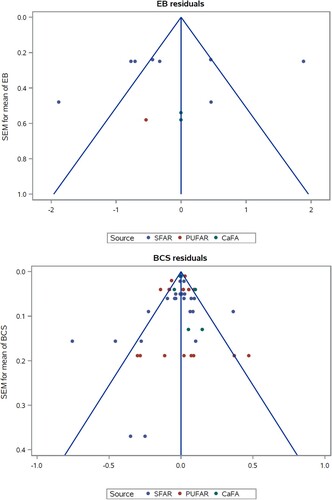
Funnel plots were used to investigate the presence of bias in the selected studies. In the present study, funnel plots were scatter plots of SEM vs. residuals from the models used for the analysis of response variables. Each square in the funnel plots represents the SEM of either mean or least squares of mean and the lines forming two sides of a triangle indicate 95% confidence limits.
3 Results
3.1 Model fitting
To evaluate the effect of crude fat level, inclusion of the quadratic effect of crude fat level was tested; however, it was non-significant for any of the variables and therefore not considered further. In addition, the effects of parity and two-way interactions between parity and fat source, and parity and crude fat level were examined but found to be non-significant and therefore not included in the final model. Within each study, the control group was included as non-supplemented fat diets and other treatment groups were included as control group supplemented with fat. Therefore, the intercept for centred fat percentage in the diets (Table 1A) of fat supplement groups (SFAR, CaFA, and PUFAR) represents the intercept across non-supplemented (control) and supplemented groups. Thus, in the present study, we do not discuss the intercepts ().
3.2 Fatty acid composition of SFAR, CaFA, and PUFAR
Fatty acid composition of fat supplement groups showed that on average 88% of total fatty acids in SFAR supplement were saturated fatty acids (C16:0 + C18:0; ). In contrast, for PUFAR supplement, on average 51% of total fatty acids were linoleic acid and linolenic acid. CaFA supplement contains on average 31% of saturated fatty acid, 37% of oleic acid, and 15% of linoleic acid.
Tables 3. Diet composition and fatty acid composition of diet supplemented with SFAR, CaFA, and PUFAR.
3.3 DMI, milk yield, and feed efficiency
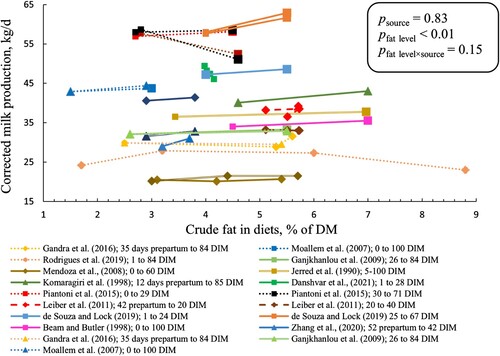
There was an interaction between crude fat level and source (p < 0.01) for DMI. We observed that each percentage-unit increase in crude fat level reduced DMI by 0.38 and 0.77 in CaFA and PUFAR, respectively, and increased by 0.55 kg/d in SFAR (). Pairwise comparison for DMI slopes showed that the slope for SFAR was greater than the slopes for PUFAR and CaFA (padj < 0.01 for both comparisons) while PUFAR and CaFA were not different. An increase was observed in corrected milk yield by increased crude fat level, and it was increased by 0.44 ± 0.10 kg/d (common slope) for each percentage-unit increase of crude fat (p < 0.01; ) but with no interaction between fat level and source. However, there was an interaction between crude fat level and source (p < 0.01) for milk yield (corrected for neither fat nor energy). Each percentage-unit increase in crude fat level increased milk yield (kg/d) by 1.14 (0.14) in SFAR, 1.37 (0.16) in CaFA, and 0.37 (0.10) in PUFAR (results not shown in graphs or tables). Pairwise comparison for milk yield slopes showed that the slope for CaFA and SFAR was greater than the slope for PUFAR (padj < 0.01 for both comparisons) while slopes for SFAR and CaFA were not different. Feed efficiency (kg corrected milk yield per kg of DMI) increased with 0.05 ± 0.01 (common slope ± SE) for each percentage-unit increase in crude fat level (P < 0.01; results not shown in graphs or tables) but without interaction between fat level and source (p = 0.73).
Figure 1. DMI (kg/d) of cows fed different sources and levels of fat supplement. SFAR (□), CaFA (Δ), and PUFAR (◊) are shown with different symbols. Solid and dashed lines indicate multiparous and primiparous cows, respectively. Same colours show the results of the same study. However, reported data with different DIM within the same study have different colours. Slopes (standard error; SE) were + 0.55 (0.09), – 0.38 (0.13), and – 0.77 (0.14) in SFAR, CaFA, and PUFAR, respectively. Slopes show the changes in DMI (kg/d) per percentage unit increase in crude fat level.
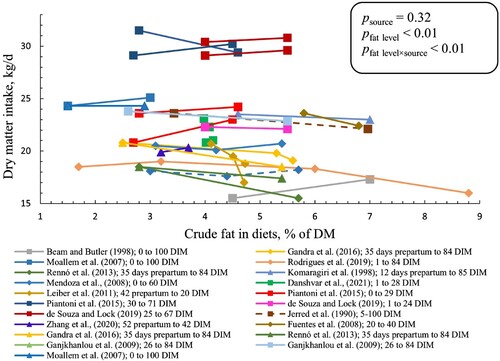
Figure 2. Corrected milk production (3.5% or 4% fat-corrected milk or energy-corrected milk) of cows fed different sources and levels of fat supplement. Solid, dotted, and dashed lines show the 4% fat-corrected milk, 3.5% fat-corrected milk, and energy-corrected milk, respectively. SFAR (□), CaFA (Δ), and PUFAR (◊) are shown with different shapes. Double solid lines show multiparous cows. Same colours show the results of the same study. However, reported data with different DIM within the same study have different colours. Slopes (SE) were 0.60 (0.13), 0.18 (0.25), and 0.17 (0.23) in SFAR, CaFA, and PUFAR, respectively. Slopes show the changes in corrected milk yield (kg/d) per percentage unit increase in crude fat level.
3.4 Milk fat and protein
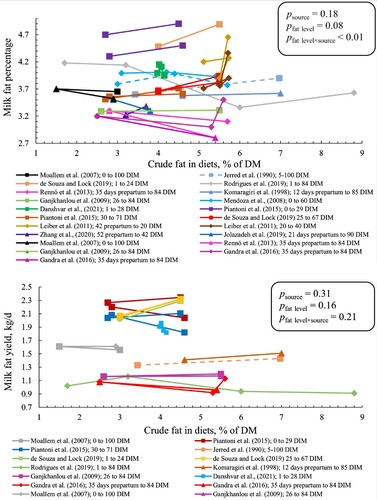
There was an interaction between crude fat level and source (p < 0.01) for milk fat percentage. We observed that each percentage-unit increase in crude fat level reduced milk fat percentage by 0.11 and 0.05 percentage in CaFA and PUFAR, respectively, and increased by 0.09 percentage in SFAR (). However, for milk fat yield, there was no effect of fat level and source (). Likewise, milk protein percentage and yield were not affected by crude fat level (Figure A1).
Figure 3. Milk fat percentage (upper panel) and milk fat yield (lower panel) of cows fed different sources and levels of fat supplement. SFAR (□), CaFA (Δ), and PUFAR (◊) are shown with different shapes. Solid and dashed lines show multiparous and primiparous cows, respectively. Same colours show the results of the same study. However, reported data with different DIM within the same study have different colours. Slopes (SE) for milk fat percentage were 0.09 (0.03), – 0.11 (0.03), and – 0.05 (0.03) in SFAR, CaFA, and PUFAR, respectively. Slopes for milk fat yield were 0.04 (0.03), – 0.02 (0.02), and – 0.02 (0.01) in SFAR, CaFA, and PUFAR, respectively. Slopes show the changes in milk fat percentage and yield (kg/d) per percentage unit increase in crude fat level.
3.5 Plasma metabolites
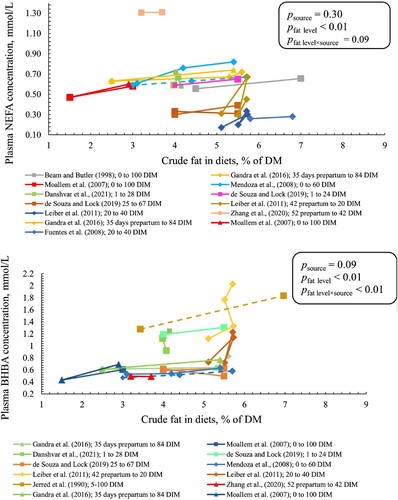
Plasma NEFA concentration increased with 0.04 ± 0.01 mmol/L (common slope ± SE) per percentage-unit increase in crude fat level (p < 0.01; ) with a tendency for interaction between fat source and level (p = 0.09). The slope tended to be higher in PUFAR than in CaFA (padj = 0.07) with no difference between CaFA and SFAR and between PUFAR and SFAR. There was an interaction between crude fat level and source for plasma BHB concentration (p < 0.01). We observed that each percentage-unit increase in crude fat level increased plasma BHB concentration by 0.009, 0.12, and 0.05 in SFAR, CaFA, and PUFAR, respectively (). Pairwise comparison for BHB slopes showed that the slope for CaFA was greater than the slopes for SFAR (padj < 0.01) with no significant difference between CaFA and PUFAR and between PUFAR and SFAR. Plasma glucose concentration decreased with 1.26 ± 0.05 mg/dL (common slope ± SE) per percentage-unit increase in crude fat level (P < 0.01) without interaction between fat source and level (results not shown in graphs or tables).
Figure 4. Plasma NEFA (upper panel) and BHB (lower panel) concentration for cows fed different sources and levels of fat. SFAR (□), CaFA (Δ), and PUFAR (◊) are shown with different shapes. Solid and dotted lines show multiparous and primiparous cows, respectively. Same colours show the results of the same study. However, reported data with different DIM within the same study have different colours. Slopes (SE) for plasma NEFA were 0.04, 0.07, and 0.02 (0.01) in SFAR, CaFA, and PUFAR, respectively. Slopes (SE) for BHB were 0.009 (0.013), 0.12 (0.03), and 0.05 (0.02) in SFAR, CaFA, and PUFAR, respectively. Slopes show the changes in BHB (mmol/L) and NEFA (mmol/L) per percentage unit increase in crude fat level.
3.6 Energy balance and BCS
Energy balance was not affected by crude fat level and no interaction was found between fat level and source (Figure A2). However, BCS tended to be affected by fat level and BCS was changed 0.01 ± 0.006 (common slope ± SE) unit per each percentage unit increase in fat level (p = 0.08).
4 Discussion
In the present meta-analysis, the added fat sources were grouped based on their expected effect on rumen fermentation as the key factor. Thus, fat supplements mainly containing palmitic and stearic acids were grouped in SFAR. Similarly, the calcium soaps of fatty acids including unsaturated fatty acids were grouped in CaFA, because CaFA are more inert in the rumen, and finally the polyunsaturated fatty acids from oilseeds that can affect the rumen fermentation categorized as PUFAR, especially for high levels of inclusion. For some of the included studies in the current meta-analysis (Komaragiri et al. Citation1998; Leiber et al. Citation2011; Rennó et al. Citation2013; Gandra et al. Citation2016a; Gandra et al. Citation2016b), fat supplement was also fed prepartum. Sensitivity in regard to potential effects on responses to prepartum fat supplementation was tested by omitting those experiments in intermediate statistical analyses. However, slopes and p values did not change considerably, and therefore the final analyses included those studies. In addition, in the present study, there was no indication of larger publication biases in terms of asymmetrical appearance of studies in the funnel plots (Figure A3).
There was a wide range of starch concentrations originating from different proportions of cereals in basal diets in the studies included in the present meta-analysis, where part of the responses could be due to an interaction between starch level and fat level (Daneshvar et al. Citation2021). In addition, a study in the current dataset showed an interaction between the forage level and fat level (Piantoni et al. Citation2015). In addition, Onetti and Grummer (Citation2004) found an interaction between forage sources and fat supplements, when tallow was fed with either (1) more than 60% of forage DM as alfalfa silage or hay, (2) more than 60% of forage DM as corn silage, and (3) mixture where both alfalfa and corn silage were within the limits 41–59% of forage DM. This may indicate that there is an interaction between forage type/level and fat level.
4.1 DMI, milk yield, and feed efficiency
The interaction between crude fat level and source for DMI demonstrated that the effect of crude fat level was different between fat sources. Fat supplementation is often seen to reduce DMI (Weisbjerg et al. Citation2008), but the increased DMI for SFAR in this study, consisting in average of mainly palmitic (≈ 60%) and stearic acids (≈ 30% of total fatty acid), shows that saturated fats can be fed without negative impact on DMI. The increased DMI for SFAR in early lactation (0–100 DIM) was inconsistent with the theory that energy intake rather than the physical capacity of the rumen may limit the DMI in energy-dense diets containing rumen inert fat despite the negative EB in early lactation (Beam and Butler Citation1998). The lack of negative effect on DMI for SFAR could be due to the lack of negative impact of SFAR on rumen fermentation. In agreement with our findings, Allen and Piantoni (Citation2013) reported increased DMI by the inclusion of highly saturated fatty acid supplement in the early lactation diets. Allen et al. (Citation2009) stated that the increased DMI could be related to a decrease in the flux of fuels from body reserves to the liver.
In line with our results regarding decreased DMI in PUFAR, Rodrigues et al. (Citation2019) reported a quadratic concave effect of soybean oil supplementation on DMI. However, Freitas Jr et al. (Citation2018) demonstrated no adverse effect of a calcium salt containing a high proportion of unsaturated fatty acids on DMI. Reduced DMI for PUFAR and CaFA is consistent with the conclusions of other meta-analyses showing that increasing crude fat in cow diets resulted in reduced DMI (Glasser et al. Citation2008; Rabiee et al. Citation2012). Allen (Citation2000) reported a negative impact on rumen fermentation, gut cholecystokinin, and rate of fatty acid oxidation in the liver as explanatory mechanisms for reduced DMI after fat supplementation. In agreement with our findings, other meta-analyses showed a reduction of DMI for calcium soaps of fatty acid (Allen Citation2000), palm fatty acids (dos Santos Neto et al. Citation2021), and unsaturated fatty acid (Allen Citation2000).
Although DMI was reduced by increasing the crude fat level, milk yield and corrected milk yield were increased by increasing the crude fat level. The increased milk yield and corrected milk yield showed that energy density could be the main driver in maintaining the milk yield despite the lowered DMI. Fat supplementation increases the energy density of diets and may increase energy intake for dairy cattle (Coppock and Wilks Citation1991). Therefore, the lack of effect of reduced DMI in CaFA and PUFAR on milk yield and corrected milk yield can be due to the fact that increased energy density in the fat supplemented diets not only counterbalanced the reduced DMI (de Souza and Lock Citation2019) but also improved the milk yield and corrected yield. An additional explanation for the increased corrected milk yield, despite the lowered DMI, could be due to a higher efficiency of milk fat synthesis from dietary fatty acid compared to de novo synthesis (Palmquist Citation1984) and lower heat increment in fat supplemented diets per unit of ingested energy compared to other energy sources (Ingvartsen Citation2006).
4.2 Milk fat and protein
The decreased milk fat percentage by increasing the crude fat level could be due to a high amount of oleic, linoleic, and linolenic acids, which can be biohydrogenated to intermediates, such as CLA and other trans fatty acids in the rumen. It has been indicated that isomers of CLA (Bauman and Griinari Citation2003) or other trans fatty acids (Peterson et al. Citation2003) reduced mammary de novo milk fat synthesis, resulting in milk fat depression. It is well established (Allen Citation2000) that the supply of high PUFA originating from feed reduces the de novo milk fatty acid synthesis (Lashkari et al. Citation2020a; Lashkari et al. Citation2020b). In addition, in CaFA with a high proportion of unsaturated fatty acids, there is a risk of hydrolysis in the rumen, which may result in partly biohydrogenated fatty acids such as trans fatty acids. Increased milk fat percentage in SFAR could be due to a high palmitic acid proportion in the fat supplements. Increased C16:0 availability for lipid synthesis in mammary epithelial cells may increase the activity of glycerol-3-phosphate acyltransferase in the mammary cells, resulting in an increased proportion of C16:0 acylated at sn-1 that initiates triacylglycerol synthesis (Tzompa-Sosa et al. Citation2014). The increase in milk fat percentage can partially be explained by the effect of fatty acid profile on energy partitioning between milk fat synthesis and body reserves. De Souza et al. (Citation2018) reported that diets with whole cottonseed increased energy partitioning towards body reserves compared to the basal diet. However, De Souza et al. (Citation2019) demonstrated that palmitic acid supplementation compared with a control diet without supplementation increased negative energy balance due to increased milk energy output, which also resulted in reduced BCS and body weight. In the study by De Souza et al. (Citation2019), reduced BCS reflected the mobilization of body reserves in the palmitic acid supplemented diet. Thus, the effect of fatty acid profile of diets on energy partitioning can be an explanation for different responses in milk fat percentage for the SFAR compared to CaFA and PUFA. The lack of negative effect of crude fat level on milk protein percentage and yield showed that crude fat level may not compromise the microbial protein synthesis in the rumen. In contrast to our findings for CaFA and PUFAR, the negative effects of increasing crude fat level on milk protein concentration have been reported as one of the most common effects of increased crude fat level (Onetti and Grummer Citation2004).
4.3 Plasma metabolites
It needs to be considered that only in 10 out of 39 treatment means (3 out of 11 studies), plasma NEFA concentration was measured in cows that were less than 30 days postpartum at the end of the trial. Similarly, for plasma BHB, only 10 out of 37 of the means (3 out of 8 studies) were measured in cows that are less than 30 days postpartum at the end of the trial. Most probably, the effect of increasing crude fat level on the plasma NEFA and BHB concentrations could have been more pronounced by having more studies with cows that are less than 30 days postpartum in the data set. Thus, the results should be interpreted with caution due to the diluting effect of cows that were beyond 30 DIM. Fat supplementation in early lactation showed inconsistent results on the plasma NEFA concentration with some studies reporting that fat supplements did not alter the plasma NEFA concentration (Beam and Butler Citation1998; Gandra et al. Citation2016a), whereas others found an increase in the plasma NEFA concentration (Moallem et al. Citation2007; De Souza et al. Citation2019). The results of the present meta-analysis showed that increasing crude fat level increased the plasma NEFA concentration slightly. However, in all the included studies except for Zhang et al. (Citation2020), the plasma NEFA concentration was lower than 1.0 mmol/L, which has been reported as the threshold for the risk of subclinical ketosis in a meta-analysis by Raboisson et al. (Citation2014). Nevertheless, in the study by Zhang et al. (Citation2020), both an unsupplemented diet and a supplemented diet with palm fat powder had a plasma NEFA concentration of 1.3 mmol/L, which was higher than the threshold for the risk of subclinical ketosis.
The severity of DMI reduction after parturition has been proposed as one of the critical factors related to metabolic disorders, i.e. fatty liver and ketosis (Grummer et al. Citation2004). Yet, the results of the EB and BCS in the present meta-analysis showed that the reduction in DMI due to fat supplementation in the diet did not increase the mobilization of body reserves, which could be due to the counterbalancing effect of increased dietary energy concentration. In support of our findings, it has been proposed that feeding supplemental fat would even reduce fatty acid mobilization from adipose tissue (Kronfeld Citation1982).
The intermediate metabolism of absorbed fatty acids differs from fatty acids mobilized from body reserves. Mobilized fatty acids from adipose tissue are transported in the blood in the form of NEFA, whereas absorbed long-chain fatty acids (with more than 14 carbon atoms) are re-esterified in the enterocytes mainly to triglycerides and packed into a special lipoprotein complex and taken up by tissues containing the enzyme lipoprotein lipase (Bauchart Citation1993). Absorbed fatty acids can also contribute to increased plasma NEFA due to incomplete uptake subsequent to the hydrolysis of plasma triglycerides by lipoprotein lipase (Grummer and Carroll Citation1991). Bionaz et al. (Citation2020) reported that lipoprotein lipase activity releases the NEFA from very low-density lipoprotein and chylomicrons originating from fat absorption. However, released NEFA does not completely permeate into the extracellular space of tissues, thus the NEFA are taken up by albumin and circulate with the NEFA pool.
The plasma BHB concentration increased by an increase in crude fat level, which was in line with the increased plasma NEFA concentration. However, it is difficult to explain the greater slope for CaFA compared to the SFAR. The increased plasma BHB may reflect that all absorbed fatty acids from the diet were not taken up by the mammary gland, oxidized, or transferred from the liver; therefore, slightly more fatty acids may end up in BHB when fat supply is increased. In agreement with our results, Grummer and Carroll (Citation1991) demonstrated that plasma ketone bodies usually were elevated when plasma NEFA concentrations were elevated. However, it is important that plasma BHB was lower than the threshold (1.4 mmol/L) for subclinical ketosis (Raboisson et al. Citation2014). The increased plasma BHB concentration could be due to the fact that the increased fatty acid absorption might trigger metabolic signals via gut peptides, which influence the fatty acid metabolism in the liver (Grummer Citation2008). In addition, the lack of effect of fat level on EB and the tendency for increased BCS reflect the lack of effect on mobilization from adipose reserves to support the milk fat synthesis and milk production.
The slight decrease in the plasma glucose concentration with increased crude fat level could be due to the replacement of part of carbohydrates in diets by fat supplement. This may also reflect the increased demand for glucose for the synthesis of milk lactose due to increased milk yield. In addition, diets with more fat are more ketogenic (Lashkari et al., Citation2024)and may result in lowered plasma glucose concentration due to the lower contribution of short-chain fatty acids from rumen carbohydrate fermentation for gluconeogenesis. It has been reported that dairy cows in early lactation may experience insulin resistance in adipose and skeletal muscle tissues, which makes the dairy cow able to partition more glucose towards the mammary gland to support the milk lactose synthesis in early lactation (Bell Citation1995; Bell and Bauman Citation1997).
4.4 Energy balance and BCS
Despite the decreased DMI combined with increased corrected milk yield by increasing the crude fat level in the diets, the EB did not change, and BCS tended to increase, which was probably due to an increased energy intake in fat supplemented diets. However, the results of BCS and EB should be interpreted with caution because BCS was measured in short-term studies. Gandra et al. (Citation2016b) reported that fatty acid supplements led to less negative EB in cows due to increased energy intake without adverse effect on DMI. Dairy cows increase fat mobilization during early lactation as a regulatory mechanism to support milk production. The lack of effect of fat level on EB and the tendency for increased BCS may seem inconsistent with the observed increase in plasma NEFA and BHB concentrations, which are metabolic indicators for fat mobilization. However, considering the small effect of increasing crude fat level on plasma BHB concentration, the small increase in plasma NEFA concentration could be mainly due to increased absorption and circulation of fat from diets as explained in section 4.3.
5 Conclusion
The results demonstrated that increased crude fat level improved the corrected milk yield. There was an interaction between fat source and level for milk fat percentage, where SFAR increased milk fat percentage and the others decreased it. DMI was reduced when crude fat level increased for CaFA and PUFAR and increased for SFAR. Increased crude fat level reduced the milk fat percentage in CaFA and PUFAR and increased SFAR. However, milk fat yield, milk protein percentage, and milk protein yield were not affected. Plasma NEFA and BHB concentrations increased slightly with increasing crude fat level, and there was an interaction between fat source and level for plasma BHB. However, by feeding fat supplements, neither plasma NEFA nor BHB concentration came close to the threshold considered for the increased incidence of subclinical ketosis of cows in early lactation. Overall, it is concluded that fat supplementation in early lactation does not seem to cause serious drawbacks for productive performance and metabolism, despite small increases in the plasma NEFA and BHB concentrations, as both parameters stay below the critical threshold for increased incidence of subclinical ketosis.
Disclosure statement
No potential conflict of interest was reported by the authors.
Data availability statement
The data that support the findings of this study are available from the corresponding author upon reasonable request.
Additional information
Funding
References
- Allen M, Bradford B, Oba M. 2009. Board-invited review: the hepatic oxidation theory of the control of feed intake and its application to ruminants. J Anim Sci. 87(10):3317–3334. doi:10.2527/jas.2009-1779.
- Allen MS. 2000. Effects of diet on short-term regulation of feed intake by lactating dairy cattle. J Dairy Sci. 83(7):1598–1624. doi:10.3168/jds.S0022-0302(00)75030-2.
- Allen MS, Piantoni P. 2013. Metabolic control of feed intake: implications for metabolic disease of fresh cows. Vet Clin Food Anim Pract. 29(2):279–297. doi:10.1016/j.cvfa.2013.04.001.
- Bauchart D. 1993. Lipid absorption and transport in ruminants. J Dairy Sci. 76(12):3864–3881. doi:10.3168/jds.S0022-0302(93)77728-0.
- Bauman DE, Griinari JM. 2003. Nutritional regulation of milk fat synthesis. Annu Rev Nutr. 23(1):203–227. doi:10.1146/annurev.nutr.23.011702.073408.
- Baumgard LH, Sangster JK, Bauman DE. 2001. Milk fat synthesis in dairy cows is progressively reduced by increasing supplemental amounts of trans-10, cis-12 conjugated linoleic acid (CLA). J Nutr 131(6):1764–1769. doi:10.1093/jn/131.6.1764.
- Beam S, Butler W. 1998. Energy balance, metabolic hormones, and early postpartum follicular development in dairy cows fed prilled lipid. J Dairy Sci. 81(1):121–131. doi:10.3168/jds.S0022-0302(98)75559-6.
- Bell AW. 1995. Regulation of organic nutrient metabolism during transition from late pregnancy to early lactation. J Anim Sci. 73(9):2804–2819. doi:10.2527/1995.7392804x.
- Bell AW, Bauman DE. 1997. Adaptations of glucose metabolism during pregnancy and lactation. J Mammary Gland Biol Neoplasia. 2:265–278. doi:10.1023/A:1026336505343.
- Bionaz M, Vargas-Bello-Pérez E, Busato S. 2020. Advances in fatty acids nutrition in dairy cows: from gut to cells and effects on performance. J Anim Sci Biotechnol. 11:1–36. doi:10.1186/s40104-020-00512-8.
- Coppock C, Wilks D. 1991. Supplemental fat in high-energy rations for lactating cows: effects on intake, digestion, milk yield, and composition. J Anim Sci. 69(9):3826–3837. doi:10.2527/1991.6993826x.
- Daneshvar D, Ghasemi E, Hashemzadeh F, Kowsar R, Khorvash M. 2021. Feeding diets varying in starch concentration supplemented with palmitic acid or stearic acid: effects on performance, milk fatty acid profile, and metabolic parameters of postpartum dairy cows. Anim Feed Sci Technol. 279:115015. doi:10.1016/j.anifeedsci.2021.115015.
- de Souza J, Lock AL. 2019. Effects of timing of palmitic acid supplementation on production responses of early-lactation dairy cows. J Dairy Sci. 102(1):260–273. doi:10.3168/jds.2018-14976.
- De Souza J, Preseault C, Lock A. 2018. Altering the ratio of dietary palmitic, stearic, and oleic acids in diets with or without whole cottonseed affects nutrient digestibility, energy partitioning, and production responses of dairy cows. J Dairy Sci. 101(1):172–185. doi:10.3168/jds.2017-13460.
- De Souza J, Strieder-Barboza C, Contreras Bravo G, Lock A. 2019. Effects of timing of palmitic acid supplementation during early lactation on nutrient digestibility, energy balance, and metabolism of dairy cows. J Dairy Sci. 102:260–273. doi:https://doi.org/10.3168/jds.2018-14976.
- dos Santos Neto J, de Souza J, Lock A. 2021. Effects of calcium salts of palm fatty acids on nutrient digestibility and production responses of lactating dairy cows: a meta-analysis and meta-regression. J Dairy Sci. 104:9752–9768. doi:10.3168/jds.2020-19936.
- Drackley JK. 1999. Biology of dairy cows during the transition period: the final frontier? J Dairy Sci. 82(11):2259–2273. doi:10.3168/jds.S0022-0302(99)75474-3.
- Freitas Jr J, Takiya C, Del Valle T, Barletta R, Venturelli B, Vendramini T, Mingoti R, Calomeni G, Gardinal R, Gandra J. 2018. Ruminal biohydrogenation and abomasal flow of fatty acids in lactating cows fed diets supplemented with soybean oil, whole soybeans, or calcium salts of fatty acids. J Dairy Sci. 101(9):7881–7891. doi:10.3168/jds.2017-13666.
- Fuentes M, Calsamiglia S, Sánchez C, González A, Newbold J, Santos J, Rodriguez-Alcala L, Fontecha J. 2008. Effect of extruded linseed on productive and reproductive performance of lactating dairy cows. Livest Sci. 113(2-3):144–154. doi:10.1016/j.livsci.2007.03.005.
- Gandra J, Barletta R, Mingoti R, Verdurico L, Freitas Jr J, Oliveira L, Takiya C, Kfoury Jr J, Wiltbank M, Renno F. 2016a. Effects of whole flaxseed, raw soybeans, and calcium salts of fatty acids on measures of cellular immune function of transition dairy cows. J Dairy Sci. 99(6):4590–4606. doi:10.3168/jds.2015-9974.
- Gandra J, Mingoti R, Barletta R, Takiya C, Verdurico L, Freitas J, Paiva P, Jesus E, Calomeni G, Rennó F. 2016b. Effects of flaxseed, raw soybeans and calcium salts of fatty acids on apparent total tract digestibility, energy balance and milk fatty acid profile of transition cows. Animal: Int J Animal Biosci. 10(8):1303–1310. doi:10.1017/S1751731116000264.
- Ganjkhanlou M, Rezayazdi K, Ghorbani G, Banadaky MD, Morraveg H, Yang W. 2009. Effects of protected fat supplements on production of early lactation Holstein cows. Anim Feed Sci Technol. 154(3-4):276–283. doi:10.1016/j.anifeedsci.2009.09.008.
- Glasser F, Ferlay A, Doreau M, Schmidely P, Sauvant D, Chilliard Y. 2008. Long-chain fatty acid metabolism in dairy cows: a meta-analysis of milk fatty acid yield in relation to duodenal flows and de novo synthesis. J Dairy Sci. 91(7):2771–2785. doi:10.3168/jds.2007-0383.
- González FD, Muiño R, Pereira V, Campos R, Benedito JL. 2011. Relationship among blood indicators of lipomobilization and hepatic function during early lactation in high-yielding dairy cows. J Vet Sci. 12(3):251–255. doi:10.4142/jvs.2011.12.3.251.
- Grummer R, Carroll D. 1991. Effects of dietary fat on metabolic disorders and reproductive performance of dairy cattle. J Anim Sci. 69(9):3838–3852. doi:10.2527/1991.6993838x.
- Grummer RR. 1993. Etiology of lipid-related metabolic disorders in periparturient dairy cows. J Dairy Sci. 76(12):3882–3896. doi:10.3168/jds.S0022-0302(93)77729-2.
- Grummer RR. 2008. Nutritional and management strategies for the prevention of fatty liver in dairy cattle. Vet J. 176(1):10–20. doi:10.1016/j.tvjl.2007.12.033.
- Grummer RR, Mashek DG, Hayirli A. 2004. Dry matter intake and energy balance in the transition period. Vet Clin Food Anim Pract. 20(3):447–470. doi:10.1016/j.cvfa.2004.06.013.
- Ingvartsen K. 2006. Feeding-and management-related diseases in the transition cow: physiological adaptations around calving and strategies to reduce feeding-related diseases. Anim Feed Sci Technol. 126(3-4):175–213. doi:10.1016/j.anifeedsci.2005.08.003.
- Jerred M, Carroll D, Combs D, Grummer R. 1990. Effects of fat supplementation and immature alfalfa to concentrate ratio on lactation performance of dairy cattle. J Dairy Sci. 73(10):2842–2854. doi:10.3168/jds.S0022-0302(90)78972-2.
- Komaragiri M, Casper D, Erdman R. 1998. Factors affecting body tissue mobilization in early lactation dairy cows. 2. Effect of dietary fat on mobilization of body fat and protein. J Dairy Sci. 81:169–175. doi:10.3168/jds.S0022-0302(98)75564-X.
- Kronfeld D. 1982. Major metabolic determinants of milk volume, mammary efficiency, and spontaneous ketosis in dairy cows. J Dairy Sci. 65(11):2204–2212. doi:10.3168/jds.S0022-0302(82)82483-1.
- Kuhla B, Metges C, Hammon H. 2016. Endogenous and dietary lipids influencing feed intake and energy metabolism of periparturient dairy cows. Domest Anim Endocrinol. 56:S2–S10. doi:10.1016/j.domaniend.2015.12.002.
- Lashkari S., Jensen S. K., Foldager L., Larsen T., Vestergaard M. 2024. A high fat to vitamin E ratio in the feed protects and improves uptake of the natural form of vitamin E in postweaning calves. J Anim Physiol Anim Nutr. 1–11. doi:10.1111/jpn.13926.
- Lashkari S, Moller J, Jensen S, Hellgren L, Sørensen M, Theil P, Sejrsen K. 2020a. Fatty acid profile of phospholipids and sphingomyelin in milk and regulation of sphingomyelin synthesis of mammary glands in cows receiving increasing levels of crushed sunflower seeds. J Dairy Sci. 103(3):2255–2263. doi:10.3168/jds.2019-17157.
- Lashkari S, Moller JW, Theil PK, Weisbjerg MR, Jensen SK, Sørensen MT, Sejrsen K. 2020b. Regulation of mammary lipogenic genes in dairy cows fed crushed sunflower seeds. Livest Sci. 239:104035. doi:10.1016/j.livsci.2020.104035.
- Leiber F, Hochstrasser R, Wettstein H-R, Kreuzer M. 2011. Feeding transition cows with oilseeds: effects on fatty acid composition of adipose tissue, colostrum and milk. Livest Sci. 138(1-3):1–12. doi:10.1016/j.livsci.2010.11.016.
- Mendoza A, La Manna A, Crespi D, Crowe MA, Cavestany D. 2008. Whole sunflower seeds as a source of polyunsaturated fatty acids for grazing dairy cows: effects on metabolic profiles and resumption of postpartum ovarian cyclicity. Livest Sci. 119(1-3):183–193. doi:10.1016/j.livsci.2008.04.005.
- Moallem U, Katz M, Arieli A, Lehrer H. 2007. Effects of peripartum propylene glycol or fats differing in fatty acid profiles on feed intake, production, and plasma metabolites in dairy cows. J Dairy Sci. 90(8):3846–3856. doi:10.3168/jds.2007-0092.
- Nikkhah A, Alimirzaei M. 2023. Management updates on prepartal stress effects on transition cow and calf health. World's Vet J. 13(2):250–257. doi:10.54203/scil.2023.wvj27.
- Onetti S, Grummer R. 2004. Response of lactating cows to three supplemental fat sources as affected by forage in the diet and stage of lactation: a meta-analysis of literature. Anim Feed Sci Technol. 115(1-2):65–82. doi:10.1016/j.anifeedsci.2004.02.009.
- Palmquist DL. 1984. Use of fats in diets for lactating dairy cows. Proceedings-Easter School in Agricultural Science. University of Nottingham.
- Peterson DG, Matitashvili EA, Bauman DE. 2003. Diet-induced milk fat depression in dairy cows results in increased trans-10, cis-12 CLA in milk fat and coordinate suppression of mRNA abundance for mammary enzymes involved in milk fat synthesis. J Nutr. 133(10):3098–3102. doi:10.1093/jn/133.10.3098.
- Piantoni P, Lock A, Allen M. 2015. Saturated fat supplementation interacts with dietary forage neutral detergent fiber content during the immediate postpartum and carryover periods in Holstein cows: production responses and digestibility of nutrients. J Dairy Sci. 98(5):3309–3322. doi:10.3168/jds.2014-8798.
- Rabiee A, Breinhild K, Scott W, Golder H, Block E, Lean I. 2012. Effect of fat additions to diets of dairy cattle on milk production and components: a meta-analysis and meta-regression. J Dairy Sci. 95(6):3225–3247. doi:10.3168/jds.2011-4895.
- Raboisson D, Mounié M, Maigne E. 2014. Diseases, reproductive performance, and changes in milk production associated with subclinical ketosis in dairy cows: a meta-analysis and review. J Dairy Sci. 97(12):7547–7563. doi:10.3168/jds.2014-8237.
- Rennó FP, d JE, Júnior F, Gandra JR, Verdurico LC, Santos MVd, Barletta RV, Venturelli BC, Vilela FG. 2013. Fatty acid profile and composition of milk protein fraction in dairy cows fed long-chain unsaturated fatty acids during the transition period. Rev Bras Zootec. 42(11):813–823. doi:10.1590/S1516-35982013001100008.
- Rodrigues JPP, de Paula RM, Rennó LN, Costa GP, Hamade VCE, Valadares Filho SC, Rennó FP, Marcondes MI. 2019. Effects of soybean oil supplementation on performance, digestion and metabolism of early lactation dairy cows fed sugarcane-based diets. Animal: Int J Animal Biosci. 13(6):1198–1207. doi:10.1017/S1751731118002781.
- St-Pierre N. 2001. Invited review: integrating quantitative findings from multiple studies using mixed model methodology. J Dairy Sci. 84(4):741–755. doi:10.3168/jds.S0022-0302(01)74530-4.
- St-Pierre NR. 2007. Meta-analyses of experimental data in the animal sciences. Rev Bras Zootec. 36:343–358. doi:10.1590/S1516-35982007001000031.
- Tzompa-Sosa DA, Van Aken G, Van Hooijdonk A, Van Valenberg H. 2014. Influence of C16: 0 and long-chain saturated fatty acids on normal variation of bovine milk fat triacylglycerol structure. J Dairy Sci. 97(7):4542–4551. doi:10.3168/jds.2014-7937.
- Weisbjerg MR, Wiking L, Kristensen NB, Lund P. 2008. Effects of supplemental dietary fatty acids on milk yield and fatty acid composition in high and medium yielding cows. J Dairy Res. 75(2):142–152. doi:10.1017/S002202990800318X.
- Zachut M, Honig H, Striem S, Zick Y, Boura-Halfon S, Moallem U. 2013. Periparturient dairy cows do not exhibit hepatic insulin resistance, yet adipose-specific insulin resistance occurs in cows prone to high weight loss. J Dairy Sci. 96(9):5656–5669. doi:10.3168/jds.2012-6142.
- Zhang Z, La S, Zhang G, Du H, Wu Z, Wang C, Liu Q, Guo G, Huo W, Zhang J. 2020. Diet supplementation of palm fat powder and coated folic acid on performance, energy balance, nutrient digestion, ruminal fermentation and blood metabolites of early lactation dairy cows. Anim Feed Sci Technol. 265:114520. doi:10.1016/j.anifeedsci.2020.114520.
Appendix
Table A1. Intercepts for centred fat in the diets supplemeted with different fat sources.
Figure A1. Milk protein percentage (upper panel) and milk protein yield (lower panel) of cows fed different sources and levels of fat supplement. SFAR (□), CaFA (Δ), and PUFAR (◊) are shown with different shapes. Solid and dashed lines show multiparous and primiparous cows, respectively. Same colors show the results of the same study. However, reported data with different DIM within the same study have different colors. Slopes (SE) for milk protein percentage were 0.01 (0.01), – 0.02 (0.02), and – 0.01 (0.02) in SFAR, CaFA, and PUFAR, respectively. Slopes (SE) for milk protein yield were 0.02 (0.03), 0.01 (0.01), and 0.002 (0.009) in SFAR, CaFA, and PUFAR, respectively. Slopes show the changes in milk protein percentage and yield (kg/d) per percentage unit increase in crude fat level.
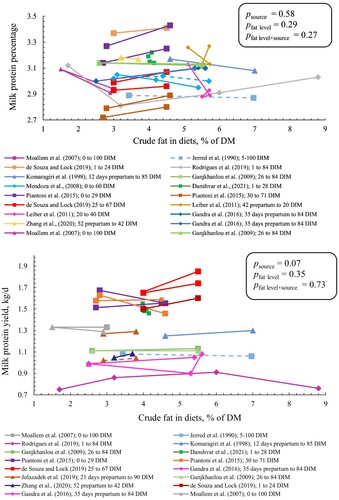
Figure A2. EB (upper panel) and BCS (lower panel) of cows fed different sources and levels of fat supplements. SFAR (□), CaFA (Δ), and PUFAR (◊) are shown with different shapes. Solid and dashed lines show multiparous and primiparous cows, respectively. Same colors show the results of the same study. However, reported data with different DIM within the same study have different colors. Slopes (SE) for EB were 0.20 (0.24), 1.03 (0.59), and 1.27 (0.51) in SFAR, CaFA, and PUFAR, respectively. Slopes (SE) for BCS were 0.01 (0.02), – 0.002 (0.009), and 0.02 (0.008) in SFAR, CaFA, and PUFAR, respectively. Slopes show the changes in EB (Mj/d) and BCS (unit) per percentage unit increase in crude fat level.
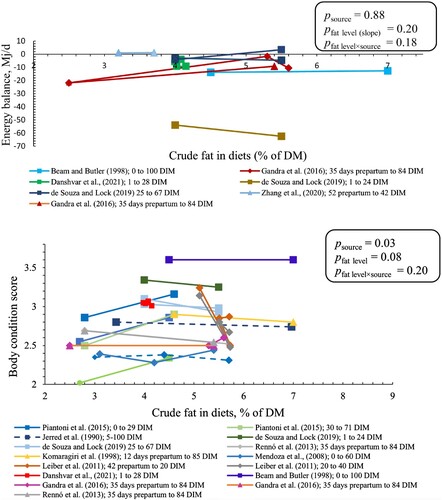
Figure A3. Funnel plots (SEM vs. residuals from models) to investigate the presence of bias in peer-reviewed selected studies. The panels show the plot for each production and plasma variable. Lines represent the 95% confidence limits.