
 ?Mathematical formulae have been encoded as MathML and are displayed in this HTML version using MathJax in order to improve their display. Uncheck the box to turn MathJax off. This feature requires Javascript. Click on a formula to zoom.
ABSTRACT
This study aimed to evaluate the effect of saline water (SW) on physiological responses, blood biochemical parameters and body weight changes in Bach Thao goats. The study was designed completely randomized with four treatments (n = 5 each), including a control as goats’ drinking fresh water (FW), goats’ drinking 0.5% SW (LSW, low SW), goats’ drinking 1.0% SW (MSW, moderate SW) and goats’ drinking 1.5% SW (HSW, high SW). The results showed that dry matter intake (DMI) decreased as SW increased (P < 0.05). Animals in the MSW group consumes highest water intake (WI), whereas animals from HSW consumed least water from 4th to 8th weeks of experiment. Respiration rate and rectal temperature in HSW were greater than those in the FW group (P < 0.05). The body weight was similar among treatments, but animals in HSW were with lower weight gain than those in the control (P < 0.05). Goats in HSW altered blood biochemical parameters in the 8th week, not for the 4th week. We concluded that Bach Thao goats drank high SW within 56 days and had negative effects on production and may effect on functions of the liver and kidney. Besides, goats from the HSW group have decreased daily WI to minimize the salt stress.
1. Introduction
Ruminant production is one of the most important livestock in Vietnam, particularly in the Mekong river delta (MRD). Because MRD can produce a large amount of fibre feed for ruminant due to the large area for rice production. However, this sector gets many problems due to climate change while the demand for animal products is increasing. One of the main challenges is the lack of available freshwater during the dry season when temperatures rise and salinity levels in the surface water increase. Animals exposed to salt or heat can get ill or even die (Nguyen Citation2017; Nguyen T, Nguyen TN et al. Citation2022). Normally, animals exposed to high ambient temperatures which altered behaviours such as body temperature, respiratory rate, eating and drinking patterns (Nguyen et al. Citation2019). Besides, the salinity level in some rivers from coastal provinces of MRD arranged 0.6–1.5% of total dissolved salts (TDS) during the dry season in 2016 (Nguyen Citation2017). Previous studies found that growing Bach Thao goat could accept 1.5% of TDS from diluted seawater (Nguyen et al. Citation2023), while Nguyen T, Truong VK et al. (Citation2022) reported that Boer crossbred goats drank 1.5% of saline water (SW) was lower in DMI and weight gain than those drinking fresh water (FW). Similarly, Boer goats can drink SW up to 1.25% and were very sensitive to drink SW if they drink for a long period (Runa et al. Citation2019). Moreover, the animal’ response to SW depends on the species such as goat and sheep adapted with SW by excreting more via urine, while camel drank less SW to decrease the salt stress (Abou Hussien et al. Citation1994). Therefore, the effects of high SW may affect water intake (WI) and excretion (Assad and El-Sherif Citation2002; Albuquerque et al. Citation2020) and thermoregulation capacity (Eltayeb Citation2006; Mdletshe et al. Citation2017). The results from previous studies show that animals may respond to high SW by drinking less water or altering physiological responses. But how do the effects of SW on Bach Thao goats in the long term are poorly understood? Thus, this study aimed to determine the long-term effects of SW on weight gain and functions of the kidney and liver in growing goats. We hypothesized that goats with prolonged use of 1.5% of diluted seawater (8 weeks) had negative impacts on the performance of the kidney and liver.
2. Materials and methods
This experiment was followed by the protocol of the Scientific committee, Can Tho university, Vietnam (#3559). The average air temperature and humidity from this experiment are presented in .
Table 1. The air temperature and humidity from this experiment.
2.1. Experimental management
This study was designed completely randomized with four treatments and five replicates, consisting of 20 Bach Thao male goats aged approximately 6 months (17.46 ± 0.23 kg). All goats were kept in metabolic cages in 1.2 × 0.7 m-shaped pens with a plastic floor. The treatments were control as goats drinking FW, goats drinking 0.5% of SW (LSW, low SW), goats drinking 1.0% of SW (MSW, moderate SW) and goats drinking 1.5% of SW (HSW, high SW). The drinking water for goats used either FW or concentrated seawater (9.7% TDS) mixed with FW to achieve water with a TDS concentration of 0.5%, 1.0% and 1.5%, according to C1V1 = C2V2 (where C1 is the concentration of the starting solution; V1 is the volume of the starting solution; C2 is the concentration of the final solution and V2 is the volume of the final solution). Then the salinity level was checked using a refractometer (Master S28M, Atago, Japan). The chemical compositions of FW and concentrated seawater are presented in . We provided 2 kg of water in each container for before morning feeding and refilled it before afternoon feeding and goats had free access to water. The experiment was carried out for 63 days with 7 days for the adaptation period and 56 days for the data collection period. The animals received a diet including 70% corn silage and 30% concentrate (7.8% soybean meal, 2% molasses, 8% rice bran, 11.3% corn meal and 0.9% limestone) as the total mixed ratio (TMR). The chemical compositions of the TMR in was 29.5% for DM, 16.2% for CP, 28.5% for ADF and 39.5% for NDF. Goats fed TMR ad libitum (refusals always exceeded 10% of experimental diet), twice daily at 07:00 and 15:00 h. All goats were weighed before morning feeding at the beginning, 4th and 8th weeks of the study. Then body weight gain was calculated between 4th and 0th weeks (WG04); 8th and 4th weeks (WG48); 8th and 0th weeks (WG08). The body weight gain was calculated by the following formula:
Table 2. The chemical compositions of fresh water and concentrated seawater.
2.2. Data measurement and analysis
WI and DMI were measured every day throughout the experiment. Daily DMI and WI were calculated by the following formula:
The feed samples were collected daily and kept in a freezer at −20°C. Feed samples were thawed, well mixed at the end of experiment and subsamples were dried at 65°C for 36 h for the analysis of crude protein (CP) and ash from the method of AOAC (Citation1990) and other parts of subsamples were dried in an oven at 105°C until determining dry matter. But the analysis of neutral detergent fibre (NDF) and acid detergent fibre (ADF) was followed by the method of Van Soest et al. (Citation1991). Na+, K+, Ca2+ and Mg2+ from water samples were analysed by the atomic absorption spectrophotometry (Thermo iCE3000 series, Thermo Fisher Scientific, China), while Cl− was titrated by AgNO3 0.02N. EC was determined by an EC metre (Schott instruments D-55122, Mainz, Germany) and TDS (g/L) = EC (mS/cm) × 0.454.
Respiration rate (RR) and rectal temperature (RT) were determined once a week throughout the experiment at 07:00, 09:00, 11:00, 13:00, 15:00, 17:00 and 19:00 h. A thermometer (C202, Terumo, Tokyo, Japan) was used for the measurement of RT and the RR was measured by the movement of the flank within one minute. On days 27 and 55 of the experiment, blood samples were collected from the jugular vein of goats into a heparin tube at 09:00 h and then centrifuged at 10 min (900×g) for harvesting the plasma samples for the analysis of biochemical parameters. An automatic clinical chemistry analyzer was used for the measurement of plasma urea, creatinine, AST and ALT levels (XL200, Erba Mannheim, Germany) and plasma electrolytes (ST200 PRO, Sensa Core, India).
2.3. Statistical analysis
The data for DMI, WI and blood biochemical parameters were analysed with the repeated two-way analysis of variance (ANOVA). The data for average DMI and WI, RT, RR, body weight and weight gain were analysed by one-way ANOVA. The main effects or pairwise comparisions were performed by the Tukey posttest. Significance was declared at P < 0.05.
3. Results
There was an effect of SW on RR from 07.00 to 19.00 h (, P ≤ 0.05). Goats in the SW groups showed greater RR than the FW group. Similarly, RT was affected by SW and goats from the saline group showed increased RT as SW increased, particularly between control and HSW groups at 09.00; 11.00 h and 15.00 to 19.00 h (, P ≤ 0.05). In contrast, RT did not differ between treatments at 07.00 and 13.00 h (, P > 0.05).
Table 3. The effect of SW in drinking water on RR (breath/min).
Table 4. The effect of SW in drinking water on RT (°C).
Average DMI differs between treatments and lower DMI in the HSW group compared to the FW group (, P ≤ 0.05). In contrast, average WI increased from low-to-moderate SW and then WI decreased at high SW in this study (, P ≤ 0.05). Long-term SW influenced eating and drinking. Specifically, DMI and WI showed significant differences from 5th to 8th weeks of experiment ( and 2, P ≤ 0.05). However, body weight at the 4th and 8th weeks from this study did not differ among treatments (, P ≤ 0.05). Similarly, weight gain from the initial to 4th week of experiment was not affected by SW, but weight gain from 4th to 8th weeks or 0th to 8th weeks of experiment decreased as SW increased (, P ≤ 0.05).
Figure 1. The effect of SW in drinking water on DMI (A) and water intake (B) throughout the experiment. FW: fresh water; LSW: low SW (0.5%); MSW: medium SW (1.0%); HSW: high SW (1.5%); WK: week. * ≤ 0.05.
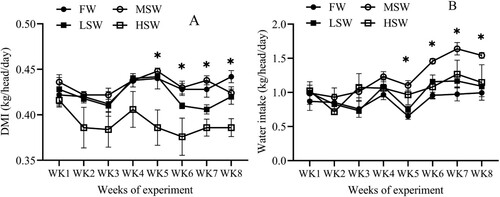
Table 5. The effect of SW in drinking water on DMI, water intake, body weight (kg) and weight gain (g/head/day).
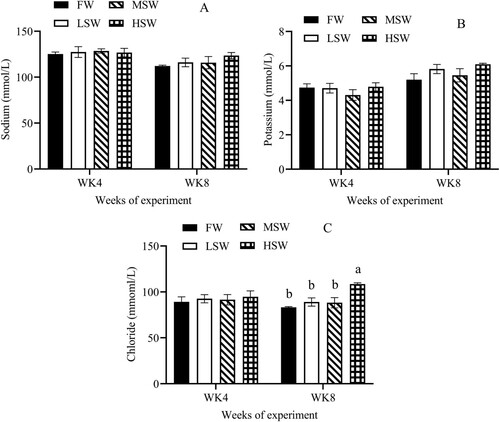
There was an effect of SW at the 8th week of experiment on levels of plasma creatinine, urea, AST and ALT in this study ((A and B); (A and B), P ≤ 0.05). But these parameters did not differ among treatments at the 4th week. Plasma sodium and potassium concentrations were no significant difference at the 4th and 8th weeks ((A and B), P > 0.05), but plasma chloride level increased as SW increased at the 8th week ((C), P ≤ 0.05), not for the 4th week of experiment.
Figure 2. The effect of SW in drinking water on plasma levels of creatinine (A) and urea (B) at the 4th and 8th weeks of experiment. FW: fresh water; LSW: low SW (0.5); MSW: medium SW (1.0%); HSW: high SW (1.5%); WK: week. a, b – Different small letters differ significantly (P ≤ 0.05).
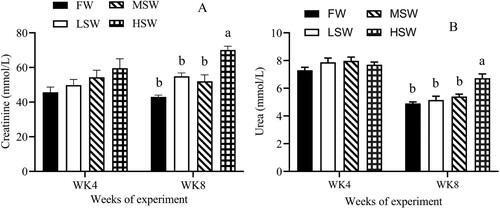
Figure 3. The effect of SW in drinking water on plasma levels of AST (A) and ALT (B) at the 4th and 8th weeks of experiment. FW: fresh water; LSW: low SW (0.5%); MSW: medium SW (1.0%); HSW: high SW (1.5%); WK: week. a, b – Different small letters differ significantly (P ≤ 0.05).
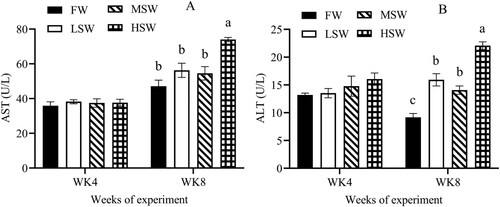
Figure 4. The effect of SW in drinking water on the plasma levels of sodium (A), potassium (B) and chloride (C) at 4th and 8th weeks of experiment. FW: fresh water; LSW: low SW (0.5%); MSW: medium SW (1.0%); HSW: high SW (1.5%); WK: week. a, b – Different small letters differ significantly (P ≤ 0.05).
4. Discussions
The results in this study showed that RT and RR from goats were affected by SW and environmental conditions throughout the day. Higher RT may come from the higher heat production during mineral excretion via urine (Arieli et al. Citation1989; Nguyen T, Truong VK et al. Citation2022), greater energy use for mineral absorption and excretion (Tsukahara et al. Citation2016) or the impacts of THI increase during daytime (07:00 to 19:00 h) in this study. As a result, animals try to eliminate body heat by increasing RR even though it stays in the cooling time of day (07:00 h or 19:00 h). Cardoso et al. (Citation2021) found that SW did not affect RR from goats, but high temperature (26–32°C) increased RR from 21.5 to 26.5 breaths/min. Similarly, sheep drank SW ranging from 0.64–0.96% did not show a significant difference RT (Cardoso et al. Citation2021), but RT increased as air temperature increased in goats (Araujo et al. Citation2017; Nguyen et al. Citation2018). Silanikove (Citation2000) reported that normal RR from goats was 40 breaths/min and above this level, goats may get exposed to heat stress. Our goats from the current study may be affected by SW or air temperature and therefore, they showed more influence on performance and health status.
SW did not affect DMI during the first four weeks in this study, whereas DMI decreased as the SW level increased from the second four weeks of experiment. Lower DMI from the SW group may be due to lower nutrient digestibility as mentioned by previous studies (Yirga et al. Citation2018; Nguyen T, Nguyen TN et al. Citation2022). Some studies found that DMI was not affected by SW level up to 1%, but a higher concentration of SW DMI decreased in goats (Abou Hussien et al. Citation1994; Nguyen T, Nguyen TN et al. Citation2022). The results also showed that WI increased up to 1% SW from the second four weeks of experiment and decreased WI in 1.5% of SW. This result indicated that animals minimized the salt stress in high SW by decreasing WI (Abou Hussien et al. Citation1994). Moreover, this study showed that when goats drank high SW, they spent more time for panting (), not for drinking. This suggests that goats in HSW feel uncomfortable, alter their behaviour to adapt to 1.5% of SW (HSW group). This finding is consistent with previous studies (Eltayeb Citation2006; Nguyen T, Nguyen TN et al. Citation2022). In this study, the significant decrease in weight gain of goats from the HSW group from the 4th to 8th weeks of experiment could be attributed to decreased feed intake due to lower DMI from the 4th to 8th weeks of this study and nutrient digestibility (Yirga et al. Citation2018; Nguyen T, Truong VK et al. Citation2022) or SW also affected rumen function and decreased in microbial loads (Attia-Ismail et al. Citation2008). Although the present experiment demonstrated a significant effect of weight gain, body weight throughout the experiment in this study was not significant among groups. This probably due to the variation of body weight across the experiment.
This study showed that levels of creatinine, urea, ALT and AST in the HSW group significantly increased at the 8th week and not the 4th week of experiment compared to the FW group or LSW and MSW groups. These results suggested that goats that drank 1.5% of SW in 56 days may undergo impaired kidney and liver functions. Higher AST and ALT activities may attribute to these enzymes, leaking from hepatocytes due to pressure damage by crystal formation (Ghanem et al. Citation2018). This finding is consistent with the observations of Runa et al. (Citation2022) when goats drank SW (12 ppt), the AST and ALT values were higher. Similarly, SW of 1.35–1.45% affected sheep and camel (Assad and El-Sherif Citation2002). However, Runa et al. (Citation2020) found that there was no effect of SW on AST and ALT values and similar to the 4th week of the current study. The ALT and AST values from this experiment stayed in a normal range, as reported by Diana (Citation2007). Plasma creatinine level was affected by SW at the 8th week of experiment, particularly between FW and HSW groups. Although the level of plasma creatinine was influenced by SW in this study, creatinine concentration still stayed in normal range, as reported by Jackson and Cockcroft (Citation2002). The result in plasma creatinine concentration was similar to the observations in goats (Runa et al. Citation2022) and Barki sheep (Ghanem et al. Citation2018). Plasma urea concentration was affected by SW at the 8th week and not the 4th week in the current study. Higher plasma urea level may be due to higher urea production or lower urea elimination via the kidney. But this study showed that goats from the HSW group had lower CP intake due to lower DMI intake and followed by lower urea production. Therefore, higher plasma urea from HSW in this study may show the impacts of high SW on renal impairment rather than from blood urea production from CP intake (Higgins Citation2016).
There was no impact of SW on plasma sodium and potassium levels in this study at 4th and 8th weeks of the experiment. This finding was consistent with experiments in goats (Nguyen T, Nguyen TN et al. Citation2022) and sheep (Assad and El-Sherif Citation2002). But some studies found that animals drank water with saline increased in serum sodium and potassium (Runa et al. Citation2022). Plasma chloride concentration from the HSW group was significantly higher than those from other groups at the 8th week. This may be due to a higher chloride intake from the HSW group than the FW group or LSW and MSW groups in this study. This finding was consistent with the report of Runa et al. (Citation2022) and the level of plasma electrolytes in this study stayed in the reference range (Jackson and Cockcroft Citation2002).
5. Conclusions
We concluded that Bach Thao goats that drank high diluted seawater within 56 days had negative effects on production and may alter the enzymes of the liver and kidney. But Bach Thao goats can tolerate 1.5% of diluted seawater for 28 days. In addition, Bach Thao goats drank high SW have decreased thermoregulation by increasing RT. Moreover, animal adapted to high SW by decreasing total daily WI.
Acknowledgement
This research was funded by the National Foundation for Science and Technology Development (Nafosted), Vietnam, under grant number 106.05-2020.45.
Disclosure statement
No potential conflict of interest was reported by the author(s).
Correction Statement
This article has been corrected with minor changes. These changes do not impact the academic content of the article.
References
- Abou Hussien ERM, Gihad EA, El-Dedawy TM, Abdel Gawad MH. 1994. Reaction of camels, sheep and goats with salt water. 2. Metabolism of water and minerals. Egypt J Anim Prod. 31:387–401. doi:10.21608/ejap.1994.108862.
- Albuquerque IRR, Araújo GGL, Voltolini TV, Moura JHA, Costa RG, Gois GC, Costa SAP, Campos FS, Queiroz MAA, Santos NMSS. 2020. Saline water intake affects performance, digestibility, nitrogen and water balance of feedlot lambs. Anim Prod Sci. 60:1–7. doi:10.1071/AN19224.
- AOAC. 1990. Official method of analysis, 15th ed. Arlington, VA: Association of Official Agricultural Chemists, Inc.
- Araujo TGP, Furtado DA, Nascimento JWB, Medeiros AN, Lopes Neto JP. 2017. Thermoregulatory responses and adaptability of Anglo-Nubiana goats maintained in a thermoneutral temperature and under heat stress. J Amin Behav Biometeorol. 5:106–111. doi:10.31893/2318-1265jabb.v5n3p106-111.
- Arieli A, Naim E, Benjamin RW, Pasternak D. 1989. The effect of feeding saltbush and sodium chloride on energy metabolism in sheep. Anim Prod 49:451–457. doi:10.1017/S0003356100032657.
- Assad F, El-Sherif MMA. 2002. Effect of drinking saline water and feed shortage on adaptive responses of sheep and camels. Small Rumin Res. 45:279–290. doi:10.1016/S0921-4488(02)00083-4.
- Attia-Ismail SA, Abdo AR, Asker ART. 2008. Effect of salinity level in drinking water on feed intake, nutrient utilization, water intake and turnover and rumen function in sheep and goats. Egypt J Sheep Goats Sci. 3:77–94.
- Cardoso EDA, Furtado DA, Ribeiro NL, Saraiva EP, do Nascimento JWB, de Medeiros AN, Pereira PHB. 2021. Intake salinity water by creole goats in a controlled environment: ingestive behavior and physiological variables. Trop Anim Health Prod. 53(3):333. doi:10.1007/s11250-021-02754-8.
- Diana NC. 2007. Appendix: therapeutic drug monitoring and laboratory reference ranges. In: Stephen JM, Maxine AP., editor. Current medical diagnosis and treatment, 46th ed. McGraw Hill; p. 1767–1775.
- Eltayeb EE. 2006. Effect of salinity of drinking water and dehydration on thermo regulation, blood and urine composition in nubian goats. M.Vet.Sci. Thesis Faculty of Veterinary Medicine, University of Khartoum, Sudan.
- Ghanem M, Zeineldin M, Eissa A, El Ebissy E, Mohammed R, Abdelraof Y. 2018. The effects of saline water consumption on the ultrasonographic and histopathological appearance of the kidney and liver in Barki sheep. J Vet Med Sci 80(5):741–748. doi:10.1292/jvms.17-0596.
- Higgins C. 2016. Urea and the clinical value of measuring blood urea concentration. Acutecaretesting.org [accessed 2023 March 3]. https://acutecaretesting.org/en/articles/urea-and-the-clinical-value-of-measuring-blood-urea-concentration.
- Jackson PGG, Cockcroft PD. 2002. Clinical examination of farm animals. Oxford: Blackwell Science, p. 303–305.
- Mdletshe ZM, Chimonyo M, Marufu MC, Nsahlai IV. 2017. Effects of saline water consumption on physiological responses in Nguni goats. Small Rumin Res. 153:209–211. doi:10.1016/j.smallrumres.2017.06.019.
- Nguyen NA. 2017. Historic drought and salinity intrusion in the Mekong River Delta in 2016: lessons learned and response solutions. Vietnam J Sci Technol Eng. 59(1):93–96. doi:10.31276/VJSTE.59(1).93.
- Nguyen T, Chaiyabutr N, Chanpongsang S, Thammacharoen S. 2018. Dietary cation and anion difference: effects on milk production and body fluid distribution in lactating dairy goats under tropical conditions. Anim Sci J 89(1):105–113. doi:10.1111/asj.12897.
- Nguyen T, Chanpongsang S, Chaiyabutr N, Thammacharoen S. 2019. The effect of dietary ions difference on drinking and eating patterns in dairy goats under high ambient temperature. Anim Biosci. 32(4):599–606.
- Nguyen T, Nguyen TN, Nguyen VH, Thammacharoen S. 2022. The effects of high saline water on physiological responses, nutrient digestibility and milk yield in lactating crossbred goats. Livest Res Rural Dev. 34(37).
- Nguyen T, Truong VK, Nguyen TN, Thammacharoen S. 2023. Salt tolerance threshold and physiological responses in Bach Thao goats drank diluted seawater under tropical conditions. Vet World. 16:1714–1720. doi:10.14202/vetworld.2023.1714-1720.
- Nguyen T, Truong VK, Nguyen VH, Nguyen TN, Thammacharoen S. 2022. Effects of high salinity in drinking water on behaviors, growth and renal electrolyte excretion in crossbred Boer goats under tropical conditions. Vet World. 15:834–840. doi:10.14202/vetworld.2022.834-840.
- Runa RA, Brinkmann L, Gerken M, Riek A. 2019. Adaptive capacity of Boer goats to saline drinking water. Animal. 13:2268–2276. doi:10.1017/S1751731119000764.
- Runa RA, Gerken M, Riek A, Brinkmann L. 2020. Boer goats physiology adaptation to saline drinking water. Res Vet Sci 129:120–128. doi:10.1016/j.rvsc.2019.12.014.
- Runa RA, Maksud S, Rahman MS, Hasan M, Alam MR. 2022. Impact of drinking of saline water on hemato-biochemical parameters of Black Bengal goats in the selected areas of Bangladesh. Saudi J Bio Sci. 29(10):103397. doi:10.1016/j.sjbs.2022.103397.
- Silanikove N. 2000. Effects of heat stress on the welfare of extensively managed domestic ruminants. Livest Prod Sci 67(1–2):01–18. doi:10.1016/S0301-6226(00)00162-7.
- Tsukahara Y, Puchala R, Sahlu T, Goetsch AL. 2016. Effects of level of brackish water on feed intake, digestion, heat energy, and blood constituents of growing Boer and Spanish goat wethers. J Anim Sci. 94(9):3864–3874. doi:10.2527/jas.2016-0553.
- Van Soest PJ, Robertson JB, Lewis BA. 1991. Methods for dietary fiber neutral detergent fiber and non-starch polysaccharides in relation to animal nutrition. J Dairy Sci 74:3583–3597. doi:10.3168/jds.S0022-0302(91)78551-2.
- Yirga H, Puchala R, Tsukahara Y, Tesfai K, Sahlu T, Mengistu UL, Goetsch AL. 2018. Effects of level of brackish water and salinity on feed intake, digestion, heat, energy, ruminal fluid characteristics, and blood constituent levels in growing Boer goat wethers and mature Boer goat and Katahdin sheep wethers. Small Rumin Res. 164:70–81. doi:10.1016/j.smallrumres.2018.05.004.