
Abstract
Earthquakes of 23 October 2011 and 9 November 2013 caused significant destruction on existing built-up areas of Van City, Turkey and had led to great loss of life and property. With the aim of identifying the effects of these two high-destructive earthquakes on spatial transformation process of the city, as well as to evaluate applied urban transformation strategies concerning to remove and mitigate the unfavourable effects of these earthquakes, maximum likelihood classification (MLC) is applied on related RapidEye satellite images to find out the urban macro-form changes, the change detection outputs by means of MLC results of the RapidEye satellite images dated before and after earthquakes which indicate that the overall accuracies are computed over 80%. The general results also reveal that the accuracies obtained are very promising to analyse spatial effect of the earthquakes on spatial transformation of the city. The identified findings of this analysis provide useful inputs to forthcoming researches aiming to evaluate the success of those kinds of urban transformation processes that may occur after similar natural disaster cases.
1. Introduction
On 23 October 2011 at 13:41 local time, the Van earthquake with a destructive magnitude of 7.2 Mw struck near the city of Van, Tabanlı village. After 18 days, the second Van earthquake on 9 November 2013 with a magnitude of 5.6 Mw struck the Edremit district that is located 15 km away from the city of Van. These two earthquakes caused significant destruction on existing built-up areas of the city and had led to great loss of life and property.
Natural disasters have been responsible for the deaths of millions of people and huge economic losses over the history of civilisation. As more than half of the world population currently lives in cities and most of the economic assets are concentrated in the cities; natural disaster risks in urban areas are higher due to the variety and clustering of elements at risk in urban areas. Today, cities are growing and, naturally, the vulnerabilities increase due to the growing complexity of urban processes. Hence, the reduction and mitigation of the natural disaster risk require the development of effective disaster management policies.
Disaster management is a cyclic process (Figure ). The phases of the cycle are response, recovery, mitigation and preparedness, and the temporal extent of each phase is not definite for each disaster situation. Although there are no definite borders among those disaster phases illustrated in Figure , using this cycle is efficient to develop the disaster management strategies.
Figure 1. Disaster management cycle.
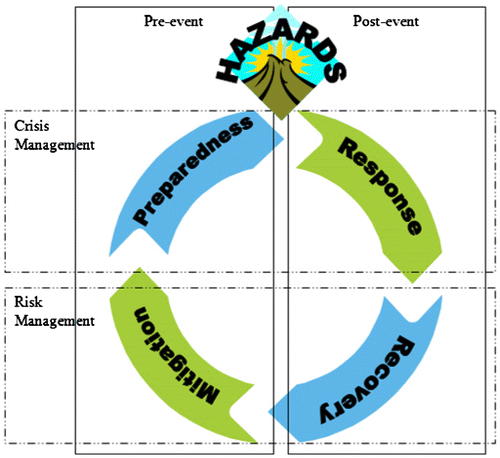
The most strategic and long-term phase of disaster management cycle, which covers the pre-event and post-event works, is the mitigation phase. It is the phase where the physical structure of cities is developed by scientific data and techniques with the assistance of planning policy at the macro scale. The mitigation phase is reflected into the physical space by a planning field that includes plans at different scales from the development plan at the national and regional scales to the blueprint plan at the local scale. In this context, it is an obligation to link and coordinate planning system and disaster management cycle.
Today, geographic information technologies (GITs) have substituted the conventional manual systems for spatial data storage, analysis and map generation. All kinds of geographical scientific visualisations and analysis could be possible by using GITs for each scale and application, which has a spatial component. Different representation and analysis methods of the spatial data are crucial for today’s GITs.
Remote sensing (RS), one of the main component of the GITs, is increasingly utilised by the spatial decision support systems (SDSSs), which is utilised for an entire disaster management circle and commonly recognised as key support tools (Thomas, Ertugay, & Kemec, Citation2006). It is important to mention that for each phase of the disaster management circle, the data have to be spatial and longitudinal. In disaster management, scientific information presentation is more useful for decision-makers; if the presentations are pertinent and visually understandable, then it is relevant that risk communication is achieved more prosperously. Because of the complexity and variety of risk elements (such as social, economic, cultural and physical) of urban environments, mapping disaster at urban contexts is complicated. Today, RS technology enables the availability of huge amounts of data, rich in temporal, spatial and spectral dimensions. The development of RS technology increases abstraction ability thus earth-related processes could be modelled more precisely and accurately. Therefore, the use of RS has become essential in all phases of the urban disaster management applications.
The entry of urban transformation concept in Turkish literature dated to the years of 1980s. However, the way of interpretation of urban transformation nowadays is mostly formulated after the 1999 Kocaeli earthquake that struck İstanbul. Urban transformation is, basically, a tool. In other words, urban transformation projects are a kind of tool for applying strategic planning principles developed regarding sustainability phenomena at a city or a regional or a country scale. While the relationship between urban transformation and earthquake is largely underlined in the Turkish case, this is not a mandatory situation as well. Literature reveals that there are plenty of reasons and rationales behind urban transformation projects such as urban decline, slum clearance, preservation of historic places, rehabilitation of existing building stock and increase quality of life. As previously mentioned, earthquake is interpreted as the only and the unquestionable rationale that is hidden in urban transformation processes in the case of Turkey.
Despite the fact that the relationship between earthquake and urban transformation is close and dense, this does not mean that all urban transformation projects are the same as well. In this respect, the main aim of these projects is to transform unhealthy areas to sustainable and healthy residential areas; however, the outcomes of most urban transformation projects show that both previous and future residents of such neighbourhoods are not one of the main concerns of these projects at all. Here, it is clear that while the main objective is to transform the deprived areas, earthquake is interpreted as a meaningful and legislative reason behind this transformation.
Study is organised into five sections. The next section provides the needed background information. Section 3 introduces the case and utilised methodology. Results and discussions are given in the next section. The last section elaborates upon the next steps for extending and testing this method for evaluating the urban transformation applications.
2. Background
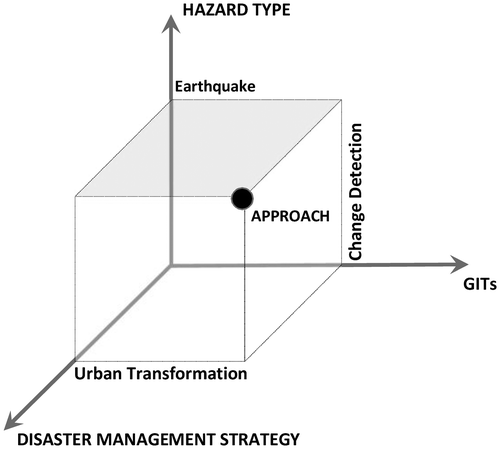
Through the aim of identifying the effects of these two high-destructive earthquakes on the spatial pattern of Van City, the study was carried out on three basic phenomena: Hazard Type, Disaster Management Strategy and GITs. If these three phenomena are depicted as the axis of a 3D Cartesian coordinate system, the approach of the study earthquake constitutes the interception point for hazard type axis, change detection analysis of RS constitutes the interception point for GITs axis and urban transformation constitutes the interception point for disaster management strategy axis (Figure ). Background information, related with the study, is given in this context under two subheadings.
Figure 2. Schematic representation of the research framework.
2.1. RS for natural hazards
As indicated previously, the introduction to disaster management has a cyclic manner and has four main phases. Related natural hazards literature is given in the association with these phases. There are a large number of studies that have taken the RS usage for effective disaster management as the subject area, since these technologies are utilised throughout the whole disaster management cycle as a tool for supporting the decision-making processes. Table summarises these studies in an integrated manner1. Basically, Table contains RS utilisation subjects for related disaster management phase and related studies.
Table 1. RS utilised disaster management study examples (adopted from Thomas et al., Citation2006).
2.2. Urban transformation as a disaster management strategy
In his well-known study, Roberts (Citation2000) identifies urban transformation process as
a comprehensive and integrated vision and action which leads to the resolution of urban problems and which seeks to bring about a lasting improvement in the economic, social, physical and environmental conditions of an area that has been subject to change.
In other words, urban transformation process is three-folds: social, economic, and physical and environmental.
Regarding the comprehensive point of view, the transformation of economic sphere of the area has a crucial role during urban transformation process. In a simple word, a successful economic transformation of a city has two main components: ‘the ability of the city to retain local expenditure and to attract more spending from outside determine the demand side of the process’ (Iveynat, Uzun, & Kamacı Citationin review). As Jeffrey and Pounder (Citation2000) highlight that environmental quality and physical appearance of an area are the main visible signs of commitment to change and improvement, which have a mutual relationship with economic transformation regarding quality of life and sense of belonging to an area. In other words, urban transformation projects are a kind of tool for applying strategic planning principles developed regarding sustainability phenomena at a city or a regional or a country scale. While the relationship between urban transformation and earthquake is largely underlined in the Turkish case, this is not a mandatory situation as well.
As mentioned above, in Turkey, the way of today’s interpretation of urban transformation is mostly formulated after the 1999 Kocaeli earthquake that struck the Marmara region. Since then, the probability of being earthquake-prone has been received as an unquestionable rationale that is hidden behind almost all urban transformation projects in Turkey. In this sense, areas that are vulnerable for earthquake became the subject of urban transformation.
Law no. 5998 (2010, an amendment to the Law no 5393) and Law no. 5366 (2005) support to increase the scope and number of urban transformation projects. The article 1 of Law no. 5998 states that to mitigate disaster risk, municipalities reach power to initiate urban transformation projects (Yönder & Türkoğlu, Citation2011). By Law no. 5366, the coalition of Housing Development Agency, municipalities and developers are responsible to regenerate gecekondu (a particular kind of unauthorised housing supply, a squatter’s house, means literally “overnight-built house” in Turkish) settlements and areas with high disaster risk. With such laws, urban transformation projects became one of the important ways of disaster mitigation in the case of Turkey (Yönder, Citation2006 cited in Türkoğlu & Kundak, Citation2010).
The Law on Disaster Prevention and Transformation of High Risk Areas (no. 6306) is implemented by regulation on the implementation of Law No. 6306 on restructuring of areas under risk of natural disasters dated 6 May and 15 December 2012, respectively. The first article of Law no. 6306 gives the main objective of this law as follows:
determining the principles and methods of improvement, liquidation and renewal geared towards the constitution of healthy and safe living spaces in line with scientific and aesthetic norms and standards in areas under disaster risk and in any high risk development.
The second article of Law no. 6306 on Disaster Prevention and Transformation of High Risk Areas defines high-risk areas, risky buildings and reserve development areas. While the methods for identification of such high-risk areas and the development of projects after demolition are outlined, the relationship between urban transformation projects and disaster management is still problematic. This law does not approach urban transformation process concerning social, economic and physical issues such as ecological sustainability, equity and quality of life – the unquestionable principles of urban planning. According to the Chamber of Urban Planners, Law no. 6306 penalises any objection to an imposed agreement on disaster prevention. And most of the initiated urban transformation projects reveal that disaster risk is used as a justification to legitimise urban transformation projects. Here, it is necessary to add that in Law no. 6306, the only disaster type is earthquake, and the others are not taken into account.
3. Case and method
3.1. Study area
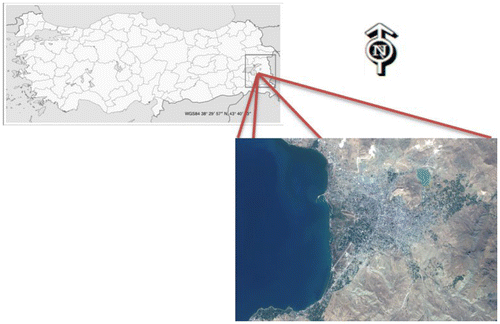
Van City, situated east of Anatolia, is one of the most important settlements in Turkey (Figure ). The city is settled near Van Lake, which is the largest catchment basin of Turkey. It covers 19.069 km2 and is centred at 42° 40′ and 44° 30′ E and 37° 43′ and 39° 26′ N. The city is surrounded by Doğubeyazıt, Diyadin and Hamur districts of Ağrı in the north; Van Lake and Patnos (Ağrı), Adilcevaz, Tatvan and Hizan districts of Bitlis in the west; Pervari district of Siirt, Beytüşşebap district of Şırnak and Yüksekova district of Hakkari in the south; and Iran in the east. The city has 11 districts, namely Bahçesaray, Baikale, Çaldıran, Çatak, Edremit, Erciş, Gevaş, Gürpınar, Muradiye, Özalp and Saray. Severe climate conditions are seen in the region, where summers are very hot while winters are too cold, rainy and long (Ministry of Forestry and Water Affairs Van Directorate [MFWAVD], Citation2007).
Figure 3. Location of the study area.
A disaster is a function of risk processes. It results from a combination of hazards, human vulnerability and insufficient capacity. Risk is defined as the expected losses, which may involve lives, personal injuries, property losses and economic disruptions due to particular hazards for a given area and reference period. For this reason, risk is the product of hazard, vulnerability and elements at this risk (World Meteorological Organization [WMO], Citation2002).
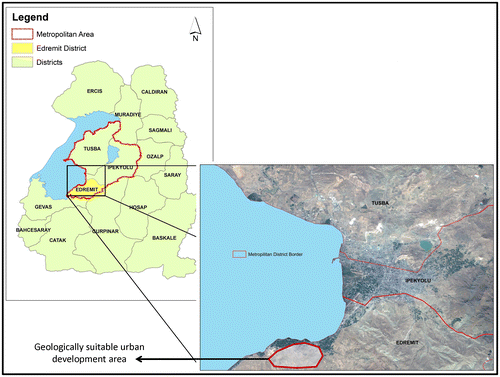
As explained in the earlier section, natural disaster risk process has two main components: hazards and human vulnerability issues. Van City shows a high vulnerable characteristic with regard to both of these components. About 90% of the existing built-up areas of the city is settled on the geologically unsuitable zones (CSB, 2012). According to the geological survey conducted after the Van earthquakes, only the southern parts (Edremit) of the city is defined as suitable for the new urban development (Figure ). In accordance with the findings of this research, Edremit district has been chosen as the main new development axis.
Figure 4. Locations of the metropolitan districts of the Van city and geologically suitable urban development area on the Edremit district.
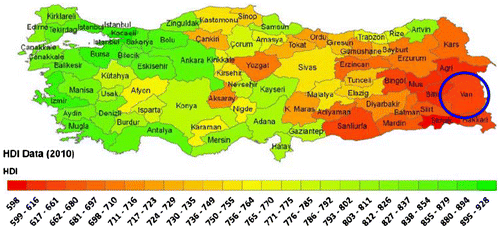
Considering the human vulnerability component of the Van City disaster risk process, the results of the second version of Human Development Index (HDI) approach prepared by UNDP could give very strong clues about the human vulnerability situation of the city. According to this study, Van City shares the worst places with its neighbouring provinces (Hakkari, Bitlis and Muş) in Turkey (Figure ). Basically, HDI is an index which is used to compare the human vulnerability situation of the cities, computed by the combination of three constituents, that is, literacy rate, life expectancy and GDP (per capita). The city of Van with .630 HDI value is below the average of HDI (.810) of Turkey and it is same as in less-developed zones like Bhutan, India and Congo (CEDIM Citation2011).
Figure 5. HDI of provinces in Turkey, showing one measure of coping capacity (CEDIM Citation2011).
3.2. Data
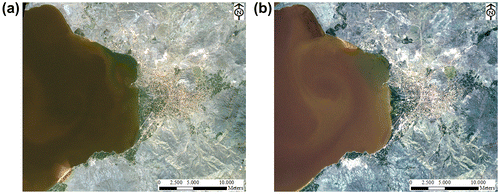
Two dates (before and after the earthquakes) of multiband RapidEye satellite images covering 500 km2 are utilised in the study. Acquisition dates of the images are 23 October and 9 November 2011 (Figure ). The images are obtained in clear sky conditions and of good quality. Processing level of the RapidEye images is level 3A, in which radiometric and sensor corrections are applied. The image has three visible bands, a near-infrared band and a red edged band. Spectral ranges of the bands are .44–.51 μm (blue), .52–.59 μm (green), .63–.685 μm (red), .69–.73 μm (red edge) and .76–.85 μm (near-infrared). In addition to the satellite images, a digital elevation map generated using 1:25 000 scale contour maps and an orthophoto product taken in 2011 are utilised to perform an orthorectification process of the images.
Figure 6. RapidEye images taken in (a) 12 September 2011 and (b) 8 June 2012.
4. Method
The following methodology of the study consists of four main steps: (1) pre-processing, (2) image classification, (3) accuracy test and (4) evaluation. Detailed explanation of each step is given below:
| (1) | Pre-processing The pre-processing of the data involves orthorectification and atmospheric correction steps. First, to perform the orthorectification processes, a digital elevation model with 5 m spatial resolution is produced by using the 1:25 000 scale digital contour maps. Next, the raster images are atmospherically corrected using ATCOR-3 module of PCI Geomatica to minimise possible atmospheric effects on the images. Then, orthorectification processes are performed by 10 well-distributed ground control points selected on the distinctive locations of orthophoto product (2011). In this way, new orthorectified images having 5m × 5m spatial resolution are produced. In the last step, quality of the orthoproducts is evaluated by computing root mean square (RMS) error. The error rates are calculated below ±.5 pixels for the two orthorectified data. In addition to the quantitative evaluations, the orthoimages are also evaluated visually by overlaying the existing orthophoto product. | ||||
| (2) | Image classification The corrected images are classified with the state-of-the-art MLC method after the pre-processing steps. The classification operations are performed on the images having 8 bit (0–255) radiometric resolutions. Before MLC application, a water mask is applied to improve the classification results and the results of MLC with four classes – bare land, road, agricultural area and built-up area – are then aggregated to two classes, built-up and others. The MLC method is based on Gaussian distribution and it assumes that each class is normally distributed on an image (Figure ). Thus, a great effort has been spent during the collection of training samples. The areas surrounded by lakes are digitised manually and masked out before the image classification operations. | ||||
| (3) | Accuracy test The produced thematic maps are then evaluated using error matrices. In this way, overall accuracy, kappa rate, producer’s and user’s accuracies are computed by comparing the thematic maps with the existing plans of the study site. The accuracy assessment process is performed with 250 random points stratified based on class percentages. The number of samples employed during the evaluation stage is determined based on binomial probability theory described in Jensen, Citation2005. In the evaluation process, same sample points are employed for the images to provide consistency between the results. | ||||
| (4) | Evaluation of the results Results indicate that the overall accuracies are computed over 80% for the images (Tables and ) The RapidEye image taken in 2011 provides marginal producer’s accuracy of about 55% for built-up areas, which means that of the 85 built-up pixels used for validation, 38 are omitted from this class and labelled as other category. Significant producer’s accuracy of 98% is computed for the other class. When the classification results are examined for the user’s accuracy level, it is indicated that promising results are obtained around 92% and 81% for the built-up and other areas, respectively. | ||||
Figure 7. Thematic maps of RapidEye data acquired in (a) 12 September 2011 and (b) 8 June 2012.
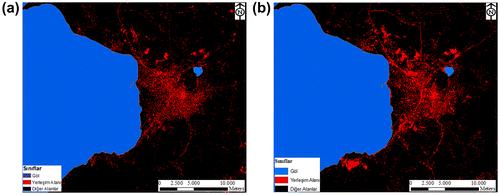
Table 2. Pixel-based classification results of RapidEye data taken in 2011.
Table 3. Pixel-based classification results of RapidEye data taken in 2012.
Similar classification results are achieved for the RapidEye image taken in 2012. The highest result, 93.63%, is computed for the other class in producer’s accuracy level. On the other hand, acceptable result of about 70% is provided for the built-up areas. The authors provide high user’s accuracy of built-up class and calculated as 87%. It means that of the total 75 built-up pixels, 65 are correctly classified as the same category on the ground. In terms of user’s accuracy level of the other classes, it is observed that 147 of 175 are included in other category and computed as 84%. According to the general results, it can be said that the accuracies computed for the Van City are efficient to analyse socio-spatial effect of the earthquake occurred in 23 October and 9 November 2011.
5. Results and discussion
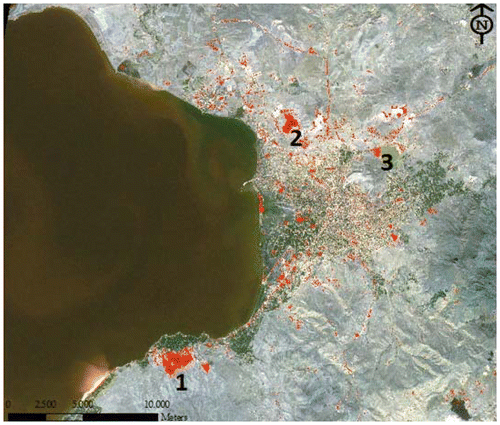
In Van City, the rationale behind urban transformation projects is to supply home (resident) to people who lost their home at recent earthquakes. However, the damaged areas in the city centre were not announced as urban transformation projects areas. ‘TOKİ-suburbs’ (Kamacı, Citationin review) were constructed in earthquake-resistant ground far from the existing built-up areas of the city (Figure ). Figure is prepared by subtracting thematic maps of classification results of 12 September 2011 and 8 June 2012 images. This subtraction map is overlaid with the RapidEye 2011 image to position the difference areas represented with orange colour. There are three main difference areas: Edremit TOKİ settlement (depicted with 1), Kalecik TOKİ settlement (depicted with 2) and Sıhke TOKİ settlement (depicted with 3). Other small difference areas could be occurred due to the seasonal difference of the utilised images, road constructions (Van City beltway under construction), debris of collapsed buildings in earthquake or destroyed buildings after earthquakes owing to its heavy damages and, last of all analysis, errors.
Figure 8. Difference map overlaid with the RapidEye image taken in 2011.
In this study, satellite images with high spatial resolution are utilised to find the effects of earthquakes on spatial transformation of the city; nevertheless, temporal, spatial and radiometric data assets potential of the RS should not only be used for physical dimensions of disaster management research but also be used for the social dimensions like vulnerability assessment or communication of defined risks. In this direction, we could easily adopt this finding to the urban transformation phenomena, because as repeated in different sections of the paper, urban transformation process is not limited to just a physical component. Social and economic dimensions constitute an obligation for a study directing for a holistic approach.
In some respect, these interventions dominate the form of the city regarding direction and density through opening unqualified areas to construction. However, the space-specific characteristics of urban transformation diversified the intervention types of the projects in the city. In Van, the aim of urban transformation projects is to develop TOKİ-suburbs with significant infrastructure problems at the hills surrounding the city.
6. Conclusion and future works
As is mentioned at the commencing of the paper, two devastating earthquakes occurred with a much closed time intervals and caused significant destruction on the city. After these two earthquakes, Van City entered into an intensive reconstruction process via urban transformation.
RS is one of the main constituents of the GITs, and these technologies are increasingly utilised by the SDSSs, utilised for entire disaster management cycle and commonly recognised as key support tools. In the study with the aim of identifying the effects of these two high-destructive earthquakes on spatial pattern of Van City, the RapidEye satellite images are analysed by RS. The results show that for the images, the overall accuracies are computed 80%. Spatial resolution of the RapidEye images is very sufficient for such a study aiming to find the general changes on urban macro form. After spatial resolution, another important characteristic of satellite images is temporal resolution. Temporal resolution in an urban transformation study could be expected lower than this work because urban transformation occurred in the long run, and to observe this, images were needed with high temporal intervals. In the case of Van, urban transformation has not arisen from a trend development of the city. As a result of natural disasters, rapid transformation has taken place through urban transformation projects. In this respect, temporally close images used to find the transformation/development pattern occurred as a result of the earthquakes in this study. The usage of images with close temporal interval causes seasonal difference of the images (fall for first image and summer for second image), hence naturally relatively a bit lower classification accuracies; this should not be overlooked when assessing the results.
All of three components (social, economic and environmental) of urban transformation process are vital to create livable environments. Taking the risk of repeating ourselves, it is necessary to mention that these components of urban transformation and of planning processes mainly have to be aimed for hazard mitigation to come up with sustainable and livable habitat, concerning local values.
The general results also reveal that the accuracies obtained are very promising to analyse spatial effect of the earthquakes on spatial transformation of Van City. The spatial transformation characteristic/pattern of Van concerning the earthquakes is analysed in the context of applied urban transformation. The identified findings of this analysis provide useful inputs to forthcoming researches aiming to evaluate the success level of those kinds of urban transformation processes.
Acknowledgement
This work was supported by the Yüzüncü Yıl University (Van/Turkey) under grant number 2013-MIM-B016
References
- Ambrosia, V. G., Buechel, S. W., Brass, J. A., Peterson, J. R., Davies, R. H., Kane, R. J., & Spain, S. (1998). An integration of remote sensing, GIS, and information distribution for wildfire detection and management. Photogrammetric Engineering and Remote Sensing, 64, 977–985.
- Bush, D. M., Neal, W. J., Young, R. S., & Pilkey, O. H. (1999). Utilization of geoindicators for rapid assessment of coastal-hazard risk and mitigation. Ocean and Coastal Management, 42, 647–670.10.1016/S0964-5691(99)00027-7
- Çabuk, A. (2001). A proposal for a method to establish natural-hazard-based land-use planning: The Adapazari case study. Turkish Journal of Earth Sciences, 10, 143–152.
- Cavallin, A., Floris, B., & Cerutti, P. (1995). GIS potential for regional and local scale groundwater hazard assessment. In A. Carrara & F. Guzzetti (Eds.), Geographical information systems in assessing natural hazards (pp. 259–272). Netherlands: Kluwer Academic.10.1007/978-94-015-8404-3
- CEDIM Forensic Earthquake Analysis Group. (2011). Comparing the Current Impact of the Van Earthquake to Past Earthquakes in Eastern Turkey (Report #4). Karlsruhe: Karlsruhe Instute of Technology.
- Cova, T. J. (1997). Modeling community evacuation vulnerability using GIS. International Journal of Geographic Information Science, 11, 763–784.10.1080/136588197242077
- Cutter, S. L., Mitchell, J. T., & Scott, M. S. (2000). Revealing the vulnerability of people and places: A case study of Georgetown County, South Carolina. Annals of the Association of American Geographers, 90, 713–737.10.1111/0004-5608.00219
- De Silva, F. N. (2001). Providing spatial decision support for evacuation planning: A challenge in integrating technologies. Disaster Prevention and Management: An International Journal, 10, 11–20.10.1108/09653560110381787
- De Silva, F., Pidd, M., & Eglese, R. (1993). Spatial decision support systems for emergency planning: An operational research/geographic information systems approach to evacuation planning. In J. Sullivan (Ed.), International Emergency Management and Engineering Conference, Society for Computer Simulation (pp. 130–133) San Diego, CA: Society for Computer Simulation.
- Düzgün, H. S. B., Yücemen, M. S., Kalaycıoğlu, H. S., Çelik, K., Kemec, S., Ertugay, K., & Yılmaz, N. (2011). An integrated earthqake vulnerability assessment framework for urban areas. Natural Hazards, 59, 917–947.10.1007/s11069-011-9808-6
- Fiedrich, F., Gehbauer, F., & Rickers, U. (2000, June). Optimized resource allocation for emergency response after earthquake disasters. Safety Science, 35, 41–57.10.1016/S0925-7535(00)00021-7
- Goodchild, M. F., & Glennon, J. A. (2010). Crowdsourcing geographic information for disaster response: A research frontier. International Journal of Digital Earth, 3, 231–241.10.1080/17538941003759255
- Hickey, R., & Jankowski, P. (1997). GIS and environmental decision making to aid smelter reclamation planning. Environment and Planning A, 29, 5–19.10.1068/a290005
- Huggel, C., Kääb, A., Haeberli, W., Teysseire, P., & Paul, F. (2002). Remote sensing based assessment of hazards from glacier lake outbursts: A case study in the Swiss Alps. Canadian Geotechnical Journal, 39, 316–330.10.1139/t01-099
- Iveynat, N., Uzun, N., & Kamacı, E. (in review). Urban regeneration project success and quality of life: The case of Şentepe. Habitat International.
- Jeffrey, P., & Pounder, J. (2000). Physical and environmental aspects. In P. Roberts & H. Sykes (Eds.), Urban regeneration (pp. 86–108). London: Sage.
- Jensen, J. R. (2005). Introductory digital image processing, a remote sensing perspective (3rd ed.). Upper Saddle River, NJ: Prentice Hall.
- Kaiser, R., Spiegel, P. B., Henderson, A. K., & Gerber, M. L. (2003). The application of geographic information systems and global positioning systems in humanitarian emergencies: Lessons learned program implications and future research. Disasters, 27, 127–140.10.1111/disa.2003.27.issue-2
- Kamacı, E. (in review). From Istanbul to TOK(I)stanbul. Habitat International.
- Kohiyama, M., Kroehl, H. W., Elvidge, C. D., Hobson, V. R., Hayashi, H., Maki, N., & Higashida, M. (2004). Early damaged area estimation system using DMSP-OLS night-time imagery. International Journal of Remote Sensing, 25, 2015–2036.10.1080/01431160310001595033
- Lanza, L., & Siccardi, F. (1995). The role of GIS as a tool for the assessment of flood hazard at the regional scale. In A. Carrara & F. Guzzetti (Eds.), Geographical information systems in assessing natural hazards (pp. 199–217). Dordrecht: Kluwer Academic Press.10.1007/978-94-015-8404-3
- Lindell, M., & Prater, C. (2003). Assessing community impacts of natural disasters. Natural Hazards Review, 4, 176–185.10.1061/(ASCE)1527-6988(2003)4:4(176)
- Lindell, M. K., Bolton, P. A., Perry, R. W., Stoetzel, G. A., Martin, J. B., & Flynn, C. B. (1985). Planning concepts and decision criteria for sheltering and evacuation in a nuclear power plant emergency. Bethesda, USA: National Environmental Studies Project, Atomic Industrial Forum. p. 202.
- Mathew, D. (2005). Information technology and public health management of disasters – A model for South Asian countries. Prehospital and Disaster Medicine, 20, 54–60.
- McKean, J., Buechel, S., & Gaydos, L. (1991). Remote sensing and landslide hazard assessment. Photogrammetric Engineering and Remote Sensing, 57, 1185–1193.
- Metternicht, G., Hurni, L., & Gogu, R. (2005). Remote sensing of landslides: An analysis of the potential contribution to geo-spatial systems for hazard assessment in mountainous environments. Remote Sensing of Environments, 98, 284–303.10.1016/j.rse.2005.08.004
- MFWAVD. (2007). 2006 Environmental Status Report for Van province. Van: Author.
- Ministry of Environment and Urbanization (CSB), Directorate General of Spatial Planning. (2012). Geological-Geotechnical Research Report for 1/1000 Scale Zoning Plan of Van District. Ankara: Author.
- Newsom, D. E., & Mitrani, J. E. (1993). Geographic information system applications in emergency management. Journal of Contingencies and Crisis Management, 1, 198–202.
- Pourvakhshouri, S. Z., & Mansor, S. (2003). Decision support system in oil spill cases (literature review). Disaster Prevention and Management: An International Journal, 12, 217–221.10.1108/09653560310480695
- Robert, V., Whitman, T., Anagnos, C. A., Kircher, H. J., Lagorio, R., Lawson, S., & Schneider, P. (1997, November). Development of a national earthquake loss estimation methodology. Earthquake Spectra, 13, 643–661.
- Roberts, P. (2000). The evolution, definition and purpose of urban regeneration. In P. Roberts & H. Sykes (Eds.), Urban regeneration: A handbook (pp. 9–36). London: Sage.
- Thomas, D. S. K., Ertugay, K., & Kemec, S. (2006). The role of geographic information systems/remote sensing in disaster management. In H. Rodriguez, E. L. Quarantelli, & R. Dynes (Eds.), Handbook of disaster research (pp. 83–96). New York, NY: Springer.
- Tralli, D. M., Blom, R. G., Zlotnicki, V., Donnellan, A., & Evans, D. L. (2005, June). Satellite remote sensing of earthquake, volcano, flood, landslide and coastal inundation hazards. ISPRS Journal of Photogrammetry and Remote Sensing, 59, 185–198.10.1016/j.isprsjprs.2005.02.002
- Tramutoli, V. (2007). Robust satellite techniques (RST) for natural and environmental hazards monitoring and mitigation: Theory and applications. International Workshop on the Analysis of Multi-temporal Remote Sensing Images, MultiTemp 2007, 1–6. Leuven, Belgium.10.1109/MULTITEMP.2007.4293057
- Tsai, C. H., Chen, C. W., Chiang, W. L., & Lin, M. L. (2008). Application of geographic information system to the allocation of disaster shelters via fuzzy models. Engineering Computations, 25, 86–100.10.1108/02644400810841431
- Turker, M., & San, B. T. (2003). SPOT HRV data analysis for detecting earthquake-induced changes in Izmit, Turkey. International Journal of Remote Sensing, 24, 2439, 2450. 12 p.10.1080/0143116031000070427
- Türkoğlu, H., & Kundak, S. (2010). Urban transformation as a tool for disaster management. In Proceedings of the 14th Conference on IPHS (International Planning History Society). Istanbul.
- WMO. (2002). Guide on public understanding and response to warnings. Geneva: WMO.
- Wood, N. J., & Good, J. W. (2004). Vulnerability of port and harbor communities to earthquake and tsunami hazards: The use of GIS in community hazard planning. Coastal Management, 32, 243–269.10.1080/08920750490448622
- Xuan, W., Chen, X., & Zhao, G. (2007, July 23–28). Early warning monitoring and management of disasters. In IEEE International Conference on Geoscience and Remote Sensing Symposium, IGARSS 2007 (pp. 2996–2999). Barcelona.10.1109/IGARSS.2007.4423475
- Yönder, A. (2006, November 7–12). Disaster mitigation or gentrification? Urban transformation projects in İstanbul. In The 47th Annual ACSP Conference, Forthworth, Texas.
- Yönder, A., & Türkoğlu, H. (2011). Post 1999 developments in disaster management in Turkey: The regulatory frameworks and implementation of land use planning for disaster risk reduction in İstanbul. Case study prepared for ISDR Global Assessment Report 2011.
- Zerger, A., & Smith, D. I. (2003). Impediments to using GIS for real-time disaster decision support. Computers, Environment and Urban Systems, 27, 123–141.10.1016/S0198-9715(01)00021-7
- Zook, M., Graham, M., Shelton, T., & Gorman, S. (2010). Volunteered geographic information and crowdsourcing disaster relief: A case study of the Haitian earthquake. World Medical & Health Policy, 2, 7–33. doi:10.2202/1948-4682.1069.