
Abstract
Segmentation, propagation, and linkage of normal faults often occur in regions of active extension, and observations of the distribution and structural properties of segment boundaries can provide important insights for seismic hazard assessment. In this study, we carry out quantitative geomorphological analysis to evaluate the relative tectonic activity along the Langshan Piedmont Fault (LPF), which bounds the NW margin of the Hetao Graben, North China. On the basis of obtained morphometric indices (HI, BS, Smf, VF, SLK, and χ), tectonic knickpoint heights, footwall topography, and small unmanned aerial vehicles (sUAV)-based field observations, we demonstrate that: (i) The Langshan landscape is in a state of disequilibrium in response to active rock uplift and channel incision; (ii) The LPF consists of two major fault segments with lengths of 65 and 95 km, respectively, which likely have been linked with each other; (iii) Rupturing of the whole of one segment can generate an earthquake of M w ~7.3–7.5, and earthquake magnitude may reach M w ~7.8 if the entire fault trace of ~160 km is ruptured, posing a significant seismic risk in the western Hetao Graben. These findings would further our understanding of normal fault evolution through space and time in actively extending regions.
1. Introduction
Fault segmentation commonly occurs in regions of active extension, and potential segment boundaries may act as barriers to inhibit rupture propagation, providing important insights into seismogenic behaviors of active normal faults (e.g. Crone & Haller, Citation1991; Ding, Citation1990; DuRoss et al., Citation2016; Ganas, Roberts, & Memou, Citation1998; Ganas et al., Citation2005a; Machette, Personius, Nelson, Schwartz, & Lund, Citation1991; Schwartz & Coppersmith, Citation1984; Swan, Schwartz, & Cluff, Citation1980; Zhang, Mao, & Slemmons, Citation1999; Zhang, Slemmons, & Mao, Citation1991). Nevertheless, due to stress feedback between adjacent fault arrays, fault segments tend to grow laterally and hence become linked with each other (Cowie, Citation1998; Cowie & Roberts, Citation2001). Therefore, studies with aim to demonstrate normal fault evolution scenarios (segmentation and linkage) have substantial implications for seismic hazard assessment. However, there exists a general lack of high-resolution paleoseismic data to unravel detailed rupture history along the whole fault trace. As a consequence, topographic expressions associated with active normal faulting have often been utilized to evaluate tectonic activity, such as fault-generated scarps (e.g. Bubeck et al., Citation2015; Ganas, Palvides, & Karastathis, Citation2005b; Ganas et al., Citation2004; He, Wei, & Densmore, Citation2016; Rao, Lin, Yan, Jia, & Wu, Citation2014), and triangular facets (e.g. DePolo & Anderson, Citation2000; Petit et al., Citation2009; Rao, Cheng, Yu, Yan, & Lin, Citation2017; Topal, Keller, Bufe, & Koçyiğit, Citation2016; Tsimi & Ganas, Citation2015). Because active deformation also affects rock uplift and channel incision processes (Attal, Tucker, Whittaker, Cowie, & Roberts, Citation2008; Cowie et al., Citation2006; Keller & Pinter, Citation2002), the morphological features of channel longitudinal profiles (e.g. Amato et al., Citation2017; Kirby & Whipple, Citation2001; Pavano, Pazzaglia, & Catalano, Citation2016; Snyder, Whipple, Tucker, & Merritts, Citation2000; Wobus et al., Citation2006) and footwall landscape (e.g. Ferrarini et al., Citation2017; Kent, Boulton, Stewart, Whittaker, & Alçiçek, Citation2016; Roda-Boluda & Whittaker, Citation2018; Whittaker & Walker, Citation2015) have also been used to detect active structures. Moreover, benefiting from the progress in geographic information system (GIS) techniques and the globally covered Digital Elevation Models (DEMs), morphotectonic indices can be accurately acquired to quantitatively and efficiently evaluate the relative tectonic activity in a given region (e.g. Bagha et al., Citation2014; Cheng et al., Citation2018; Delcaillau et al., Citation1998, 2010; El Hamdouni, Irigaray, Fernández, Chacón, & Keller, Citation2008; Gao, Zeilinger, Xu, Wang, & Hao, Citation2013; Giaconia et al., Citation2012; Matoš, Pérez-Peña, & Tomljenović, Citation2016; Menier et al., Citation2017; Özkaymak, Citation2015; Pedrera, Pérez-Peña, Galindo-Zaldívar, Azañón, & Azor, Citation2009; Pérez-Peña, Azor, Azañón, & Keller, Citation2010; Wu, Xiao, & Yang, Citation2014; Yildirim, Citation2014).
The continental rifts characterized by active normal faults around the tectonically stable Ordos Block in China ((a)), provide excellent chances to investigate tectonic characteristics and geomorphology in actively extending regions (e.g. Deng, Citation2007; Deng & Liao, Citation1996; Dong, Zhang, Zhang, Zheng, & Chen, Citation2018a; Dong et al., Citation2018b; He, Ma, Long, Wang, & Zhang, Citation2018; Jiang, Xiao, & Xie, Citation2000; Rao, Chen, Hu, Yu, & Qiu, Citation2016; Rao, Lin, & Yan, Citation2015; Zhang, Jia, Wang, & Zheng, Citation1985; Zhang, Yang, Zhong, & Mi, Citation1995; Rao et al., Citation2014, Citation2017, 2018; State Seismological Bureau [SSB], Citation1988; Xu, Ma, & Deng, Citation1993; Zhang, Mercier, & Vergély, Citation1998). In contrast to other rift-border faults with earthquakes of M ≥7, there is an obvious lack of historical records about strong earthquakes along the Langshan Piedmont Fault (LPF) bounding the northwest margin of the Hetao Graben (Figures and ). However, existing paleoseismic data demonstrate that the ~160-km-long LPF has been active during the Holocene and is capable of generating ground-rupturing earthquakes (Dong et al., Citation2018b; Li, Ran, Chen, Wu, & Lei, Citation2015; Rao et al., Citation2016, 2018; SSB, Citation1988). But, it remains unclear whether this major basin-bounding fault moves simultaneously as a whole, or consists of several segments with distinct rupture histories. To date, only few studies on individual geomorphic indices have been carried out (e.g. Dong et al., Citation2018a; Liu et al., Citation2016), systematic morphotectonic analysis indicative of the level of tectonic activity in the Langshan region is still lacking.
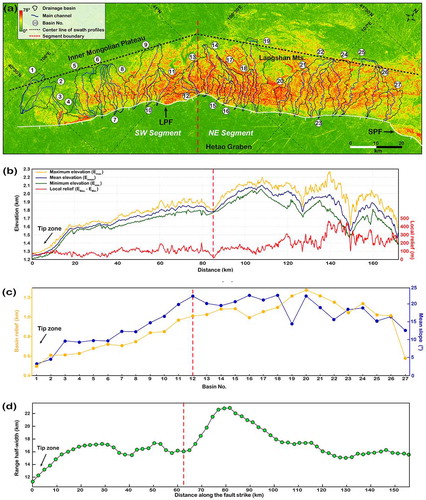
Figure 1. Geological background and topographic features of the Langshan region. (a) Historical seismicity characterizes the graben basins around the Ordos Block. Epicenters of large-magnitude earthquakes and major active faults are modified from Deng (Citation2007). Focal mechanism solutions are acquired from the Global Harvard CMT Catalog (http://www.globalcmt.org/CMTsearch.html). (b) Inset map showing the tectonic background. (c) 27 drainage basins and their main streams extracted in ArcGIS are draped over color-shaded relief map.
Notes: Small earthquake records are acquired from China Earthquake Networks Center (China Earthquake Networks Center (CENC), Citation2017). ATF, Altyn Tagh Fault; HYF, Haiyuan Fault; KLF, Kunlun Fault; GZ-YSF, Ganzi-Yushu Fault; LMS, Longmenshan; LPF, Langshan Piedmont Fault; NCC, North China Craton; SCB, South China Block; SPF, Sertengshan Piedmont Fault
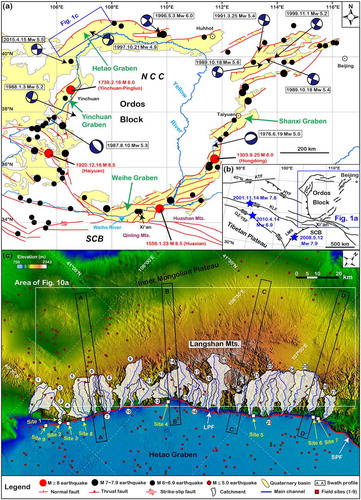
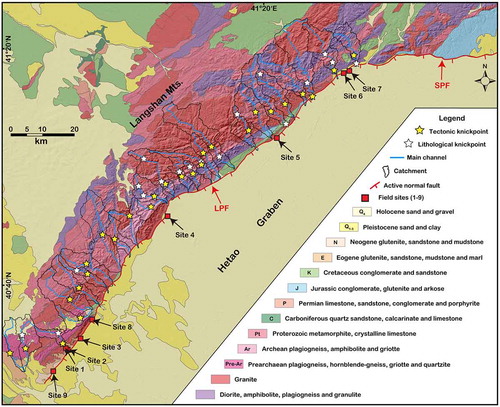
Figure 2. Simplified geological map draped over hillshade map, showing the distribution of lithological units and major active faults in the western Hetao Graben (modified after Geological Team of Inner Mongolia (GTIM), Citation1981).
Note: LPF, Langshan Piedmont Fault; SPF, Seertengshan Piedmont Fault.
In this study, we integrate the morphometric characteristics of drainage basins, channel long-profiles and range-fronts with the features of tectonic landforms mapped from small unmanned aerial vehicles (sUAV)-acquired DEMs during field surveys, to evaluate the relative tectonic activity along the LPF. As a result, we demonstrate the segmentation and likely linkage of this major fault, and discuss seismic potentials in the study area. Meanwhile, the results of this study would be helpful in better understanding structural evolution of active normal faults through space and time.
2. Regional setting
The NE-trending Langshan Mountains in North China are bounded by the Inner Mongolian Plateau to the northwest and the Hetao Graben to the southeast, respectively (). The latter is one of the seismically active graben systems around the tectonically stable Ordos Block consisting of pre-Mesozoic basements (Deng, Citation2007; SSB, Citation1988). In the Cenozoic, crustal extension prevails and has rebuilt the Late Mesozoic Langshan orogenic belt, resulting in the development of a series of normal faults along the range-front and piedmont, as well as the subsidence and thick sediments of the Hetao Graben (SSB, Citation1988; Sun, Hu, & Niu, Citation1990; Zhang et al., Citation1998). In the study area, the exposed strata include the Pre-Archean, Archean and Proterozoic granite, diorite, amphibolite, plagiogneiss and granulite, Jurassic breccias and Cretaceous gravels, and Paleogene to Quaternary deposits composed of diluvial, alluvial, and lacustrine sediments along the piedmont and valleys ().
The LPF is a Holocene active fault dominated by normal slip, which develops along the contacts between bedrocks and Quaternary sediments, and within the sediments with an average dip of 60° (SSB, Citation1988; Li et al., Citation2015; Rao et al., Citation2018). The estimated vertical slip rates (throw rates) of ~0.5–2.2 mm/yr based on relative chronology of tectonic landforms are with significant uncertainties due to the general lack of precise age constraints (Deng, Cheng, Min, Yang, & Ren, Citation1999; Huang, Zhang, Li, Liu, & Feng, Citation2012; Rao et al., Citation2018). The fault strike changes near its center from ~N35°E to the southwest to ~N50°E to the northeast (Figures (c)) and ). Even if there is no recorded earthquake of M ≥ 7 in the western Hetao Graben ((a) and (c); China Earthquake Networks Center [CENC], Citation2017; Deng, Citation2007; SSB, Citation1988; Wen, Citation2014), recent paleoseismological investigations demonstrated that ground-rupturing earthquakes have occurred on this fault during the Holocene with average recurrence interval of ~2450–2500 years (Dong et al., Citation2018b; Li et al., Citation2015; Rao et al., Citation2016, Citation2018), and some of them likely had ruptured the whole fault trace (Dong et al., Citation2018b).
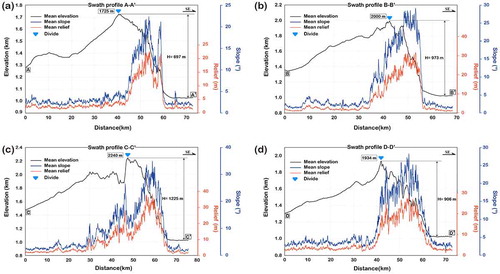
Topographically, the high relief and steepness on the southeastern flank of the Langshan Mountains are in contrast to the gentler slopes on its northwestern flank as revealed by the 5-km wide ridge-perpendicular swath profiles (). The range height, relief, and mean slope increase from SW to NE, reach the maximum values on the profile C–C’, and slightly decrease adjacent to the Seertengshan Mountains (). Based on the optically stimulated luminescence (OSL) dating of river terraces in the Langshan area, Jia et al. (Citation2015) demonstrated that uplift was uneven between ~58 and 42 ka, being faster in the central and northeastern portions, whereas it became almost constant in space after ~32 ka.
Figure 3. 5-km-wide swath topographic profiles of four selected transects showing landscape topography across the Langshan Mountains.
Notes: Steep slopes and high reliefs characterize the southeastern flank. The swath profiles are all constructed with sampling interval of 100 m using the SwathProfiler, an ArcGIS add-in shared by Pérez-Peña et al. (Citation2017). The relief values are calculated using a sampling circular window of 30 m. Locations are shown in (c).
3. Study methods
DEM-based morphotectonic analysis was carried out in order to identify tectonic signals from landscape topographic features of the Langshan Mountains. Firstly, channel networks were extracted from 90-m spatial resolution Shuttle Radar Topography Mission (SRTM) DEMs using ArcGIS ArcHydro Tools. As a result, 27 drainage basins of >28 km2 and their main channels have been acquired. Then, morphometric indices and their distribution features were analyzed to explore first-order along-strike variations of resulting structures. In particular, we utilized the CalHypso Tools developed by Pérez-Peña, Azañón, and Azor (Citation2009a) to obtain hypsometric curves and hypsometric integral (HI) values. Geological information was also compiled to decipher the effect of lithological contrasts on shapes of channel longitudinal profiles. Consequently, major lithological and tectonic knickpoints are mapped and differentiated. In addition, we carried out field surveys to verify the results of our geomorphological analysis. Combining with the obtained SLK values interpolated using kriging method (Pérez-Peña, Azañón, Azor, Delgado, & González-Lodeiro, Citation2009b), the Langshan topography (relief, slope, and width) and drainage Chi (χ) values (Perron & Royden, Citation2013; Royden & Perron, Citation2013; Willett, McCoy, Perron, Goren, & Chen, Citation2014; Yang, Willett, & Goren, Citation2015), we demonstrated the tectonic activity and segmentation behaviors of the LPF. In this study, swath topographic profiles were built using the SwathProfiler, an ArcGIS add-in shared by Pérez-Peña et al. (Citation2017).
3.1. Hypsometric curves and hypsometric integral (HI) values
The shapes of hypsometric curves usually reflect distinctive stages of topographic development of drainage basins in terms of equilibrium between relief building forces and erosion processes ((a)): convex, sigmoidal, and concave shapes for youthful, mature, and older basins, respectively. The HI index describes the relative volume that has not been eroded (Schumm, Citation1956; Strahler, Citation1952), and is defined as the area below a hypsometric curve ((b); Alipoor, Poorkermani, Zare, & El Hamdouni, Citation2011; Mayer, Citation1990; Pike & Wilson, Citation1971):
Figure 4. Schematic diagrams showing the morphometric indices applied in this study (modified from Keller and Pinter (Citation2002), Özsayın (Citation2016) and references therein): (a) hypsometric curve. (b) hypsometric integral (HI). (c) drainage basin shape (BS). (d) mountain front sinuosity (Smf). (e) ratio of valley floor width to valley height (VF). (f) normalized stream-length gradient (SLK).
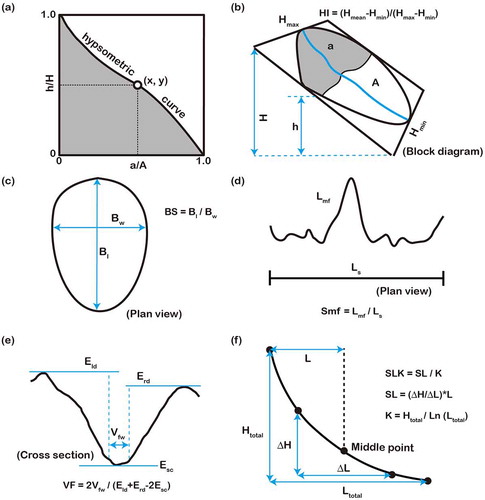
In general, higher HI values often correlate with a younger topography that might be affected by active tectonics, and lower HI values reflect an older landscape that have been eroded for a long time and hence seldom influenced by recent tectonism. Accordingly, it has been widely used to evaluate the level of tectonic activity in a specific region (e.g. Alipoor et al., Citation2011; Mahmood & Gloaguen, Citation2012; Ntokos, Lykoudi, & Rondoyanni, Citation2016; Wu et al., Citation2014).
3.2. Drainage basin shape (BS)
The shape of a drainage basin may also record the influence of tectonic processes. In general, significant elongation in basin shape characterizes active tectonic regions, while sub-circular basins are indicative of the lack of active structures or the decrease of deformation rate (Bull & Mcfadden, Citation1977). The BS index describes the elongation ratio of a drainage basin and is expressed as follows ((c); Cannon, Citation1976):
where B l is the straight-line distance from headwater to mouth, and B w is the maximum width of a drainage basin. As a consequence, higher BS values reveal more elongated basins.
3.3. Mountain front sinuosity (Smf)
The Smf index reveals the sinuosity of mountain fronts, reflecting the balance between the stream erosion processes that tend to create sinuous mountain fronts, and the active vertical motions that tend to produce straight mountain fronts ((d); Bull & Mcfadden, Citation1977; Keller, Citation1986). It was defined by Bull (Citation1978) as:
where L mf and L s are the real and straight-line lengths of a mountain front, respectively. Thus, lower Smf values often respond to higher tectonic activity. Previous investigations (e.g. Selçuk, Citation2016; Silva, Goy, Zazo, & Bardaji, Citation2003) divided the Smf values into three classes: Class 1 (1.0 ≤ Smf <1.5; with an inferred slip rate of >0.5 mm/yr); Class 2 (1.5 ≤ Smf <2.5); and Class 3 (2.5 ≤ Smf; with an inferred slip rate of <0.05 mm/yr).
3.4. Ratio of valley floor width to valley height (VF)
The VF index describes the shape of a valley cross section, and is defined as the ratio of the width of a valley floor to its average height ((e); Bull & Mcfadden, Citation1977; Bull, Citation1978). It is expressed as:
where V fw is the average width of a valley floor; E ld and E rd are the elevations of the divides on the left and right sides of the valley, respectively; Esc is the average elevation of the valley floor. In general, steep and narrow (V-shape) valleys (VF ≤ 1) indicate relatively high uplift rates, and flat-floored (U-shaped) valleys (VF >1) reflect relatively low uplift rates (Bagha et al., Citation2014; Keller, Citation1986; Keller & Pinter, Citation2002; Özsayın, Citation2016). However, their shapes may significantly change if measured at different locations along the stream channels (Ramirez-Herrera, Citation1998). Therefore, the VF values have often been measured within a given distance upstream from catchment outlets, facilitating the comparisons among different stream channels (Mahmood & Gloaguen, Citation2012; Silva et al., Citation2003). Considering the drainage basin sizes of the study area (), the distances of ~0.5–1.0 km from catchment outlets were chosen.
Table 1. Morphometric parameters of the drainage basins in the study area.
3.5. Normalized stream-length gradient (SLK)
The gradient of a stream channel results from a long-period (104–106 years) adjustment between the erosion and the tectonism (Demoulin, Citation2011; Hack, Citation1973; Pizzuto, Citation1992). Hack (Citation1973) defined the stream-length gradient (SL) as:
ΔH / ΔL is the average gradient of an evaluated channel segment, and L is the total length from the divide to its midpoint ((f)). SL is sensitive to the variations of rock uplift rates, lithology, climate, and hydrology; high SL values often reflect high tectonic activity and/or high rock resistance (Azor, Keller, & Yeats, Citation2002; Brookfield, Citation1998; Font, Amorese, & Lagarde, Citation2010; Hack, Citation1973). In order to eliminate the influence of channel length, a normalized stream-length gradient (SLK) index is defined (Chen, Sung, & Cheng, Citation2003; Pérez-Peña et al., Citation2009b), and follows the equations:
where K is a parameter representing the SL index calculated for the entire channel, H total and L total are the altitude difference and length of the entire channel, respectively ((f)). Perturbations of SLK often reveal river channel response to lithological contrasts and/or ongoing tectonism (Pérez-Peña et al., Citation2009b). Accordingly, SLK has often been used to assess tectonic activity in regions where rock resistance differences are negligible (e.g. Monteiro, Missura, & Correa, Citation2010; Wu et al., Citation2014). Major knickpoints or knick zones can be identified from channel gradients of river long profiles. As well, tectonic-controlled knickpoint heights together with range topographic features are helpful for deciphering fault evolution history (e.g. Boulton & Whittaker, Citation2009; Kent, Boulton, Whittaker, Stewart, & Alçiçek, Citation2017; Whittaker & Boulton, Citation2012).
3.6. Chi (χ) analysis
The parameter χ is sensitive to the loss of drainage area and disequilibrium across drainage divides (Perron & Royden, Citation2013; Royden & Perron, Citation2013; Willett et al., Citation2014; Yang et al., Citation2015). Since χ removes the effect of drainage area, it can be compared among catchments of different sizes. Theoretically, water divides tend to move away from channels with low χ values towards channels with high χ values (Willett et al., Citation2014). Construct of χ map follows a specific protocol, and high resolution DEMs if available have often been used (Willett et al., Citation2014). We firstly extracted hydrological information (flow direction, flow length, and flow accumulation) in ArcGIS Spatial Analysis Tools from 30-m spatial resolution Advanced Spaceborne Thermal Emission and Reflection Radiometer Global Digital Elevation Model (ASTER GDEM) data (the highest resolution now available for us), a joint product of the Ministry of Economy, Trade, and Industry (METI) of Japan and the United States National Aeronautics and Space Administration (NASA). Then, in combination with a Matlab script shared by Sean Willett, χ values of each streams were calculated with a reference concavity of 0.45, and a critical area of 0.5 km2 to define the threshold for the minimum contributing upstream drainage area.
4. Results
4.1. Morphotectonic indices
In the study area, 18 of the total 27 hypsometric curves of drainage basins are convex in shape, and the other 9 are sigmoidal (). The obtained HI values range from 0.42 (basin No. 27) to 0.69 (basin No. 6), with an average value of 0.56 ((a); ). BS values of the selected drainage basins vary from 1.51 (basin No. 12) to 6.86 (basin No. 17) ((b); ). The Smf values range from 1.04 (basin Nos.1, 2, and 17) to 1.35 (basin Nos. 12–14) ((c); ). Among them, some neighboring drainage basins share the same Smf values. Even if the values of the basins (Nos. 12–14) near the fault center are higher, they are still <1.5, and hence can be categorized into Class 1 as described previously (). The acquired VF values are between 0.18 (basin No. 19) and 1.30 (basin No. 4) ((d); ). Except for few relatively higher values measured near fault tips (Nos. 1, 2, and 4 in the southwest, and No. 27 in the northeast), most of them are <1. The large-scale convexity of channel longitudinal profiles combined with the abnormally high SLK values demonstrate the development of knickpoints or knickzones (). Specifically, some of them are situated at lithological contacts, i.e. lithological knickpoints as shown in , which are excluded in the subsequent analysis. Non-lithological knickpoints markedly change their heights along the trend of the Langshan Range, ranging from 39 m to 392 m (). The along-strike variations are also prominent in map view of SLK values: the highest in basin Nos. 5–8 and the lowest in basin Nos. 12 and 27 (). The obtained χ map reveals obvious differences across the main water divides, i.e. the channels on the northwestern side are with higher values than that on the southeastern side (), suggesting that the river networks draining the Langshan Mountains are in a disequilibrium state and need to adjust their drainage area through divide migration or river capture to bring the divide to a stable position (Willett et al., Citation2014).
Figure 5. Hypsometric curves of the 27 drainage basins (1–27 from southwest to northeast).
Notes: The obtained curves are convex- or S-shaped. The hypsometric curves and integral (HI) values ((a)) were acquired by using the CalHypso Tools, an ArcGIS add-in developed by Pérez-Peña et al. (Citation2009a).
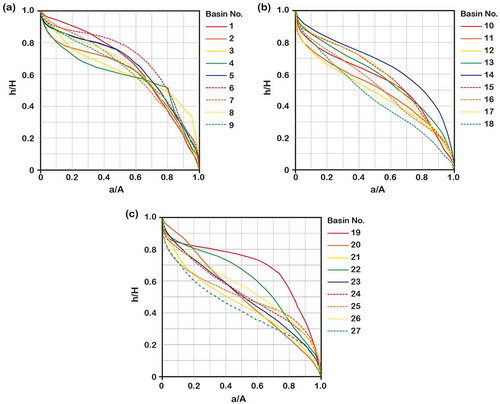
Figure 6. The values of morphometric indices: (a) HI. (b) BS. (c) Smf and (d) VF.
Notes: Note the drainage basin No. 12 near the center of the LPF with lower tectonic activity evidenced by lower HI and BS values, and higher Smf and VF values. The red dotted lines delimit the probable segment boundary.
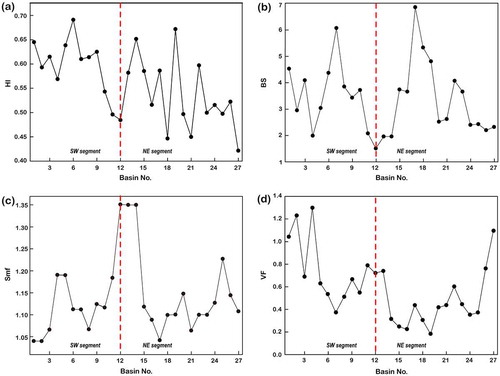
Table 2. The values of geomorphic indices and parameters used for calculation
Figure 7. Channel longitudinal profiles and corresponding SLK values.
Notes: The lithology on the profile is extracted from the geological map in . The knickpoints at Sites 1 and 2 marked on the profile R3 are shown in .
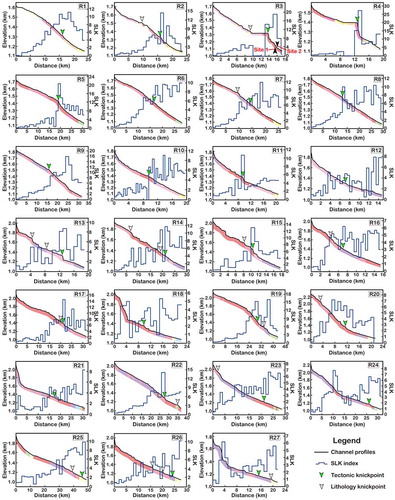
Figure 8. Distribution of major non-lithological knickpoint heights of each catchments above the LPF, ranging from 39 to 392 m.
Note: The red dotted lines delimit the probable segment boundary.
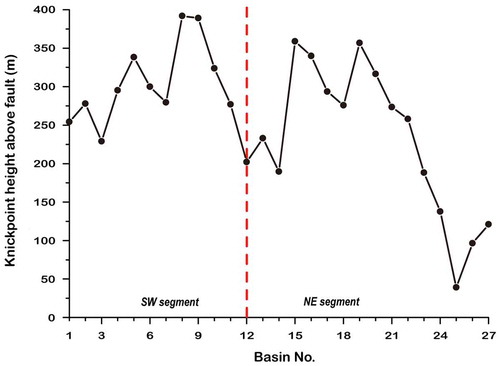
Figure 9. Map view of SLK values of the study area interpolated using the Kriging method (Pérez-Peña et al., Citation2009b).
Notes: High values are mostly concentrated near the catchment outlets, demonstrating the landscape topography affected by the active deformation along the Langshan range front and piedmont.
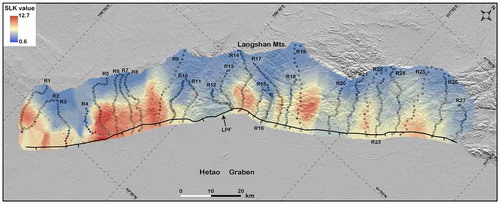
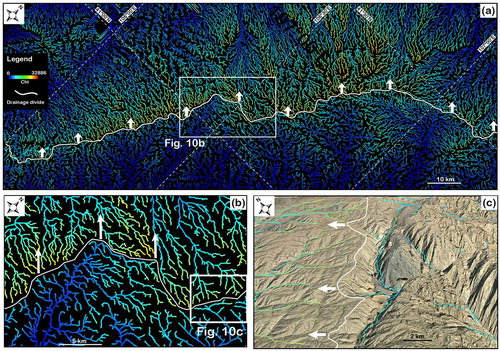
Figure 10. Distribution of color-coded streams with χ (chi) values. The differences indicate that drainage divides in the study area tend to migrate from the channels with lower values northwestwards to that with high values. (a) Map view. (b) Close-up view. (c) Perspective view of the χ values draped over Google Earth image.
4.2. Tectonic landforms
To validate the results of our morphotectonic analysis, field surveys were also carried out along the southeastern flank of the Langshan range, where pronounced tectonic landforms have been observed.
At Sites 1 and 2 along a southeast-flowing river (R3 in ), two knickpoints identified from stream long profile have been observed in the field with throw heights of ~2–4 m (). Considering the same rock type (granite) crops out both up- and downsides of the knickpoints, their formation is attributed to tectonic uplift rather than differential rock resistances. Sites 3–9 situated along the Langshan piedmont provide evidence of active deformation along the LPF. At site 3, a NE-trending scarp can be clearly recognized from the hillshade DEM with a resolution of ~0.12 m constructed from sUAV-acquired photos using structure-for-motion techniques ((a)). The scarp is estimated to be ~13.7 m in height from DEM-based topographic profile ((b)). Besides the mapped fault scarp, a bedrock fault plane dipping to the southeast has also been observed in the field ((c) and (d)). Site 4 is situated near the center of the LPF, where two identified fault traces are nicely displayed by a panoramic photo (view to the northwest) ((a)). Near the Langshan range front, striations on bedrock fault plane demonstrate a dominant normal slip-sense ((b) and (c)), which are consistent with previous field observations (Rao et al., Citation2018). Along the piedmont, sUAV-acquired DEMs and associated topographic profiles indicate that the fault-generated scarps at this site range in height from 3.7 to 14.9 m ().
Figure 11. Field observations of knickpoints at Sites 1 and 2 along an active channel (R3 in Figure 7). The man with a 2-m tape for scale.
Note: See Figures (c) and for the locations.
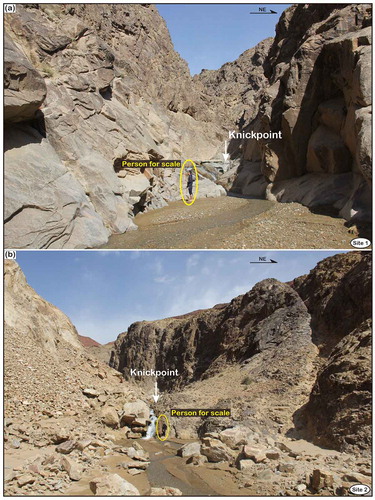
Figure 12. Scarp and fault outcrop at Site 3 in the southeastern segment. (a) DEM hillshade map generated from small unmanned aerial vehicles (sUAV)-acquired photos using structure-for-motion techniques. (b) DEM-based topographic profile revealing the scarp height of ~13.7 m. (c) Bedrock fault plane dipping to southeast observed in the field. Location is shown in Figures (c) and .
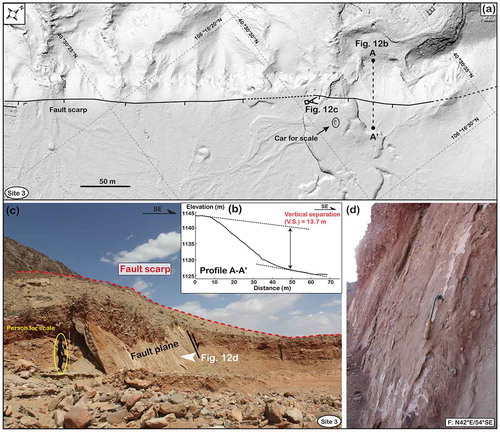
Figure 13. Tectonic landforms at Site 4 near the center of the LPF (see Figures (c) and for the location). (a) Panoramic photograph showing the distribution of two sets of fault scarps. (b) Bedrock fault plane. (c) Observed striations demonstrating a dominant normal slip.
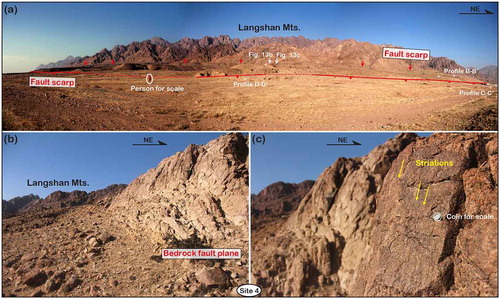
Figure 14. Topographic features across the fault scarp observed in Figure 13. (a) sUAV-acquired DEM highlighting the topographic features. (b) DEM-based topographic profiles across the fault trace demonstrate vertical separations range from 3.7 to 14.9 m.
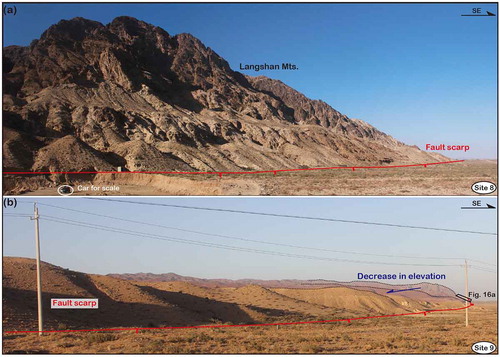
Further northeast, both escarpments and small scarplets generated by faulting have been observed at Site 5 ((a)), and the latter was likely associated with single earthquake event. At site 6, three levels of river terraces (T1–T3) are formed ((b)), where higher terraces have larger displacements, indicating slip accumulation along the fault. Meanwhile, fault scarps are also pronounced near both fault tips. Near the northeast extremity, prominent scarps were observed at Site 7 ((c)). In the southwest, although the Langshan range progressively decreases in elevation, fault scarps can still be traced in the field ().
Figure 15. Field photos at Sites 5–7 (see Figures (c) and for the locations). (a) Fault scarps observed at Site 5 in the northwestern segment. The observed small scarplets were probably produced by recent earthquake event(s). Fault scarps have also been observed near the northwestern extremity: (b) Site 6. (c) Site 7. Note that higher level of river terraces have higher fault scarps, indicating slip accumulation at Site 6.
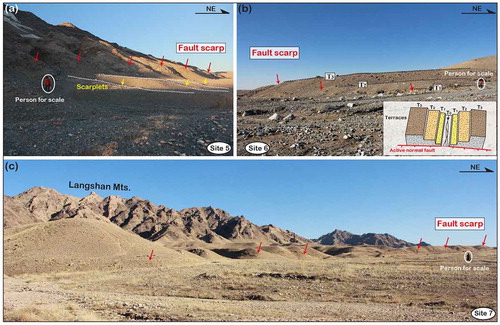
Figure 16. Fault scarps observed near the south tip of the LPF: (a) Site 8. (b) Site 9.
Notes: Although the range decreases in elevation, fault scarps still can be traced in the field. Locations are shown in Figures (c) and .
5. Discussion
All the obtained hypsometric curves are convex- and S-shaped with high HI values (average value of 0.56; Figures and (a)), indicating that drainage basins are with low to intermediate maturity (El Hamdouni et al., Citation2008; Keller & Pinter, Citation2002; Pérez-Peña et al., Citation2009a). It is consistent with the observed transient rivers containing both tectonic and lithological controlled knickpoints as revealed by the channel longitudinal profiles and associated SLK values (Figures and ). The Langshan topographic features (relief and slope steepness; ) combined with χ values () suggest that water divides tend to migrate from the steep southeastern flank towards the gentler northwestern flank. Accordingly, the drainage networks in the Langshan Mountains are in disequilibrium state probably in response to active rock uplift and channel incision. This inference is supported by the dominant V-shaped valleys in elongated drainage basins suggestive of intensified incision ((b) and (d)). Nevertheless, the obtained major channel gradients with high SLK values are mostly concentrated near catchment outlets (), suggesting the landscape topography is mostly affected by recent deformation along the range fronts that have low Smf values (<1.4; (c)). The tectonic activity of this basin-bounding fault inferred from geomorphological analysis is also verified by the widespread fault scarps mapped in the present (Figures –) and previous active tectonic studies (Dong et al., Citation2018b; SSB, Citation1988; Li et al., Citation2015; Rao et al., Citation2016, 2018).
However, along-strike variations of the tectonic activity are also pronounced as revealed by the fluctuations of obtained morphometric indices (; ). In combination with the Langshan landscape topography (), two major fault segments (SW and NE, respectively) have been designated with a boundary approaching the drainage basin No. 12 based on the following observations: (1) changes of the range front and fault trends from ~N35°E in the southwest to ~N50°E in the northeast, serving as a geometric boundary (DuRoss et al., Citation2016; Machette et al., Citation1991; Manighetti et al., Citation2015; Zhang et al., Citation1991); (2) tectonic activity is higher in the centers of each segments (as delineated by the high HI, BS, and SLK values, and low Smf and VF values), and bilaterally decreases towards their tips (Figures and ), demonstrating a general bell-shape in each segments; (3) distribution of major non-lithological controlled knickpoint heights that probably mirrors the trends in the total throw and footwall relief (e.g. Kent et al., Citation2017), demonstrates the same tendency (); (4) footwall local relief resembles the maximum, mean, and minimal elevations on the 5-km-wide ridge-parallel swath profiles ((b)), which reflects different footwall landscapes (higher and steeper in the northeast segment) if considered as a proxy of fault throw (e.g. Densmore, Dawers, Gupta, Guidon, & Goldin, Citation2004; Kent et al., Citation2016; Whittaker & Walker, Citation2015); (5) the contrasting basin relief and mean slope indicative of differential channel incision, being higher in the northeast segment ((c)); (6) variable range half-widths, being wider in the northeast segment ((d)), which together with mountain reliefs reflect the geometry and spacing of the resulting faults if there is no significant change of base level on either side of the range (Densmore, Dawers, Gupta, & Guidon, Citation2005).
Figure 17. Along-strike topographic variations along the Langshan Mountains. (a) Slope map. (b) 5-km-wide ridge-parallel swath profiles (The central line is shown in (a)). (c) Relief and mean slope of each drainage basins. (d) Range half-width.
Note the abrupt changes near the drainage basin No. 12.
Segment boundaries may play significant roles in perturbing or arresting earthquake rupture, whereas large earthquake is still able to rupture smaller structural discontinuities (Zhang et al., Citation1999). Due to stress feedback between adjacent fault arrays, they might finally become linked with each other (Cowie, Citation1998; Cowie & Roberts, Citation2001). Combining with existing data, the recent paleoseismic study by Dong et al. (Citation2018b) demonstrated that three Holocene earthquakes might have ruptured the entire fault trace, indicating the linkage of fault segments in terms of rupture behaviors. This scenario likely has been recorded by river incision processes, as the rates previously were uneven in the Langshan area but became spatially constant after ~32 ka (Jia et al., Citation2015). Nevertheless, due to the lack of historical records of earthquakes in the study area and the uncertainties of age constraints, we suggest that future work is still needed to determine whether the demonstrated earthquakes occurred as temporal clustering, or could be correlated as the same event (McCalpin & Nishenko, Citation1996; Rockwell et al., Citation2000). More precisely determined fault slip rates on multiple time scales together with complete rupture histories of each segments would further our understanding of structural evolution of this fault.
As the LPF can be categorized into two major fault segments with lengths of ~65 km and ~95 km, respectively, seismic potentials of the Langshan and neighboring regions can be evaluated using the empirical relationship between the moment magnitudes (M w ) and the surface rupture lengths (SRL) of active normal faults worldwide (Wells & Coppersmith, Citation1994):
If rupturing the whole of one segment, earthquake magnitude would be M w ~7.3–7.5. It may reach M w ~7.8 if the entire ~160-km-long fault trace is ruptured by single event. In summary, the LPF is able to generate an earthquake of M w ~7.3–7.8, posing a significant seismic risk in the western Hetao Graben. These findings would be helpful in better understanding seismic potentials associated with this major boundary fault.
6. Conclusions
On the basis of GIS morphotectonic analysis and sUAV-based field observations along the Langshan Mountains, North China, we have reached the following conclusions.
The Langshan landscape is in a state of disequilibrium in response to the rock uplift and channel incision on its southeastern flank affected by the active LPF;
Morphometric indices together with range topography indicate that the LPF consists of two segments with fault lengths of 65 and 95 km, respectively, which likely have been linked with each other;
Rupturing of the whole one segment of the LPF will generate an earthquake of M w ~7.3–7.5, and earthquake magnitude may reach M w ~7.8 if the entire fault trace of ~160 km is ruptured, posing a significant seismic risk in the western Hetao Graben.
We suggest that future investigations integrating precise constraints on the slip rates and paleoseismic histories of each segments would be helpful in better understanding the evolution of this basin-bounding normal fault through space and time.
Funding
This study was supported by the National Natural Science Foundation of China [No. 41502203], National Science and Technology Major Project of China [No. 2017ZX05008-001], and research projects of China Geological Survey [Nos. 121201104000150001 and 1212011120099].
Disclosure statement
No potential conflict of interest was reported by the authors.
Acknowledgements
We are grateful to Profs. Athanassios Ganas, Zhou Lin and Hanlin Chen, Drs. Lei Wu, Rong Yang, Wangbin Gong, and Shaopeng Dong for fruitful discussions which greatly improved this manuscript. We thank the editor (Prof. Erdin Bozkurt) and two anonymous reviewers for their critical comments and constructive suggestions.
References
- Alipoor, R., Poorkermani, M., Zare, M., & El Hamdouni, R. (2011). Active tectonic assessment around Rudbar Lorestan dam site, High Zagros Belt (SW of Iran). Geomorphology, 128, 1–14.10.1016/j.geomorph.2010.10.014
- Amato, V., Aucelli, P. P. C., Sessa, B., Cesarano, M., Incontri, P., Pappone, G., … Vilardo, G. (2017). Multidisciplinary approach for fault detection: Integration of PS-InSAR, geomorphological, stratigraphic and structural data in the Venafro intermontane basin (Central-Southern Apennines, Italy). Geomorphology, 283, 80–101.10.1016/j.geomorph.2017.01.027
- Attal, M., Tucker, G. E., Whittaker, A. C., Cowie, P. A., & Roberts, G. P. (2008). Modeling fluvial incision and transient landscape evolution, influence of dynamic channel adjustment. Journal of Geophysical Research: Earth Surface, 113, F03013. doi:10.1029/2007JF000893
- Azor, A., Keller, E. A., & Yeats, R. S. (2002). Geomorphic indicators of active fold growth: South Mountain-Oak Ridge anticline, Ventura basin, southern California. Geological Society of America Bulletin, 114, 745–753.10.1130/0016-7606(2002)114<0745:GIOAFG>2.0.CO;2
- Bagha, N., Arian, M., Ghorashi, M., Pourkermani, M., El Hamdouni, R., & Solgi, A. (2014). Evaluation of relative tectonic activity in the Tehran basin, central Alborz, northern Iran. Geomorphology, 213, 66–87.10.1016/j.geomorph.2013.12.041
- Boulton, S. J., & Whittaker, A. C. (2009). Quantifying the slip rates, spatial distribution and evolution of active normal faults from geomorphic analysis: Field examples from an oblique-extensional graben, southern Turkey. Geomorphology, 104(3), 299–316.10.1016/j.geomorph.2008.09.007
- Brookfield, M. E. (1998). The evolution of the great river systems of southern Asia during the Cenozoic India-Asia collision: Rivers draining southwards. Geomorphology, 22, 285–312.10.1016/S0169-555X(97)00082-2
- Bubeck, A., Wilkinson, M., Roberts, G. R., Cowie, P. A., McCaffrey, K. J. W., Philips, R., & Sammonds, P. (2015). The tectonic geomorphology of bedrock scarps on active normal faults in the Italian Apennines mapped using combined ground penetrating radar and terrestrial laser scanning. Geomorphology, 237, 38–51.10.1016/j.geomorph.2014.03.011
- Bull, W. B. (1978). Geomorphic Tectonic class of the South front of the San Gabriel Mountains, California. U.S. Geological Survey Contract Report, 14-08-001-G-394, Office of Earthquakes, Volcanoes and Engineering, Menlo Park, CA.
- Bull, W. B., & Mcfadden, L. D. (1977). Tectonic geomorphology north and south of the Garlock fault, California. In Dohering DO. (Ed.), Geomorphology in arid regions. Proceedings of the eighth annual geomorphology symposium (pp. 115–138). Binghamton: State University of New York.
- Cannon, P. J. (1976). Generation of explicit parameters for a quantitative geomorphic study of Mill Creek drainage basin. Oklahoma Geology Notes, 36, 3–16.
- Chen, Y., Sung, Q., & Cheng, Y. (2003). Along-strike variations of morphotectonic features in the Western Foothills of Taiwan: Tectonic implications based on stream-gradient and hypsometric analysis. Geomorphology, 56, 109–137.10.1016/S0169-555X(03)00059-X
- Cheng, Y., He, C., Rao, G., Yan, B., Lin, A., Hu, J., … Yao, Q. (2018). Geomorphological and structural characterization of the southern Weihe Gaben, central China: Implications for fault segmentation. Tectonophysics, 722, 11–24.
- China Earthquake Networks Center (CENC). (2017). Seismological data service system (in Chinese). Retrieved February 24, from http://www.csndmc.ac.cn/newweb/data.htm
- Cowie, P. A. (1998). A healing-reloading feedback control on the growth rate of seismogenic faults. Journal of Structural Geology, 20, 1075–1087.10.1016/S0191-8141(98)00034-0
- Cowie, P. A., & Roberts, G. P. (2001). Constraining slip rates and spacings for active normal faults. Journal of Structural Geology, 23, 1901–1915.10.1016/S0191-8141(01)00036-0
- Cowie, P. A., Attal, M., Tucker, G. E., Whittake, A. C., Naylor, M., Ganas, A., & Roberts, G. P. (2006). Investigating the surface process response to fault interaction and linkage using a numerical modelling approach. Basin Research, 18, 231–266.10.1111/j.1365-2117.2006.00298.x
- Crone, A. J., & Haller, K. M. (1991). Segmentation and the coseismic behavior of Basin and Range normal faults: Examples from east-central Idaho and southwestern Montana, U.S.A. Journal of Structural Geology, 13, 151–164.10.1016/0191-8141(91)90063-O
- Delcaillau, B., Deffontaines, B., Floissac, L., Angelier, J., Deramond, J., Souquet, P., … Lee, J. F. (1998). Morphotectonic evidence from lateral propagation of an active frontal fold; Pakuashan anticline, foothills of Taiwan. Geomorphology, 24, 263–290.10.1016/S0169-555X(98)00020-8
- Delcaillau, B., Laville, E., Amhrar, M., Namous, M., Dugué, O., & Pedoja, K. (2010). Quaternary evolution of the Marrakech High Atlas and morphotectonic evidence of activity along the Tizi N’Test Fault, Morocco. Geomorphology, 118, 262–279.10.1016/j.geomorph.2010.01.006
- Demoulin, A. (2011). Basin and river profile morphometry: A new index with a high potential for relative dating of tectonic uplift. Geomorphology, 126, 97–107.10.1016/j.geomorph.2010.10.033
- Deng, Q. (2007). Active tectonics map of China. Beijing: Seismological Press (in Chinese).
- Deng, Q., & Liao, Y. (1996). Paleoseismology along the range-front fault of Helan Mountains, north central China. Journal of Geophysical Research: Solid Earth, 101, 5873–5893.10.1029/95JB01814
- Deng, Q., Cheng, S., Min, W., Yang, G., & Ren, D. (1999). Discussion on Cenozoic tectonics and dynamics of Ordos Block. Journal of Geomechanics, 5, 13–21. (in Chinese with English abstract).
- Densmore, A. L., Dawers, N. H., Gupta, S., Guidon, R., & Goldin, T. (2004). Footwall topographic development during continental extension. Journal of Geophysical Research: Earth Surface, 109, F03001. doi:10.1029/2003JF000115
- Densmore, A. L., Dawers, N. H., Gupta, S., & Guidon, R. (2005). What sets topographic relief in extensional footwalls? Geology, 33, 453–456.10.1130/G21440.1
- DePolo, C. M., & Anderson, J. G. (2000). Estimating the slip rates of normal faults in the Great Basin, USA. Basin Research, 12, 227–240.10.1046/j.1365-2117.2000.00131.x
- Ding, G. (1990). The inhomogencity of faulting in Holocene. Earthquake Research in China, 6, 1–9. (in Chinese with English abstract).
- Dong, S., Zhang, P., Zhang, H., Zheng, W., & Chen, H. (2018a). Drainage response to the activity of the Langshan range-front fault and tectonic implication. Journal of Earth Science, 29(1), 193–209.10.1007/s12583-017-0902-8
- Dong, S., Zhang, P., Zheng, W., Yu, Z., Lei, Q., Yang, H., … Gong, H. (2018b). Paleoseismic observations along the Langshan range-front fault, Hetao Basin, China: Tectonic and seismic implications. Tectonophysics, 730, 63–80.10.1016/j.tecto.2018.02.012
- DuRoss, C. B., Personius, S. F., Crone, A. J., Olig, S. S., Hylland, M. D., Lund, W. R., & Schwartz, D. P. (2016). Fault segmentation: New concepts from the Wasatch Fault Zone, Utah, USA. Journal of Geophysical Research: Solid Earth, 121, 1131–1157.
- El Hamdouni, R., Irigaray, C., Fernández, T., Chacón, T., & Keller, E. A. (2008). Assessment of relative active tectonics, southwest border of the Sierra Nevada (southern Spain). Geomorphology, 96, 150–173.10.1016/j.geomorph.2007.08.004
- Ferrarini, F., Boncio, P., de Nardis, R., Pappone, G., Cesarano, M., Aucelli, P. P. C., & Lavecchia, G. (2017). Segmentation pattern and structural complexities in seismogenic extensional settings: The North Matese Fault System (Central Italy). Journal of Structural Geology, 95, 93–112.10.1016/j.jsg.2016.11.006
- Font, M., Amorese, D., & Lagarde, J. L. (2010). DEM and GIS analysis of the stream gradient index to evaluate effects of tectonics: The Normandy intraplate area (NW France). Geomorphology, 119, 172–180.10.1016/j.geomorph.2010.03.017
- Ganas, A., Roberts, G. P., & Memou, T. (1998). Segment boundaries, the 1894 ruptures and strain patterns along the Atalanti Fault, Central Greece. Journal of Geodynamics, 26, 461–486.10.1016/S0264-3707(97)00066-5
- Ganas, A., Pavlides, S. B., Sboras, S., Valkaniotis, S., Papaioannou, S., Alexandris, G. A., … Papadopoulos, G. A. (2004). Active fault geometry and kinematics in Parnitha Mountain, Attica, Greece. Journal of Structural Geology, 26, 2013–2118.
- Ganas, A., Shanov, S., Drakato, G., Dobrev, N., Sboras, S., Tsimi, C., … Pavlides, S. (2005a). Active fault segmentation in southwest Bulgaria and Coulomb stress triggering of the 1904 earthquake sequence. Journal of Geodynamics, 40, 316–333.
- Ganas, A., Palvides, S., & Karastathis, V. (2005b). DEM-based morphometry of range-front escarpments in Attica, central Greece, and its relation to fault slip rates. Geomorphology, 65, 310–319.
- Gao, M., Zeilinger, G., Xu, X., Wang, Q., & Hao, M. (2013). DEM and GIS analysis of geomorphic indices for evaluating recent uplift of the northeastern margin of the Tibetan Plateau, China. Geomorphology, 190, 61–72.10.1016/j.geomorph.2013.02.008
- Geological Team of Inner Mongolia (GTIM). (1981). Regional Geology of the Inner Mongolia. Beijing: Geological Publishing House.
- Giaconia, F., Booth-Rea, G., Martínez-Martínez, J. M., Azañón, J. M., Pérez-Peña, J. V., Pérez-Romero, J., & Villegas, I. (2012). Geomorphic evidence of active tectonics in the Sierra Alhamilla (eastern Betics, SE Spain). Geomorphology, 145, 90–106.10.1016/j.geomorph.2011.12.043
- Hack, J. T. (1973). Stream-profiles analysis and stream-gradient index. Journal of Research of the US Geological Survey, 1, 421–429.
- He, H., Wei, Z., & Densmore, A. L. (2016). Quantitative morphology of bedrock fault surfaces and identification of paleo-earthquakes. Tectonophysics, 693, 22–31.10.1016/j.tecto.2016.09.032
- He, Z., Ma, B., Long, J., Wang, J., & Zhang, H. (2018). New progress in paleoearthquake studies of the east Seertengshan Piedmont Fault, Inner Mongolia, China. Journal of Earth Science. doi:10.1007/s12583-017-0937-z
- Huang, X., Zhang, J., Li, T., Liu, F., & Feng, J. (2012). Characteristics of active faults between the north segment of the North-South Seismic Belt and central Mongolia. Seismology & Geology, 34, 637–658. (in Chinese with English abstract).
- Jia, L., Zhang, X., He, Z., He, X., Wu, F., Zhou, Y., … Zhao, J. (2015). Late Quaternary climatic and tectonic mechanisms driving river terrace development in an area of mountain uplift: A case study in the Langshan area, Inner Mongolia, northern China. Geomorphology, 234, 109–121.10.1016/j.geomorph.2014.12.043
- Jiang, W., Xiao, Z., & Xie, X. (2000). Segmentations of active normal dip-slip faults around ordos block according to their surface ruptures in historical strong earthquakes. Acta Seismologica Sinica, 13, 552–562.10.1007/s11589-000-0055-2
- Keller, E. A. (1986). Investigation of active tectonics: Use of surficial earth processes. In R. E. Wallace (Ed.), Active Tectonics, Studies in Geophysics (pp. 136–147). Washington, DC: National Academy Press.
- Keller, E. A., & Pinter, N. (2002). Active Tectonics: Earthquakes, uplift, and landscape (2nd ed.). (p. 362). Upper Saddle River, NJ: Prentice Hall.
- Kent, E., Boulton, S. J., Stewart, I. S., Whittaker, A. C., & Alçiçek, M. C. (2016). Geomorphic and geological constraints on the active normal faulting of the Gediz (Alasehir) Graben, Western Turkey. Journal of the Geological Society, 173, 666–678.10.1144/jgs2015-121
- Kent, E., Boulton, S. J., Whittaker, A. C., Stewart, I. S., & Alçiçek, M. C. (2017). Normal fault growth and linkage in the Gediz (Alaşehir) Graben, Western Turkey, revealed by transient river long-profiles and slope-break knickpoints. Earth Surface Processes & Landforms, 42, 836–852.10.1002/esp.v42.5
- Kirby, E., & Whipple, K. (2001). Quantifying differential rock-uplift rates via stream profile analysis. Geology, 29, 415–418.10.1130/0091-7613(2001)029<0415:QDRURV>2.0.CO;2
- Li, Y., Ran, Y., Chen, L., Wu, F., & Lei, S. (2015). The latest surface rupture events on the major active faults and great historical earthquakes in Hetao fault-depression zone. Seismology & Geology, 37, 110–125 . (in Chinese with English abstract).
- Liu, X., Zhang, X., Ye, P., He, Z., Fu, L., Jia, L., & He, X. (2016). Extraction of tectonic geomorphologic parameters based on DEM and analysis of difference on tectonic activity about Langshan Mountain, Inner Mongolia. Journal of Geomechanics, 22, 152–161 . (in Chinese with English abstract).
- Machette, M. N., Personius, S. F., Nelson, A. R., Schwartz, D. P., & Lund, W. R. (1991). The Isatch fault zone, Utah-segmentation and history of Holocene earthquakes. Journal of Structural Geology, 13, 137–149.10.1016/0191-8141(91)90062-N
- Mahmood, S. A., & Gloaguen, R. (2012). Appraisal of active tectonics in Hindu Kush: Insights from DEM derived geomorphic indices and drainage analysis. Geoscience Frontiers, 3, 407–428.10.1016/j.gsf.2011.12.002
- Manighetti, I., Caulet, C., Barros, L., Perrin, C., Cappa, F., & Gaudemer, Y. (2015). Generic along-strike segmentation of Afar normal faults, East Africa: Implications on fault growth and stress heterogeneity on seismogenic fault planes. Geochemistry, Geophysics, Geosystems, 16, 443–467.10.1002/2014GC005691
- Matoš, B., Pérez-Peña, J. V., & Tomljenović, B. (2016). Landscape response to recent tectonic deformation in the SW Pannonian Basin: Evidence from DEM-based morphometric analysis of the Bilogora Mt. area, NE Croatia. Geomorphology, 263, 132–155.10.1016/j.geomorph.2016.03.020
- Mayer, L. (1990). Introduction to Quantitative Geomorphology: An exercise manual. Englewood, Cliffs, NJ: Prentice Hall.
- McCalpin, J. P., & Nishenko, S. P. (1996). Holocene paleoseismicity, temporal clustering, and probabilities of furture large (M >7) earthquakes on the Wasatch fault zone, Utah. Journal of Geophysical Research, 101, 6233–6253.10.1029/95JB02851
- Menier, D., Mathew, M., Pubellier, M., Sapin, F., Delcaillau, B., Siddiqui, N., … Santosh, M. (2017). Landscape response to progressive tectonic and climatic forcing in NW Borneo: Implications for geological and geomorphic controls on flood hazard. Scientific Reports, 7, 457. doi:10.1038/s41598-017-00620-y
- Monteiro, K. D. A., Missura, R., & Correa, A. C. D. B. (2010). Application of the hack index-or stream length-gradient index (SL index)-to the Tracunhaem River Watershed, Pernambuco, Brazil. Geociências, 29, 533–539.
- Ntokos, D., Lykoudi, E., & Rondoyanni, T. (2016). Geomorphic analysis in areas of low-rate neotectonic deformation: South Epirus (Greece) as a case study. Geomorphology, 263, 156–169.10.1016/j.geomorph.2016.04.005
- Özkaymak, Ç. (2015). Tectonic analysis of the Honaz Fault (western Anatolia) using geomorphic indices and the regional implications. Geodinamica Acta, 27, 110–129.10.1080/09853111.2014.957504
- Özsayın, E. (2016). Relative tectonic activity assessment of the Çameli Basin, Western Anatolia, using geomorphic indices. Geodinamica Acta, 28, 241–253.
- Pavano, F., Pazzaglia, F. J., & Catalano, S. (2016). Knickpoints as geomorphic markers of active tectonics: A case study from northeastern Sicily (southern Italy). Lithosphere, 8, 633–648.10.1130/L577.1
- Pedrera, A., Pérez-Peña, J. V., Galindo-Zaldívar, J., Azañón, J. M., & Azor, A. (2009). Testing the sensitivity of geomorphic indices in areas of low-rate active folding (eastern Betic Cordillera, Spain). Geomorphology, 105, 218–231.10.1016/j.geomorph.2008.09.026
- Pérez-Peña, J. V., Azañón, J. M., & Azor, A. (2009a). CalHypso: An ArcGIS extension to calculate hypsometric curves and their statistical moments. Applications to drainage basin analysis in SE Spain. Computers & Geosciences, 35, 1214–1223.10.1016/j.cageo.2008.06.006
- Pérez-Peña, J. V., Azañón, J. M., Azor, A., Delgado, J., & González-Lodeiro, F. (2009b). Spatial analysis of stream power using GIS: SLk anomaly maps. Earth Surface Processes & Landforms, 34, 16–25.10.1002/esp.v34:1
- Pérez-Peña, J. V., Azor, A., Azañón, J. M., & Keller, E. A. (2010). Active tectonics in the Sierra Nevada (Betic Cordillera, SE Spain): Insights from geomorphic indexes and drainage pattern analysis. Geomorphology, 119, 74–87.10.1016/j.geomorph.2010.02.020
- Pérez-Peña, J. V., Al-Awabdeh, M., Azañón, J. M., Galve, J. P., Booth-Rea, G., & Notti, D. (2017). SwathProfiler and NProfiler: Two new ArcGIS Add-ins for the automatic extraction of swath and normalized river profiles. Computers & Geosciences, 104, 135–150.10.1016/j.cageo.2016.08.008
- Perron, J. T., & Royden, L. (2013). An integral approach to bedrock river profile analysis. Earth Surface Processes & Landforms, 38, 570–576.10.1002/esp.v38.6
- Petit, C., Meyer, B., Gunnell, Y., Jolivet, M., San’Kov, V., Strak, V., & Gonga-Saholiariliva, N. (2009). Height of faceted spurs, a proxy for determining long-term throw rates on normal faults: Evidence from the North Baikal Rift System, Siberia. Tectonics, 28, TC6010, doi:10.1029/2009TC002555
- Pike, R. J., & Wilson, S. E. (1971). Elevation-relief ratio, hypsometric integral, and geomorphic area-altitude analysis. Geological Society of America Bulletin, 82, 1079–1084.10.1130/0016-7606(1971)82[1079:ERHIAG]2.0.CO;2
- Pizzuto, J. E. (1992). The morphology of graded gravel rivers: A network perspective. Geomorphology, 5, 457–474.10.1016/0169-555X(92)90018-J
- Ramirez-Herrera, M. T. (1998). Geomorphic assessment of active tectonics in the Acambay graben, Mexican Volcanic Belt. Earth Surface Processes & Landforms, 23, 317–332.10.1002/(ISSN)1096-9837
- Rao, G., Lin, A., Yan, B., Jia, D., & Wu, X. (2014). Tectonic activity and structural features of active intracontinental normal faults in the Weihe Graben, central China. Tectonophysics, 638, 270–285.10.1016/j.tecto.2014.08.019
- Rao, G., Lin, A., & Yan, B. (2015). Paleoseismic study on active normal faults in the southeastern Weihe Graben, central China. Journal of Asian Earth Sciences, 114, 212–225.10.1016/j.jseaes.2015.04.031
- Rao, G., Chen, P., Hu, J., Yu, Y., & Qiu, J. (2016). Timing of Holocene paleo-earthquakes along the Langshan Piedmont Fault in the western Hetao Graben, North China: Implications for seismic risk. Tectonophysics, 677, 115–124.10.1016/j.tecto.2016.03.035
- Rao, G., Cheng, Y., Yu, Y., Yan, B., & Lin, A. (2017). Tectonic characteristics of the Lishan Piedmont Fault in the SE Weihe Graben (central China), as revealed by the geomorphological and structural analyses. Geomorphology, 282, 52–63.10.1016/j.geomorph.2017.01.014
- Rao, G., He, C., Cheng, Y., Yu, Y., Hu, J., Chen, P., & Yao, Q. (2018). Active normal faulting along the Langshan Piedmont Fault, North China: Implications for slip partitioning in the Western Hetao Graben. The Journal of Geology, 126, 99–118.10.1086/694748
- Rockwell, T. K., Lindvall, S., Herzberg, M., Murbach, D., Dawson, T., & Berger, G. (2000). Paleoseismology of the Johnson Valley, Kickapoo, and Homestead Valley faults: Clustering of earthquakes in the Eastern California shear zone. Bulletin of the Seismological Society of America, 90, 1200–1236.10.1785/0119990023
- Roda-Boluda, D. C., & Whittaker, A. C. (2018). Normal fault evolution and coupled landscape response: Examples from the Southern Apennines, Italy. Basin Research, 30, 186–209.10.1111/bre.2018.30.issue-S1
- Royden, L., & Perron, J. T. (2013). Solutions of the stream power equation and application to the evolution of river longitudinal profiles. Journal of Geophysical Research, 118, 497–518.
- Schumm, S. A. (1956). Evolution of drainage systems and slopes in badlands at Perth Amboy, New Jersey. Geological Society of America Bulletin, 67, 597–646.10.1130/0016-7606(1956)67[597:EODSAS]2.0.CO;2
- Schwartz, D. P., & Coppersmith, K. J. (1984). Fault behavior and characteristic earthquakes: Examples from the Wasatch and San Andreas Fault Zone. Journal of Geophysical Research: Solid Earth, 89, 5681–5698.10.1029/JB089iB07p05681
- Selçuk, A. S. (2016). Evaluation of the relative tectonic activity in the eastern Lake Van basin, East Turkey. Geomorphology, 270, 9–21.
- Silva, P. G., Goy, J. L., Zazo, C., & Bardaji, T. (2003). Fault-generated mountain fronts in southeast Spain: Geomorphologic assessment of tectonic and seismic activity. Geomorphology, 50, 203–225.10.1016/S0169-555X(02)00215-5
- Snyder, N. P., Whipple, K. X., Tucker, G. E., & Merritts, D. J. (2000). Landscape response to tectonic forcing: Digital elevation model analysis of stream profiles in the Mendocino triple junction region, northern California. Geological Society of America Bulletin, 112, 1250–1263.10.1130/0016-7606(2000)112<1250:LRTTFD>2.0.CO;2
- State Seismological Bureau (SSB). (1988). Active fault system around Ordos Massif (in Chinese) (p. 352). Beijing: Seismological Press.
- Strahler, A. N. (1952). Hypsometric (area-altitude) analysis of erosional topography. Geological Society of America Bulletin, 63, 1117–1142.10.1130/0016-7606(1952)63[1117:HAAOET]2.0.CO;2
- Sun, A., Hu, X., & Niu, S. (1990). Geological features of active structure in Langshan Area, Nei Mongol. Journal of Hebei College of Geology, 13, 27–35 . (in Chinese with English abstract).
- Swan, F. H., Schwartz, D. P., & Cluff, L. S. (1980). Recurrence of moderate to large magnitude earthquakes produced by surface faulting on the Wasatch fault zone, Utah. Bulletin of the Seismological Society of America, 70, 1431–1462.
- Topal, S., Keller, E., Bufe, A., & Koçyiğit, A. (2016). Tectonic geomorphology of a large normal fault: Akşehir fault, SW Turkey. Geomorphology, 259, 55–69.10.1016/j.geomorph.2016.01.014
- Tsimi, C., & Ganas, A. (2015). Using the ASTER global DEM to derive empirical relationships among triangular facet slope, facet height and slip rates along active normal faults. Geomorphology, 234, 171–181.10.1016/j.geomorph.2015.01.018
- Wells, D. L., & Coppersmith, K. J. (1994). New empirical relationships among magnitude, rupture length, rupture width, rupture area, and surface displacement. Bulletin of the seismological Society of America, 84, 974–1002.
- Wen, X. (2014). Structures of source regions of the 1970 Ms 6.0 Wuyuan earthquake and the 1996 Ms 6.4 Baotou earthquake in Inner Mongolia. China. Seismology & Geology, 36, 586–597. (in Chinese with English abstract).
- Whittaker, A. C., & Boulton, S. J. (2012). Tectonic and climatic controls on knickpoint retreat rates and landscape response times. Journal of Geophysical Research, 117, F02024. doi:10.1029/2011JF002157
- Whittaker, A. C., & Walker, A. S. (2015). Geomorphic constraints on fault throw rates and linkage times: Examples from the Northern Gulf of Evia, Greece. Journal of Geophysical Research: Earth Surface, 120, 137–158.
- Willett, S. D., McCoy, S. W., Perron, J. T., Goren, L., & Chen, C. Y. (2014). Dynamic reorganization of river basins. Science, 343, 1248765. doi:10.1126/science.1248765
- Wobus, C., Whipple, K. X., Kirby, E., Snyder, N., Johnson, J., Spyropolou, K., … Sheehan, D. (2006). Tectonics from topography: Procedures, promise, and pitfalls. Geological Society of America Special Papers, 398, 55–74.
- Wu, L., Xiao, A., & Yang, S. (2014). Impact of wind erosion on detecting active tectonics from geomorphic indexes in extremely arid areas: A case study from the Hero Range, Qaidam Basin, NW China. Geomorphology, 224, 39–54.10.1016/j.geomorph.2014.07.010
- Xu, X., Ma, X., & Deng, Q. (1993). Neotectonic activity along the Shanxi rift system, China. Tectonophysics, 219, 305–325.10.1016/0040-1951(93)90180-R
- Yang, R., Willett, S. D., & Goren, L. (2015). In situ low-relief landscape formation as a result of river network disruption. Nature, 520, 526–529.10.1038/nature14354
- Yildirim, C. (2014). Relative tectonic activity assessment of the Tuz Gölü Fault Zone; Central Anatolia, Turkey. Tectonophysics, 630, 183–192.10.1016/j.tecto.2014.05.023
- Zhang, B., Jia, S., Wang, T., & Zheng, B. (1985). Intraplate seismotectonic features of North China. Tectonophysics, 117, 177–191.10.1016/0040-1951(85)90245-8
- Zhang, P., Slemmons, D. B., & Mao, F. (1991). Geometric pattern, rupture termination and fault segmentation of the Dixie Valley-Pleasant Valley active normal fault system, Nevada, USA. Journal of Structural Geology, 13, 165–176.10.1016/0191-8141(91)90064-P
- Zhang, A., Yang, Z., Zhong, J., & Mi, F. (1995). Characteristics of late quaternary activity along the Southern Border Fault Zone of Weihe Graben Basin. Quaternary International, 25, 25–31.10.1016/1040-6182(94)P3715-K
- Zhang, Y., Mercier, J. L., & Vergély, P. (1998). Extension in the graben systems around the Ordos (China), and its contribution to the extrusion tectonics of south China with respect to Gobi-Mongolia. Tectonophysics, 285, 41–75.
- Zhang, P., Mao, F., & Slemmons, D. B. (1999). Rupture terminations and size of segment boundaries from historical earthquake ruptures in the Basin and Range Province. Tectonophysics, 308, 37–52.10.1016/S0040-1951(99)00089-X