Abstract
Thermal remote sensing imagery is helpful for land cover classification and related analysis. Unfortunately, the spatial resolution of thermal infrared (TIR) band is generally coarser than that of visual near-infrared band, which limits its more precise applications. Various thermal sharpening (TSP) techniques have been developed for improving the spatial resolution of the imagery of TIR band or land surface temperature (LST). However, there is no research on the theoretical estimation of TSP error till now, which implies that the error in sharpened LST imagery is unknown and the further analysis might be not reliable. In this paper, an error estimation method based on classical linear regression theory for the linear-regression-based TSP techniques was firstly introduced. However, the scale difference between the coarse resolution and fine resolution is not considered in this method. Therefore, we further developed an improved error estimation method with the consideration of the scale difference, which employs a novel term named equivalent random sample size to reflect the scale difference. A simulation study of modified TsHARP (a typical TSP technique) shows that the improved method estimated the TSP error more accurately than classical regression theory. Especially, the phenomena that TSP error increases with the increasing resolution gap between the initial and target resolutions can be successfully predicted by the proposed method.
1. Introduction
Thermal remote sensing imagery is useful for analyzing the heat exchange on different land covers (Citation1, Citation2), and also helpful for particular land cover classification (Citation3). However, with the physical limitation of remote sensors, the spatial resolution of thermal infrared (TIR) band is generally coarser than that of visual near-infrared (VNIR) band, which limits its more precise applications. Therefore, thermal sharpening (TSP) techniques used for improving the spatial resolution of TIR (or land surface temperature [LST]) imagery have been thriving (Citation4). Most TSP techniques sharpen the thermal imagery using certain LST proxy derived from VINR band. The relationship between LST proxy and LST is firstly established at coarse thermal resolution, and then is applied at the fine VNIR resolution. For example, the famous TsHARP method (Citation5, Citation6) uses the vegetation fraction derived from normalized different vegetation index (NDVI) as LST proxy because of the good correlation between vegetation fraction and LST. Other proxies, such as NDWI, solar albedo, were also used in some researches (Citation7, Citation8). Another important issue is the regression tool for establishing the relationship between LST proxy and LST. Linear and various non-linear regression tools (e.g. artificial neural network and regression tree) were applied in previous studies (Citation9, Citation10). Among them, the linear TsHARP is still the most popular method because of its simple operation (Citation11).
Previous studies provided accuracy assessments for TSP techniques under different scenes, and found that the sharpening accuracy varies largely for different spatial resolutions, land cover types, acquiring seasons, and other factors (Citation6, Citation12−15). Consequently, the error in sharpened LST imagery could be out of control in most applications where TIR imagery with high spatial resolution is not available for accuracy assessment. And this unknown error was usually ignored in further applications or analysis (Citation16). Therefore, theoretical error estimation without high-resolution LST data is in urgency for reliable analysis. However, theoretical error estimation for TSP techniques has not received attentions in the previous researches. For linear-regression-based TSP techniques, a simple solution is to use the variance estimate of forecast value based on classical linear regression theory. Classical linear regression theory assumes that the training sample used for establishing the model and the test sample used for prediction are randomly selected from the same population. However, this assumption is problematic for TSP techniques, where the training data-set (with coarse resolution) and test data-set (with fine resolution) are sampled on different scales and the scale effect cannot be neglected (Citation12). In order to provide general theoretical error estimation for the linear-regression-based TSP methods, this study proposes an improved variance estimating method for sharpened LST with the consideration of scale difference.
2. Methodology
2.1. Linear-regression-based TSP technique
Linear regression model was employed in many TSP techniques, and we name this kind of techniques as linear-regression-based TSP technique in this paper. Although different linear-regression-based TSP techniques differ in detail, they can be generally simplified into two steps. Firstly, a linear relationship between LST proxy (P) and LST (T) is established at coarse resolution.(1)
where a and b are the regression coefficients. Then, this relationship is applied at the high resolution, and LST at the fine VNIR resolution could be estimated as Ref. (Citation5).(2)
2.2. Error estimation by classical linear regression theory
Based on classical linear regression theory, the variance of the slope estimate (a) in the linear regression model between Plow and Tlow (Equation (Equation1(1) )) is estimated as Ref. (Citation17):
(3)
where is the estimated standard deviation (StDev) of the residual of the regression model;
is StDev of Plow; n is the number of coarse pixels in the LST image. Then the StDev of the forecast error of LST on pixel i is:
(4)
Then we could estimate RMSE of the whole sharpened LST image as:(5)
where N is the number of fine pixels in the VNIR image. According to Equation (Equation3(3) ), we could find that
is only related to the data of thermal resolution that are used for training. In reality, however, the TSP error generally decreases when the VNIR resolution is closer to the thermal resolution (Citation6), which cannot be reflected in the above equations. In other words, scale difference is disregarded in classical regression theory.
2.3. Error estimation with the consideration of scale difference
In the TSP procedure, the data with high resolution (Phigh and Thigh) correspond to the population and the data with low resolution (Plow and Tlow) could correspond to particular samples. This sampling mode averages the values of the original data in a spatial order, therefore cannot be regarded as either randomly sampling or systematic sampling that generally assumed in the classical statistical models. In general, the mean values of P and T kept unchanged for the images sampled at different resolutions, while the variances of them change largely at different resolutions. Results from the classical regression theory could be misleading when the random sample assumption is dissatisfied.
In order to address this issue, we proposed an idea that the role of a certain non-random sample size (n) could be equal to that of a different random sample size (usually smaller than n). Based on this idea, we define a virtual sample size, named as equalized random sample size (), to replace the actual sample size (n) in Equations (Equation3
(3) –Equation5
(5) ). We use the Chi-square distribution (χ2) as a bridge to derive this equalized random sample size. Assuming that the Plow are randomly selected from Phigh, then the ratio between
and
should satisfy χ2 distribution:
(6)
Then, we set the equal to the theoretical secondary moment of χ2 distribution:
(7)
Considering that and
,
could be derived as:
(8)
Finally, the equalized random sample size () is defined by Equation (Equation8
(8) ). When there is no difference between
and
,
approaches infinity, which indicates that the regression model is very reliable. When the difference between
and
becomes larger,
decreases, indicating a weaker reliability of the regression model. This is reasonable because larger difference between
and
corresponds to larger difference between high resolution and low resolution, which leads to a larger TSP error. By replacing the n with
in Equations (Equation4
(4) ) and (Equation5
(5) ), we could acquire the new StDev of forecast error of LST on pixel i.
(9)
and new estimated RMSE of the whole sharpened image is:(10)
Therefore, a new TSP error estimation could be acquired by Equations (Equation9(9) ) and (Equation10
(10) ), where the scale difference between the data with low and high resolutions can be reflected by equalized random sample size (
).
3. Case study of modified TsHARP
3.1. Modified TsHARP
Modified TsHARP is an improvement of TsHARP by considering the effect of spatial extent (Citation12). Similar with TsHARP, modified TsHARP also uses the information of vegetation fraction as the LST proxy on high spatial resolution. As suggested in Ref. (Citation3), a simple transformation of NDVI is used for representing the information of vegetation fraction:(11)
Original TsHARP method employs f as the LST proxy directly. However, as the spatial extent affects the regressed slope largely, modified TsHARP estimates the slope based on the regression between Tlow and flow on the minimum available spatial extent (2 × 2 thermal pixels) (Citation12); in other words, the regression is conducted between the high frequency component of Tlow and flow imagery, denoted as δTlow and δflow here for convenience: (12)
where Tlow,2 × 2 and flow,2 × 2 are the averaged Tlow and flow in the window of 2 × 2 thermal pixels, respectively. In summary, following linear relationship is firstly established:(13)
Then, it is applied on high resolution:
, where
(14)
This spatial extent used in modified TsHARP is much more approximate to the ideal extent (one thermal pixel) than original TsHARP. And it has been confirmed to perform more robust than original TsHARP (Citation12, Citation13), therefore was used for our case study.
According to Sections 2.2 and 2.3, the error estimations (classical method and proposed method) of modified TsHARP could be acquired by replacing the Plow and Phigh in the Equations (Equation3(3) –Equation10
(10) ) with δflow and δfhigh.
3.2. Simulation experiment
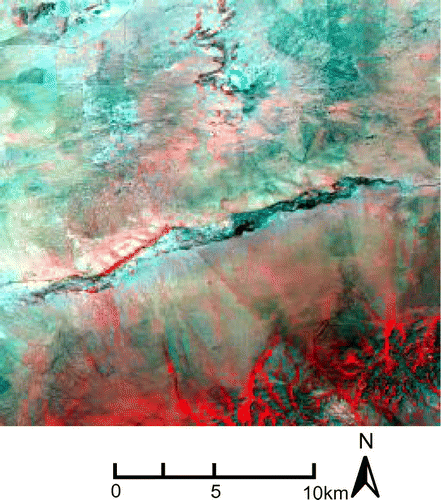
To assess our proposed error estimating method for modified TsHARP, a simulation experiment by ASTER data was conducted. The subset of ASTER image (256 × 256 pixels with 90 m resolution) for the experiment was acquired in Inner Mongolia, China (44.6°N, 116.0°E), where grassland is the dominant landscape (Figure ). The atmospheric corrected VNIR reflectance and LST were produced by Global Earth Observation Grid (Citation18). Firstly, the original data (90 m resolution for LST and 15 m resolution for VNIR) were resampled to the spatial resolution of 90, 180, 360, 720, and 1440 m. Then, modified TsHARP method was used for sharpening from different initial low resolutions to different target higher resolutions. There were totally 10 combinations of the initial resolution and target resolution (1440 m → 90 m, 1440 m → 180 m, 1440 m → 720 m, 720 m → 90 m, 720 m → 180 m, 720 m → 360 m, 360 m → 90 m, 360 m → 180 m, 180 m → 90 m). By using Equations (Equation4(4) ) and (Equation9
(9) ), the StDev of sharpened LST of each pixel was estimated by classical linear regression method and the proposed method. The actual absolute error of sharpened LST of each pixel was also calculated for comparison. Then, RMSEs of each scene were estimated by classical method (Equation (Equation5
(5) )) and proposed method (Equation (Equation10
(10) )). And the actual RMSEs were calculated for evaluating the two error estimating methods.
3.3. Results
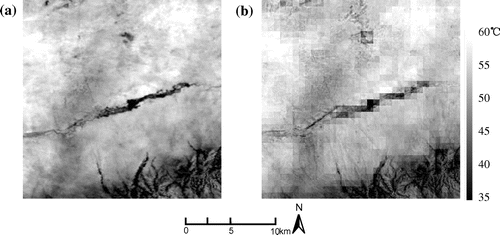
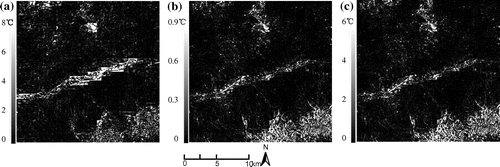
Taking the sharpening experiment from 720 to 90 m as an example, Figure compares the original LST images with 90 m resolution and sharpened LST images by modified TsHARP; and some TSP errors could be found visually (e.g. boxy artifact). Figure (a) further shows the spatial distribution of actual absolute error of TSP (720 m → 90 m). It could be found that large TSP errors more likely happened in the areas with high heterogeneity (e.g. the riverside), where δfhigh are large. Figure (b) and (c) show the images of StDev of sharpened LST estimated by classical linear regression method and proposed method, respectively. In general, both of the spatial distributions of StDev estimated by the two methods are consistent with that of actual error, because larger δfhigh also leads to larger StDev estimate according to Equations (Equation4(4) ) and (Equation9
(9) ). It indicates that spatial distribution of the TSP error could be well reflected by both of the classical method and proposed method. Actually, the spatial patterns of the StDev estimated by these two methods are totally same because they differ with only the term of sample size which is a constant for the whole scene of image. However, the ranges of the estimated StDev differ largely. As shown in Figure , the StDev estimated by proposed method is much higher than that estimated by classical method, and more approximate to the actual error.
Figure 3. Spatial distribution of TSP error (720 m → 90 m) (a) Actual absolute error; (b) StDev of sharpened LST estimated by classical method; (c) StDev of sharpened LST estimated by proposed method.
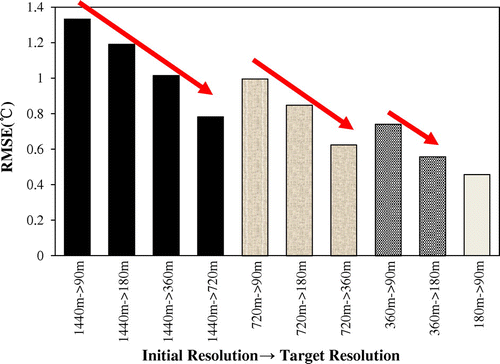
Actual RMSEs of the sharpened LST images for the 10 combinations of initial resolutions and target resolutions are shown in Figure . In general, when the difference between initial resolution and target resolution is smaller, the sharpening error becomes lower, which is consistent with previous studies (Citation6, Citation13). Figure compares the RMSEs estimated by classical linear regression method and the proposed method with the actual RMSEs. It could be found that the estimated RMSE by the proposed method is much closer to actual RMSE than that by classical method. As shown in Figure (b), as long as the initial resolution is fixed, RMSE estimated by classical method keeps unchanged for different target resolutions because the actual sample size is also fixed (Table ). In contrast, the proposed method estimated different RMSE values if only the initial resolution is fixed, because the equalized random sample size is determined by both the data on target resolution and initial resolution. As shown in Table , the equalized random sample sizes were much smaller than the actual sample size, and varied for the different target or initial resolutions. Smaller sample size could increase the estimated RMSE, consequently avoiding the underestimation in classical method. In summary, the proposed method can estimate RMSE more accurately by employing the equalized random sample size.
Figure 5. Comparison between the actual RMSE and estimated RMSE by proposed method (a) and classical method (b).
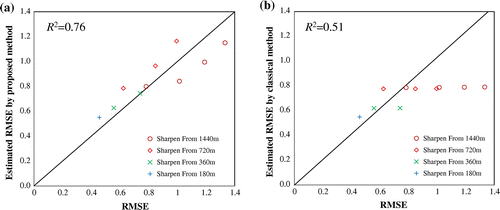
Table 1. Comparison of actual sample size and equalized random sample size.
4. Discussion and conclusions
Linear-regression-based TSP techniques are of great importance in the researches about the downscaling of TIR remotely sensed data. However, the uncertainty in such scale transformation is poorly understood. In this letter, we define equalized random sample size, which is derived from the ratio between the variances of the data at target and initial resolutions, to describe the scale difference between the data with these two resolutions. Based on the equalized random sample size, we improved the error estimation in linear regression theory. The simulated TSP experiments show that the proposed method estimates TSP error more accurately than the classical linear regression theory. The accurate error estimation would help researchers to better understand the uncertainty in sharpened LST images and possible error propagation in further analysis. Because the TSP error increases with the increasing of the resolution gap, the linear-regression-based TSP techniques could produce unacceptable errors and become meaningless for the case of very large resolution gap. With the consideration of such trade-off between the high target resolution and low TSP error, another meaning of our method is to provide guidance of selecting a meaningful target resolution according to the need of specific studies.
Although there is a significant improvement from the classical method to the proposed method, there are still some issues remaining further concerned. First, the meaning of equalized random sample size is not proved strictly in theory. A new statistical model might be required to describe the scale difference in a strict manner. Second, the effect of improved method was confirmed only in a case study of modified TsHARP. More TSP experiments with different data-sets and methods should be conducted in further studies.
Notes on contributors
Xuehong Chen received the PhD degree of Science from Nagoya University, Nagoya, Japan, in 2012. He is currently an associate professor in Beijing Normal University. His research interests include land cover mapping and scale effect of remote sensing.
Wentao Li received the BS degree in Mathematics from Beijing Normal University, Beijing, China, in 2013. He is currently a master student in Academy of Disaster Reduction and Emergency Management, Beijing Normal University. His research interests include the applications of thermal remote sensing and ground-penetrating radar.
Jin Chen received the PhD degree in Civil Engineering from Kyushu University, Fukuoka, Japan, in 2000. He is currently a professor in Beijing Normal University. His research interests include remote sensing modeling and vegetation parameter retrieval.
Wenfeng Zhan received the PhD degree of Science from Beijing Normal University, Beijing, China, in 2012. He is currently an associate professor in Nanjing University. His research interest is thermal remote sensing.
Yuhan Rao received the BS degree in Mathematics from Beijing Normal University, Beijing, China, in 2011. He is currently a master student in Academy of Disaster Reduction and Emergency Management, Beijing Normal University. His research interest is vegetation monitoring by remote sensing.
Acknowledgments
This work is financially supported by the State Key Laboratory of Earth Surface Processes and Resource Ecology under Grant 2013-RC-02.
References
- Kato, S.; Yamaguchi, Y. Analysis of Urban Heat-island Effect using ASTER and ETM+ Data: Separation of Anthropogenic Heat Discharge and Natural Heat Radiation from Sensible Heat Flux. Remote Sens. Environ. 2005, 99 (1–2), 44–54.
- Cao, X.; Onishi, A.; Chen, J.; Imura, H. Quantifying the Cool Island Intensity of Urban Parks Using ASTER and IKONOS Data. Landscape Urban Plan. 2010, 96 (4), 224–231.
- Southworth, J. An Assessment of Landsat TM Band 6 Thermal Data for Analysing Land Cover in Tropical Dry Forest Regions. Int. J. Remote Sens. 2004, 25 (4), 689–706.
- Zhan, W.; Chen, Y.; Zhou, J.; Li, J.; Liu, W. Sharpening Thermal Imageries: A Generalized Theoretical Framework from an Assimilation Perspective. IEEE Trans. Geosci. Remote Sens. 2011, 49 (2), 773–789.
- Kustas, W.P.; Norman, J.M.; Anderson, M.C.; French, A.N. Estimating Subpixel Surface Temperatures and Energy Fluxes from the Vegetation Index–radiometric Temperature Relationship. Remote Sens. Environ. 2003, 85 (4), 429–440.
- Agam, N.; Kustas, W.P.; Anderson, M.C.; Li, F.; Neale, C.M.U. A Vegetation Index Based Technique for Spatial Sharpening of Thermal Imagery. Remote Sens. Environ. 2007, 107 (4), 545–558.
- Dominguez, A.; Kleissl, J.; Luvall, J.C.; Rickman, D.L. High-resolution Urban Thermal Sharpener (HUTS). Remote Sens. Environ. 2011, 115 (7), 1772–1780.
- Yang, G.; Pu, R.; Zhao, C.; Huang, W.; Wang, J. Estimation of Subpixel Land Surface Temperature Using an Endmember Index Based Technique: A Case Examination on ASTER and MODIS Temperature Products over a Heterogeneous Area. Remote Sens. Environ. 2011, 115 (5), 1202–1219.
- Jing, L.H.; Cheng, Q.M. A Technique Based on Non-linear Transform and Multivariate Analysis to Merge Thermal Infrared Data and Higher-resolution Multispectral Data. Int. J. Remote Sens. 2010, 31 (24), 6459–6471.
- Gao, F.; Kustas, W.P.; Anderson, M.C. A Data Mining Approach for Sharpening Thermal Satellite Imagery over Land. Remote Sens. 2012, 4 (11), 3287–3319.
- Zhan, W.; Chen, Y.; Zhou, J.; Wang, J.; Liu, W.; Voogt, J.; Zhu, X.; Quan, J.; Li, J. Disaggregation of Remotely Sensed Land Surface Temperature: Literature Survey, Taxonomy, Issues, and Caveats. Remote Sens. Environ. 2013, 131, 119–139.
- Chen, X.; Yamaguchi, Y.; Chen, J.; Shi, Y. Scale Effect of Vegetation-index-based Spatial Sharpening for Thermal Imagery: A Simulation Study by ASTER Data. IEEE Geosci. Remote Sens. Lett. 2012, 9 (4), 549–553.
- Chen, X. Application of Spatial Features to Classification, Segmentation, and Sharpening in Remotely Sensed Images. Ph.D. Thesis, Nagoya University, 2012.
- Agam, N.; Kustas, W.P.; Anderson, M.C.; Li, F.; Colaizzi, P.D. Utility of Thermal Sharpening over Texas High Plains Irrigated Agricultural Fields. J. Geophys. Res. 2007, 112 (D19), 110. http://onlinelibrary.wiley.com/doi/10.1029/2007JD008407/abstract (accessed Feb 14, 2014).
- Quan, J.; Zhan, W.; Chen, Y.; Liu, W. Downscaling Remotely Sensed Land Surface Temperatures: A Comparison of Typical Methods. J. Remote Sens. 2013, 17 (2), 361–387.
- Anderson, M.C.; Kustas, W.P.; Norman, J.M.; Hain, C.R.; Mecikalski, J.R.; Schultz, L.; González-Dugo, M.P.; Cammalleri, C.; d'Urso, G.; Pimstein, A.; Gao, F. Mapping Daily Evapotranspiration at Field to Global Scales Using Geostationary and Polar Orbiting Satellite Imagery. Hydrol. Earth Syst. Sci. Discuss. 2010, 7, 5957–5990.
- Weisberg, S. Applied Linear Regression; Wiley: New York, 1985.
- AIST. Feature GEO Grid Innovation in Global Earth Observation. AIST Today Int. Ed. 2007, 26, 2–11.

