Abstract
Much attention has been given to address public health policy in Saudi Arabia, particularly for the management, quality, and coverage issues. However, assessment of spatial patterns, distribution, and provision of public health services has been neglected. This paper analyzes the availability and accessibility of public health facilities across Riyadh Governorate, Saudi Arabia at the subnational level. Spatial and attribute data of public health facilities potentially have been analyzed using GIS to produce accurate measure of accessibility. The spatial pattern of service distribution was examined using average nearest neighbor. Distances from demand points (populations) to providers (facilities) were calculated for each district using near analysis. In addition, the ratios of public health facility to population were calculated to identify underserved and overserved areas. The findings clearly indicate that the spatial pattern of the distribution of public health facilities was significantly clustered (p value < 0.001) with Z-score of −10.9. Several districts within the central parts of the governorate were identified as having a higher density of facilities, while most of districts that are located in the marginal parts exhibit very low density of health facilities. Overall, there was a considerable variation in the average distance from district centroids to health facilities. Substantially, less than half of the population (45.4%) living in 61 districts has access to public health facility within less than 1-km distance. In contrast, the greatest increase in distances was observed for 6% of population living in 38 districts. People that live in such districts need to travel long distances for public health care. The output of this analysis can assist policy-makers and authorities of Riyadh Governorate in planning public health delivery.
1. Introduction
Health facility distribution in urban areas is the core idea of health utility delivery within greater cities. Exploring and analyzing the spatial relationship between locations of health centers and geographic accessibility to those centers have been for long time an important factor for decision-makers, planners, and health care systems (Perry and Gesler Citation2000; Langford and Higgs Citation2006; Linard et al. Citation2012). Decision to locate health facilities is essential particularly in providing population groups with the basic health needs. Furthermore, successful decision in locating health centers should target reducing inequality of health supplies. However, variations in health facility coverage occur at different geographic levels (e.g. block, neighborhood, district, municipality, or governorate level).
GIS has a potential role in assessing the geographic distribution of health services, in particular evaluating the effectiveness of health facility coverage relevant to population density. Various GIS analytical tools have been used widely to recognize spatial patterns of distribution of existing health facility and find out new optimal location of facilities. For instance, average nearest neighbor as a spatial statistical tool has been used to identify cluster, dispread, and random distribution of health facilities over space (Hazrin et al. Citation2013). Hotspot analysis also has been applied to recognize significant cluster of higher or lower density of health facilities. Likewise, buffer zone analysis was used to investigate spatial distribution of health units. Advanced techniques, such as geographically weighted regression were used to explore non-static relationship between socioeconomic variables and access to health centers (Comber, Brunsdon, and Radburn Citation2011).
The essential goal and vision of Ministry of Health in Saudi Arabia is to improve the equability, standards, availability, and quality of care in the Kingdom areas and governorates. Furthermore, the ministry has been establishing an effective strategy to provide health services at all levels of care and to measure the performance of health care delivery (Ministry of Health Citation2015). Debate continues about the best strategies for the delivery of health care of population in urban administrative areas. The number of public or private health facilities per 10,000 population living in an administrative area is an important indicator for equity in health service supplies (WHO Citation2010). Thus, this indicator can be used to identify areas with higher and lower coverage and allows for comparison between urban districts. In addition, this measurement has an effective role for planners and decision-makers to improve access to health services within the national health agenda. So far, however, there has been little detailed investigation of spatial characteristics of health facilities in Riyadh districts, particularly geographic patterns and accessibility. The main aim of this study is to provide an overview of the spatial patterns of health facility distribution and to investigate the relationship between health facility locations and population size of urban districts of Riyadh Governorate. Spatial analysis techniques within GIS environment provide analytical capabilities to explore health service delivery and examine whether there is a significant variation among districts in public health provision and accessibility.
2. Related work
Inequitable spatial distribution of health facilities has been recognized in both developed and developing countries (Yang, Goerge, and Mullner Citation2006). Inequity in spatial accessibility of health services in rural vs. urban has been proved and reported. For instance, Hu et al. (Citation2013) assessed geographic accessibility to health services in rural China. He found that people living in the edge of villages as well as those living in remote and isolate areas face difficulties in access to health services. Moreover, several contextual spatial and socioeconomic factors have been investigated to examine the effectiveness of health delivery system. In this case, spatial analysis using GIS methods indicated that households with low income and ethnicity may not have access to needed health services in urban areas (Guerrero and Kao Citation2013). Therefore, socioeconomic characteristics of populations might influence integrated health facilities. According to the efforts made to reduce neonatal mortality in the developing countries, Mälqvist et al. (Citation2010) investigated the interrelationships between household locations, nearest health service delivery, and neonatal mortality in Vietnam. The study concluded that higher risk of increasing neonatal death is found much related to households living farther away from health care facilities. Consequently, distance to the closest health facility was an important factor influencing neonatal mortality, particularly for mothers who belong to low socioeconomic classes. A review study reported various spatial analysis measures of health facility accessibility including provider-to-population ratios, travel impedance to nearest provider, average travel impedance to nearest provider, and gravity models (Guagliardo Citation2004). The first kind of measure was identified as the most popular type of analysis since it does not require highly GIS–sophisticated methods. The second measure is well known as a travel cost analysis and it could be applied for rural areas where people’s choice to access to health centers is often very limited. The third type of analysis is based on combining both accessibility and availability, and the distance from population or patients to facility points is summed and averaged. The final type is similar to the previous type as it also combines accessibility and availability in the measurement. However, it provides accurate result of the interaction between population points and any service center within a specific distance.
Numerous studies have attempted to measure the distance from patient point to health facility centers, for instance, measuring the accessibility to health care locations (Müller et al. Citation1998; Mobley and Frech Citation2000; Noor et al. Citation2003; Jones et al. Citation2010) and travel time to health services (Lovett et al. Citation2002; Moïsi et al. Citation2010; Okwaraji et al. Citation2012). Calculating pre-hospital times along road networks using GIS tools was a valuable approach to evaluate patient access to emergency medical service (Patel et al. Citation2012). Hence, patient travel time is a very important factor for predicting accessibility of health services. Spatial distribution of methadone treatment clients in Hong Kong was analyzed using GIS (Wong, Lee, and Lin Citation2010). The authors concluded that among different travel modes to clinic centers, walking was the commonest one. Although no distance decay impact on traveling time was found, new convenient clinic locations were needed to ensure effective maintenance. It has been demonstrated that the geographic areas with limited accessibility to health care facilities are similar in their spatial characteristics (Delamater et al. Citation2012). For instance, access to services in suburban areas is better than that in urban neighborhoods in terms of travel time as travel speed is slower in urban places compared to rural and suburban places (Wang and Luo Citation2005). However, people living in isolated communities that are located faraway from large cities encounter challenges in access to health facilities and hospitals. Consequently, distance cost of service is increasing and often lower proportion of patients tends to use services at greater distance from their dwellings (Arcury et al. Citation2005).
In addition, various GIS techniques were used to measure inequity in geographic accessibility, particularly simple ratio of supply to demand and distance to closest facility as simple methods. Likewise, Web–GIS applications for health care services have been grown rapidly relying on using internet tools to identify service locations (Bonnici Citation2005; Mesgari and Masoomi Citation2008; Tulpan et al. Citation2012). In this field, using internet capabilities to share health data has been carried out to create effective database of health system (Theseira Citation2002). Abbas et al. (Citation2009) introduced a district management system for Allahabad Sadar sub-district in India and GIS techniques were employed to obtain spatial information about flood disaster impacts. Similarly, GIS-based tools have been used successfully to assess and model public health issues particularly wastewater and water resources (Oosting and Joy Citation2011). These results are supported by extensive work on applying different advanced GIS methods, in particular modeling of health service and facilities. For example, Schuurman et al. (Citation2006) have carried out analysis of modeling travel time catchments for hospitals that are located in rural and remote areas in British Columbia province, Canada. As a further instance of this, an innovative health system for serving pregnant women was introduced (Ismaeel and Jabar Citation2013). The system relays on mobile GIS and web tools to select the nearest hospital or maternity center. Once the registered pregnant woman sends SMS via the network to the system, her coordinated and attribute data would be identified. Thus, her information would also be sent to the closest hospital or maternity center as an emergency case.
Yagoub (Citation2011) assessed the distribution of health facilities in Al Ain city, UAE in relation to the effects of climatic conditions, particularly temperature, on diseases. Spatial statistical methods, such as nearest neighbor index, K function, and geometric center were used to evaluate the spatial distribution of health facilities. The study examined the spatial pattern of distribution of health facilities and found that pattern was randomly distributed across Al Ain City. Recent evidence suggests that there has been a relationship between community health resources and contextual attributes of neighborhoods. Spatial variation in access to health facility was found to be significant between rural and urban areas. Likewise, differences in access to health clinics were reported between urban districts (Pearce, Witten, and Bartie Citation2006). Murad (Citation2004) discussed how GIS can be used to support health facility planning and management. The study introduced a GIS application for local health care planning in Makkah city and modeled the spatial relationship between catchment area and patient distribution. The findings have revealed that the health supply of the existing facility did not match the available demand. The utility of GIS functions has been used also in the planning of health services in Jeddah city, Saudi Arabia particularly to address spatial distribution of health demand, classification of hospital patients, and determining of hospital catchment areas (Murad Citation2007, Citation2008). In a review study about the quality of primary care in Saudi Arabia, it has been shown that spatial variations of health care quality were significant and much effort needs to be done to improve the management of health services (Hanan and Roland Citation2005). Al-Ghanim (Citation2004) pointed out that there were different socioeconomic and geographic variables affecting the utilization of public and private health care services in Riyadh Governorate. Patient-related variables are education level, income, health status, and gender, while service provider variables are waiting times, opening hours, availability of specialists, and location of facilities. Several challenges have been currently facing Saudi’s health care system, in particular lack of subnational health system and incorporating GIS methods in planning of health facilities distribution across regional and sub-regional administrative units (Almalki, Fitzgerald, and Clark Citation2011). This paper performed GIS analysis to conduct a spatial assessment of service provision and accessibility. This assessment aims to provide accurate information on the distribution pattern, equity, utility, and availability of public health facilities across Riyadh Governorate. Obviously, measuring level of geographic accessibility to health resources using population size indicator contributes to the debate of spatial equity in access to health services within urban areas.
3. Study area and data-set
3.1. Study area
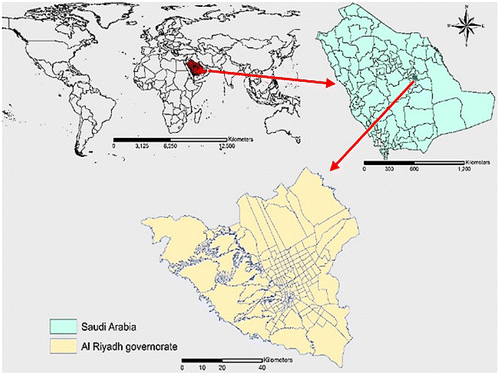
The study area is the urban districts of Riyadh Governorate in Saudi Arabia. It is the capital of Riyadh region and is considered as one of largest cities of Saudi Arabia (Figure ). It belongs to the historical regions of Najd and Al-Yamama which are located in the center of Arabian Peninsula on a large plateau. In 2014, population of Riyadh Governorate reached almost 6 million, i.e. 5,999,434 inhabitants including the non-national population of 2,512,182 (Central Department of Statistics & Information Citation2015).
According to the High Commission for the Development of Riyadh, the governorate area size is 5144.8 km² and the area of urban settlements is 1298 km² including road network area. The administrative boundary of the governorate is divided into 18 municipalities and 208 districts. Each municipality includes several districts except Khashemalan and King Khaled Airport municipalities where each one has just one district. Al Malaz and Batha municipality has the largest district number (34), which is followed by Dereah (24) and Adderah (18). Districts of Olaya are the commercial heart of Riyadh city where accommodation, entertainment, dining and shopping malls, and social and health services are located.
3.2. Data and materials
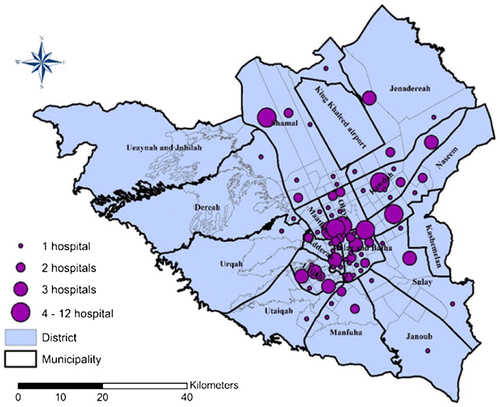
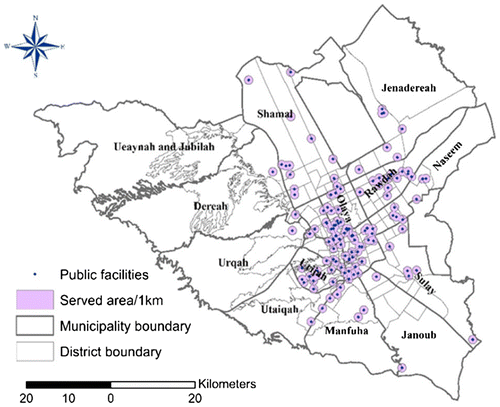
Data on public health facilities were obtained and analyzed within GIS environment. Statistical data about population were gathered from the Central Department of Statistics & Information which is responsible for conducting censuses and demographic surveys in Saudi Arabia. Population number in each district of Riyadh was available and provided according to 2004 census. The spatial data-set was obtained from the High Commission for the Development of Riyadh. Public health facility is a point layer which defines the latitude and longitude of health service locations. Other two layers in the form of polygon represent the administrative boundaries of district and municipality levels. The attribute data were aggregated and joined the spatial layer of district boundary. The total number of all health facilities across Riyadh Governorate was 1395 in 2012 with a total area size of 5.1 km², while the number of public health facilities (centers) was 141 (Figure ). The total number of governmental hospitals is 31, while the primary care and other health clinics account for 110 centers.
4. Methods
4.1. Average nearest neighbor
The average nearest neighbor is a measure of the distance between each spatial feature and its nearest neighbor centroids. All these distances are then averaged and compared with a hypothetical random distribution. If the averaged distances of an observed distribution are less than the average of a hypothetical random (expected distribution), the spatial pattern of features being analyzed (the observed) is considered clustered. The value of the average nearest neighbor ratio in this case is less than one. On the other hand, if the average distance is greater than the expected distribution, the spatial pattern is considered dispersed. The value of the average nearest neighbor ratio in this case is larger than one (ESRI Citation2015). The average nearest neighbor ratio is calculated based on dividing the observed distances by the expected distances with the same number of features covering the same study area. The equations used to calculate the average nearest neighbor distance index are as follows (Chen and Getis Citation1998):
| (a) | The mean nearest neighbor distance. | ||||
(1)
where N is the number of points while di is the nearest neighbor distance for point i.
| (b) | The expected value of the nearest neighbor distance in a random pattern. | ||||
(2)
where A is the area and B is the length of the perimeter of the study area.
| (c) | The variance. | ||||
(3)
4.2. Euclidean distance
The Euclidean distance measures each point relationship to a source or a set of sources based on a straight-line distance. The formula for this distance measure between a point X (X1, X2, etc.) and a point Y (Y1, Y2, etc.) is as follows:(4)
Applying this formula to measure the distance between two points involves computing the square root of the sum of the squares of the differences between corresponding values. Within GIS environment, Euclidean distance is calculated from the center of the source cell to the center of each of the surrounding cells and the output is a raster layer that contains the measured distance from every cell to the nearest source in projection units, such as feet or meter.
4.3. Zonal statistics
For each polygon (administrative unit such as district or municipality), this tool generates a summary of the values from another data-set in a raster layer that falls within the bounds of each zonal area (i.e. mean, standard deviation, and sum). For instance, the standard deviation of the values in each zone is assigned to all cells in that zone based on the following formula:(5)
4.4. Near analysis
The Near tool within ArcGIS was used to determine the distances from each district to the nearest public health facility. The Near tool determines the Euclidean distances between the input features (district centroids) and the near features (public health facilities). A new layer of district centroid was created and distances from these points to nearest public health facilities were calculated. All calculated distances were expressed in unit of km.
5. Results and discussion
5.1. Examining the spatial pattern of public health facilities
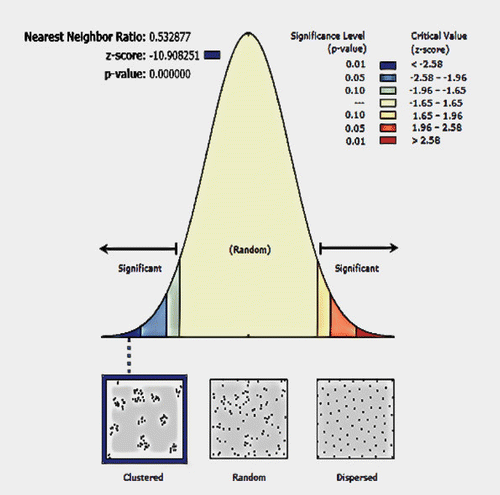
To assess the spatial pattern of distances among public health facilities, the Average Nearest Neighbour tool within ArcGIS 10.2 was used and the finding revealed that public health facilities across Riyadh districts were spatially clustered (Figure ). The average nearest neighbor ratio was 0.53 (p < 0.001) and the Z-score was −10.9 (p < 0.001). Consequently, the null hypothesis of no spatial pattern among public health facilities in Riyadh districts was rejected. Due to the large Z-score, there was less than 1% likelihood that this clustered pattern could be the result of random chance.
Overall, the concentrated spatial pattern of public health facilities tends to be in districts that are located in the middle of the governorate. However, the identified spatial pattern in this analysis indicated disorderly and inefficient distribution of public health services. For instance, the districts within municipalities that are located in the south (e.g. Hayer, Uraid, and Heet) and southeast (e.g. Genadereah and Khashemalan) have very low number of public health facilities (Figure ). Similarly, very low number of health facilities was identified in the north-western districts. These districts by far have the smallest number of residents and they are subjected to urban expansion and new housing construction.
5.2. Facilities under and over coverage
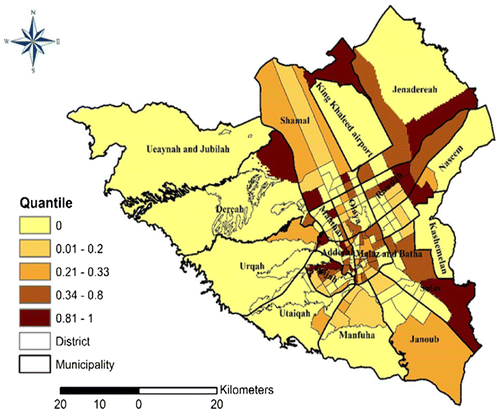
Relatively under-coverage areas can be defined as districts with a public health density within the lowest quantile of all health facility densities (public and private) across districts. On other hand, relatively over-coverage area is defined as districts with a public health density within the highest quantile of all health facilities densities across all districts. Most importantly, the under- and over-coverage analysis is a comparative and should not be considered as resource availability analysis (Schwanke Khilji et al. Citation2013). Spatial resource distribution for public health facilities was analyzed at district level to identify districts of relatively under and over coverage. The output of this analysis (Figure ) revealed that a higher number of districts reported zero quantities of public health facility density relative to the total number of all health centers across the districts. The majority of districts (130 out of 208) can be classified as areas with no public health provision and they account for 62.5% of all districts. A total of 14 districts have very low density of public health (less than 25% of their total health centers). Similarly, 24 districts show less than 50% of their total health centers as public health facilities. All these districts meet the criteria of relatively under coverage. Geographic location of districts with under-coverage public health facilities can be recognized in the north and northern west of Riyadh. Only 30 districts can be classified as over-coverage and most of them are located in the middle, south, and southeast of Riyadh Governorate.
5.3. Spatial accessibility of public health facilities
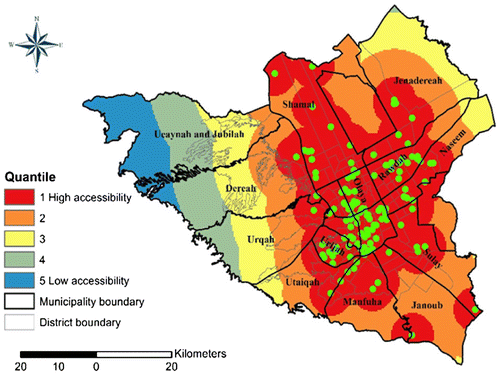
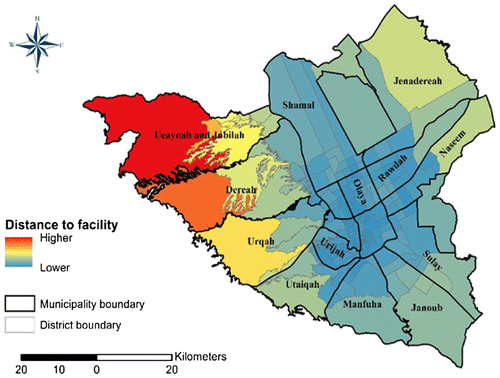
The simplest concept of spatial accessibility for given utility locations potentially depends on how easy it is to reach the location. In order to assess the spatial accessibility of health facilities across all districts, Euclidean distance tool in ArcGIS 10.2 was used to calculate distances to district boundaries. In addition, the zonal statistics tool was used to calculate the average distance value of all distributed public health facilities (Figure ). Access to public health facilities in Riyadh varied by district boundaries. In general, the least accessible facilities were found in the marginal districts, in particular the far west, south, and east parts of the Riyadh Governorate especially in districts within Khashemalan, Sulay, Janoub, and Manfuha municipalities (Figure ). By contrast, the most accessible districts were located in the middle of the governorate with variation in density of these facilities. This means that going farther to the city center, the distance to public health facility decreases and access facility is higher as it is in the majority of districts within Olaya, Rawdah, Urijah, Malath, and Batha municipalities.
Investigating proximity to public health facilities, a buffer analysis was applied and a buffer zone with radius of 1 km was created around all public health centers within the study area (Figure ). The finding of this analysis indicated that most districts of eastern north, western north, south, and western south of Riyadh are located outside of the 1-km catchment zone. Most districts of Shamal, Dereah, Urqah, Utaiqah, Manfuha, Janoub, and Khashemalan municipalities were determined to have a low public health accessibility. Consequently, additional public health facilities need to be located within these areas.
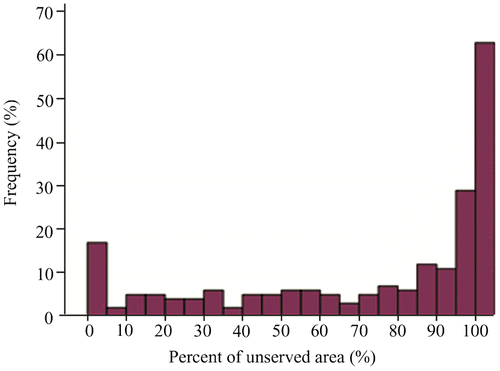
Figure is a histogram that shows the frequency distribution of percent of unserved areas (within 1-km buffer zone) in Riyadh districts. The chart demonstrates that more than 60 districts lack access to near public health facilities within this distance (100% of area zone is unserved) and 90% of 40 districts’ area zones have not covered with public health service within the same distance. Similarly, 32 districts reported between 50 and 80% unserved areas within the same buffer zone. Moreover, 26 districts have between 50 and 20% of their areas uncovered with public health services and 22 districts exhibit less than 20% of their areas unserved with public health facilities. Only 7 districts are served completely with public health centers within 1-km buffer radius.
5.4. Public health facilities to population ratios
Providing an appropriate number of public health facilities at each administrative urban unit is certainly a main concern of most health planners. Furthermore, analyzing health facility to population ratio is essential for every government to enable policy-makers to determine how best to meet the health basic needs of population. Provider to population ratios also differ enormously both across rural areas and between rural and urban districts. The geographic aspects of health delivery system have direct influences on allocation of health resources. Thus, health service units should be geographically adeptly distributed according to population concentration and density. However, and generally, most of instruments related to population focus upon different proxies in particular physician/ population ratios (e.g. Shi and Starfield Citation2001; Luo Citation2004; Bigbee Citation2008). Health facility distribution per 10,000 population is a useful standardized indicator in measuring levels of health services accessibility by population living within a geographic administrative unit. In addition, this measure allows comparison between spatial units and identification of gaps in health service coverage across the study area (WHO Citation2010). The indicator of distribution of health facilities per 10,000 population was calculated simply by: 10,000 × (Number of public health facilities/Total population in each district).
The output of this analysis is presented in Figure and it can be seen that greater number of districts shows zero ratio. In the same way, several districts have lower ratios with less than one facility per 10,000 population. The vast majority of those districts are located in the northern, southern, and eastern parts of Riyadh and they are not well served by public health facilities. Correspondingly, many districts located in the middle parts have large population size but exhibit limited provision of public health facilities. In contrast, higher facility ratio can be identified in districts located essentially in the middle parts of Riyadh. For instance, most districts of Olaya, Batha and Malaz, Adderah, and Shamal municipalities demonstrate higher facility ratio (1–2.4). As a result, this pattern of the spatial distribution of health facility per population reflects imbalance of health care facilities and therefore situation, from health planning perspective, fails to achieve ultimate equity in public health coverage based on population size.
Figure 9. Population to health facility ratio (districts with very low population size are geographically very large).
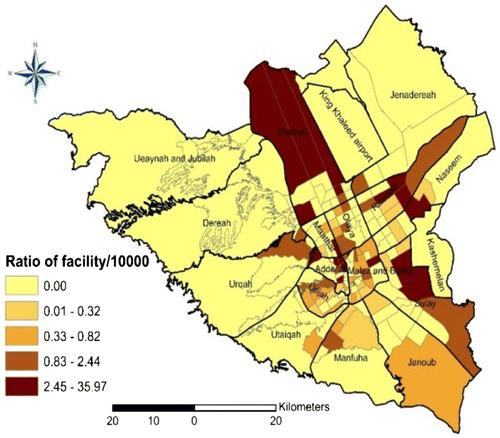
From this analysis, it was noted that the distribution of facility per population ratio varies considerably throughout Riyadh districts. However, the low facility ratio in most marginal and distant districts perhaps is due to the districts being relatively newly constructed with low population size as it is in districts of Samal, Jenadereah, and Dereah municipalities.
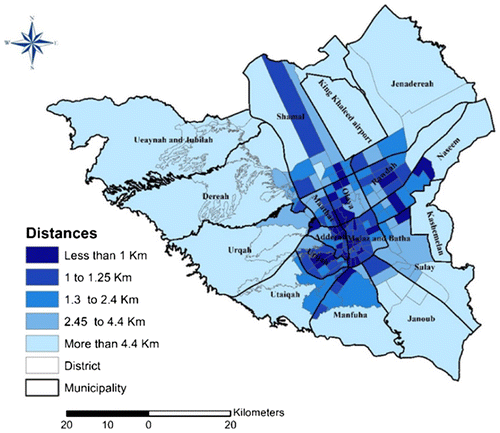
The Near tool in ArcGIS was used to measure the distance from each district centroid to the nearest public health center. These distances were converted into unit of km to identify districts beyond specific distances from health facility location (Figure ).
In terms of accessibility relative to population, our analysis indicated that 45.4% of Riyadh residents distributed across 61 districts live within 1-km distance from the nearest public health facility. Approximately, less than a third of population (29.6%) distributed over 54 districts is living further away from the nearest facility by a distance greater than 1 km and less than 2 km. Almost 19% (18.95%) of population live away from the nearest facility at a distance greater than 2 km and less than 5 km and those population live within 55 districts. Relatively, further proximity to health facilities can be identified in 17 districts where 5.3% of population live in long distances (from 5 km to above 10 km) away from the nearest public facility. By far, less than 1% of population (0.67%) distributed over 21 districts are living within greater than 10 km from the nearest health facility.
6. Conclusions and outlook
The promotion of governmental health facilities plays a vital role in ensuring health delivery and well-being of community. Therefore, providing public health service based on population location is essential and simply a matter of social policy. Likewise, equity of health access and provision within urban areas require measuring several factors, such as availability, quality, travel, and distance from provider to population. In the health aspect, the Saudi development plans give comprehensive attentions to providing all people living in the Kingdom (Saudi and non-Saudi citizens) with the free basic health care services (MEP Citation2015). Thereby, the main achievement of the ninth development plan on health issue is embodied by the improvement of health service and provision throughout expanding more health infrastructure. In addition, the plan aims to increase the number of hospital beds, physicians, nurses, and ancillary medical staff and reducing the rates of various infectious diseases. However, for successful implementation of public health service, spatial measurements need to be included in the planning policy especially facility allocation and service provision.
The main goal of our study was to accomplish a spatial assessment of public health service across Riyadh Governorate. Inequalities in public health service across the governorate were measured using various GIS methods. These methods offer the opportunity to addressing spatial variation of equity in access to public health facilities at the subnational level. This study has contributed significantly to the field of health facility distribution and provision and more importantly to inequalities of service availability according to population size and geographic distances. The findings of this study clearly revealed that there was a cluster pattern of public health facility distribution. Several districts were identified as underserved by public health facility and many districts were identified as lower density of public health provision. Distances from population to providers (facilities) were also examined and the result indicated that less than half of Riyadh’s population has access to facility within 1-km distance. Despite this, long distances to public health facilities appeared to be problematic for 6% of the total population living within 38 districts across the governorate. Furthermore, the low concentration of facilities increases away from the central part of the governorate and residents living farther from the middle parts have lower access to public health facilities. Thus, people living in such districts are more likely to not have a regular source of public medical care. The shortage of public health care certainly increases travel times and distances to access health clinic. It should be noted however, that the lack of sufficient public health coverage in some districts, located in the marginal parts of governorate, may be due to either the small population size or because the basic infrastructure of these districts is still under development.
Given the significance of public health shortage within lower distances, policy-makers may consider placing additional health facilities to reduce the distance (improve the accessibility) to health services. The health plan of the Saudi Government should emphasize increasing access to primary care services for new urban communities. The new health facilities must be located in the marginal and underserved districts. Such planned facilities are required to be located and distributed according to geographic distance and time accessibility.
This study was limited by the absence of attribute data and statistics on hospital beds, physicians, and nurses per population at district level. Furthermore, it was not possible to assess accessibility to public health facilities according to temporal distances since data of travel time on road networks are not available. More realistic however, the findings of this analysis about Riyadh Governorate have not previously been reported. Future work will make use of travel times when they are available and it can be used to enhance the current accessibility measure by the inclusion of more spatial and attribute variables.
Notes on contributors
Shawky Mansour is an assistant professor in the Department of Geography and GIS, Faculty of Arts, Alexandria University, Egypt. He is a specialist in GIS and spatial analysis with particular interest in using and developing new GIS tools to model and analyze the interrelationships between socioeconomic, environmental, and demographic phenomena.
References
- Abbas, S. H., R. K. Srivastava, R. P. Tiwari, and P. B. Bala Ramudu. 2009. “GIS-based Disaster Management: A Case Study for Allahabad Sadar Sub-district (India).” Management of Environmental Quality: An International Journal 20 (1): 33–51. doi:10.1108/14777830910922433.
- Al-Ghanim, S. A. 2004. “Factors Influencing the Utilisation of Public and Private Primary Health Care Services in Riyadh City.” JKAU: Econ & Adm 19 (1): 3−27.
- Almalki, M., G. Fitzgerald, and M. Clark. 2011. “Health Care System in Saudi Arabia: An Overview.” Eastern Mediterranean Health Journal 17 (10): 784–793.
- Arcury, T. A., Wilbert M. Gesler, J. S. Preisser, J. Sherman, J. Spencer, and J. Perin. 2005. “The Effects of Geography and Spatial Behavior on Health Care Utilization Among the Residents of a Rural Region.” Health Services Research 40 (1): 135–156.10.1111/hesr.2005.40.issue-1
- Bigbee, J. L. 2008. “Relationships Between Nurse- and Physician-to-Population Ratios and State Health Rankings.” Public Health Nursing 25 (3): 244–252. doi:10.1111/j.1525-1446.2008.00701.x.
- Bonnici, A. M. 2005. Web GIS Software Comparison Framework. Sir Sandford Fleming College, Canada.
- Central Department of Statistics & Information. 2015. “Population Statistics Estimation.” Central Department of Statistics & Information, Saudi Arabia. Accessed December 20, 2015. http://www.cdsi.gov.sa/english/index.php?option=com_docman&Itemid=160
- Chen, D., and A. Getis. 1998. Point Pattern Analysis (PPA). San Diego, CA: Department of Geography, San Diego State University.
- Comber, A. J., C. Brunsdon, and R. Radburn. 2011. “A Spatial Analysis of Variations in Health Access: Linking Geography, Socio-economic Status and Access perceptions.” International Journal of Health Geographics 10: 1–11 . doi:10.1186/1476-072X-10-44.
- Delamater, P. L., J. P. Messina, A. M. Shortridge, and S. C. Grady. 2012. “Measuring Geographic Access to Health Care: Raster and Network-based Methods.” International Journal of Health Geographics 11 : 1–18. doi:10.1186/1476-072X-11-15.
- ESRI (Environmental Systems Research Institute). 2015. “How Average Nearest Neighbor Distance (Spatial Statistics) works.” Accessed December 28, 2015. http://www.esri.com
- Guagliardo, M. F. 2004. “Spatial Accessibility of Primary Care: Concepts, Methods and Challenges.” International Journal of Health Geographics 3: 1–13. doi:10.1186/1476-072X-3-3.
- Guerrero, E. G., and D. Kao. 2013. “Racial/Ethnic Minority and Low-income Hotspots and Their Geographic Proximity to Integrated Care Providers.” Substance Abuse Treatment, Prevention, and Policy 8 (34): 1–10. doi:10.1186/1747-597X-8-34.
- Hanan, A. L.-A., and M. Roland. 2005. “Quality of Primary Health Care in Saudi Arabia: A Comprehensive Review.” International Journal for Quality in Health Care 17 (4): 331–346. doi:10.1093/intqhc/mzi046.
- Hazrin, H., Y. Fadhli, A. Tahir, J. Safurah, M. N. Kamaliah, and M. Y. Noraini. 2013. “Spatial Patterns of Health Clinic in Malaysia.” Health 5 (12): 2104–. 2109doi:10.4236/health.2013.512287.
- Hu, R. S., S. C. Dong, Y. H. Zhao, H. Hu, and Z. H. Li. 2013. “Assessing Potential Spatial Accessibility of Health Services in Rural China: A Case study of Donghai County.” International Journal for Equity in Health 12 (1): 1–11. doi:10.1186/1475-9276-12-35.
- Ismaeel, A. G., and E. K. Jabar. 2013. “Effective System for Pregnant Women using Mobile GIS.” International Journal of Computer Applications 64 (11): 1–7. doi:10.5120/10675-5547.
- Jones, S. G., A. J. Ashby, S. R. Momin, and A. Naidoo. 2010. “Spatial Implications Associated with Using Euclidean Distance Measurements and Geographic Centroid Imputation in Health Care Research.” Health Services Research 45 (1): 316–327. doi:10.1111/j.1475-6773.2009.01044.x.
- Langford, M., and G. Higgs. 2006. “Measuring Potential Access to Primary Healthcare Services: The Influence of Alternative Spatial Representations of Population.” The Professional Geographer 58 (3): 294–306. doi:10.1111/j.1467-9272.2006.00569.x.
- Linard, C., M. Gilbert, R. W. Snow, A. M. Noor, and A. J. Tatem. 2012. “Population Distribution, Settlement Patterns and Accessibility across Africa in 2010.” PLoS ONE 7 (2): e31743. doi:10.1371/journal.pone.0031743.
- Lovett, A., R. Haynes, G. Sünnenberg, and S. Gale. 2002. “Car Travel Time and Accessibility by Bus to General Practitioner Services: A Study using Patient Registers and GIS.” Social Science & Medicine 55 (1): 97–111. doi:10.1016/S0277-9536(01)00212-X.
- Luo, W. 2004. “Using a GIS-based Floating Catchment Method to Assess Areas with Shortage of Physicians.” Health & Place 10 (1): 1–11. doi:10.1016/S1353-8292(02)00067-9.
- Målqvist, M., N. Sohel, T. T. Do, L. Eriksson, and L. A. Persson. 2010. “Distance Decay in Delivery Care Utilisation Associated with Neonatal Mortality. A Case Referent Study in Northern Vietnam.” BMC Public Health 10: 1–9 . doi:10.1186/1471-2458-10-762.
- MEP (Ministry of Economy and Planning). 2015. “Ninth Development Plan, Health.” Ministry of Economy and Planning, Saudi Arabia. Accessed December 28, 2015. http://www.mep.gov.sa/themes/Dashboard/index.jsp#1439498622664
- Mesgari, M. S., and Z. Masoomi. 2008. “GIS Applications in Public Health as a Decision Making Support System and it’s Limitation in Iran.” World Applied Sciences Journal 3 (1): 73–77.
- Ministry of Health. 2015. “National e-Health Strategy.” Ministry of Health, Al Riyadh. Accessed December 28, 2015. http://www.moh.gov.sa/en/Ministry/nehs/Pages/Overview-of-eHealth.aspx
- Mobley, L. R., and H. E. Frech III. 2000. “Managed Care, Distance Traveled, and Hospital Market Definition.” Inquiry 37 (1): 91–107.
- Moïsi, J. C., H. Gatakaa, A. M. Noor, T. N. Williams, E. Bauni, B. Tsofa, O. S. Levine, and J. A. G. Scott. 2010. “Geographic Access to Care is not a Determinant of Child Mortality in a Rural Kenyan Setting with High Health Facility Density.” BMC Public Health 10: 1–9. doi:10.1186/1471-2458-10-142.
- Muller, I., T. Smith, S. Mellor, L. Rare, and B. Genton. 1998. “The Effect of Distance from Home on Attendance at a Small Rural Health Centre in Papua New Guinea.” International Journal of Epidemiology 27 (5): 878–884. doi:10.1093/ije/27.5.878.
- Murad, A. A. 2004. “Creating a GIS Application for Local Health Care Planning in Saudi Arabia.” International Journal of Environmental Health Research 14 (3): 185–199. doi:10.1080/0960312042000218606.
- Murad, A. A. 2007. “Creating a GIS Application for Health Services at Jeddah City.” Computers in Biology and Medicine 37 (6): 879–889. doi:10.1016/j.compbiomed.2006.09.006.
- Murad, A. A. 2008. “Defining Health Catchment Areas in Jeddah City, Saudi Arabia: An Example Demonstrating the Utility of Geographical Information Systems.” Geospatial Health 2 (2): 151–160. doi:10.4081/gh.2008.239.
- Noor, A. M., D. Zurovac, S. I. Hay, S. A. Ochola, and R. W. Snow. 2003. “Defining Equity in Physical Access to Clinical Services using Geographical Information Systems as Part of Malaria Planning and Monitoring in Kenya.” Tropical Medicine & International Health 8 (10): 917–926. doi:10.1046/j.1365-3156.2003.01112.x.
- Okwaraji, Y. B., K. Mulholland, J. R. M. A. Schellenberg, G. Andarge, M. Admassu, and K. M. Edmond. 2012. “The Association between Travel Time to Health Facilities and Childhood Vaccine Coverage in Rural Ethiopia. A Community Based Cross Sectional Study.” BMC Public Health 12: 1–9. doi:10.1186/1471-2458-12-476.
- Oosting, A., and D. Joy. 2011. “A GIS-based Model to Assess the Risk of On-site Wastewater Systems Impacting Groundwater and Surface Water Resources.” Canadian Water Resources Journal 36 (3): 229–246. doi:10.4296/cwrj3603882.
- Patel, A. B., N. M. Waters, I. E. Blanchard, C. J. Doig, and W. A. Ghali. 2012. “A Validation of Ground Ambulance Pre-hospital Times modeled using Geographic Information Systems.” International Journal of Health Geographics 11 (1): 1–10. doi:10.1186/1476-072X-11-42.
- Pearce, J., K. Witten, and P. Bartie. 2006. “Neighbourhoods and Health: A GIS Approach to Measuring Community Resource Accessibility.” Journal of Epidemiology and Community Health 60 (5): 389–395. doi:10.1136/jech.2005.043281.
- Perry, B., and W. Gesler. 2000. “Physical Access to Primary Health Care in Andean Bolivia.” Social Science & Medicine 50 (9): 1177–1188. doi:10.1016/S0277-9536(99)00364-0.
- Schuurman, N., R. S. Fiedler, S. C. W. Grzybowski, and D. Grund. 2006. “Defining Rational Hospital Catchments for Non-urban Areas Based on Travel-time.” International Journal of Health Geographics 5: 1–10. doi:10.1186/1476-072X-5-43.
- Shi, L., and B. Starfield. 2001. “The Effect of Primary Care Physician Supply and Income Inequality on Mortality Among Blacks and Whites in US Metropolitan Areas.” American Journal of Public Health 91 (8): 1246–1250. doi:10.2105/AJPH.91.8.1246.
- Theseira, M. 2002. “Using Internet GIS Technology for Sharing Health and Health Related Data for the West Midlands Region.” Health & Place 8 (1): 37–46. doi:10.1016/S1353-8292(01)00034-X.
- Tulpan, D., M. Mancuso, G. Durand, C. Regoui, and L. Belliveau. 2012. “CliFin: A Web-based Geographical Information System for Time Dependant Point of Care Localization in New Brunswick, Canada.” International Journal of Healthcare Information Systems and Informatics 7 (4): 32–47. doi:10.4018/jhisi.2012100103.
- Wang, F. H., and W. Luo. 2005. “Assessing Spatial and Nonspatial Factors for Healthcare Access: Towards an Integrated Approach to Defining Health Professional Shortage Areas.” Health & Place 11 (2): 131–146. doi:10.1016/j.healthplace.2004.02.003.
- WHO. 2010. “Monitoring the Building Blocks of Health Systems: A Handbook of Indicators and Their Measurement Strategies.” Geneva: WHO. Accessed December 28, 2015. http://www.who.int/healthinfo/systems/WHO_MBHSS_2010_full_web.pdf
- Wong, N. S., S. S. Lee, and H. Lin. 2010. “Assessing the Spatial Distribution of Methadone Clinic Clients and Their Access to Treatment.” Harm Reduction Journal 7: 1–6. doi:10.1186/1477-7517-7-14.
- Yagoub, M. M. 2011. “Geographic Information Systems (GIS) Application for Health: Case of Al Ain (UAE).” International Journal of Geoinformatics 7 (1): 21–28.
- Yang, D. H., R. Goerge, and R. Mullner. 2006. “Comparing GIS-based Methods of Measuring Spatial Accessibility to Health Services.” Journal of Medical Systems 30 (1): 23–32. doi:10.1007/s10916-006-7400-5.
- Schwanke Khilji, S. U., J. W. Rudge, T. Drake, I. Chavez, K. Borin, S. Touch, and R. Coker. 2013. “Distribution of Selected Healthcare Resources for Influenza Pandemic Response in Cambodia.” International Journal for Equity in Health 12 (1): 1–14. doi:10.1186/1475-9276-12-82.

