
ABSTRACT
Volunteered geographic information (VGI) has entered a phase where there are both a substantial amount of crowdsourced information available and a big interest in using it by organizations. But the issue of deciding the quality of VGI without resorting to a comparison with authoritative data remains an open challenge. This article first formulates the problem of quality assessment of VGI data. Then presents a model to measure trustworthiness of information and reputation of contributors by analyzing geometric, qualitative, and semantic aspects of edits over time. An implementation of the model is running on a small data-set for a preliminary empirical validation. The results indicate that the computed trustworthiness provides a valid approximation of VGI quality.
1. Introduction
Volunteered geographic information (VGI) (Goodchild Citation2007) is a form of user-generated content (UGC) that is primarily concerned with the survey, collection, and dissemination of spatial data. Recently, VGI projects gained increasing attention and, as a consequence, their user basin increased notably. Several studies showed that while VGI coverage and quality is approaching that of authoritative data-sets (in areas with large number of volunteers), VGI quality is not homogeneously distributed in space (Haklay Citation2010; Mooney, Corcoran, and Winstanley Citation2010). Accordingly, the conception and implementation of new methods to assess VGI quality is highly needed (Elwood, Goodchild, and Sui Citation2013).
In general, data quality can be regarded as the level of fitness between single pieces of data and the parts of reality that these represent – i.e. the more precisely data corresponds to reality, the higher its quality.
Thus, the only way to obtain the “true” quality value of data would be to compare it to reality, but this is impracticable because data and reality belong to two different spaces (conceptual and physical, respectively). In practice, data quality is typically evaluated with respect to four main dimensions: accuracy, completeness, consistency, and timeliness (Wand and Wang Citation1996).
There are two main approaches to assess VGI data quality. The first one assumes that authoritative data are quality data. Thus, it consists in comparing volunteered against authoritative data-sets and addresses three of the four dimensions mentioned above: accuracy, completeness, and consistency. One main drawback of this approach is that it requires the access to authoritative data, which might not be possible because of limited data availability, licensing restrictions, or high procurement costs (Antoniou and Skopeliti Citation2015). Moreover, while authoritative data are regarded as quality data, in fact there is no absolute guarantee about its correctness and consistency, especially considering the discrepancies between data and reality that arise over time because of the slow update rate of authoritative data-sets. The second approach aims at assessing the quality of VGI by analyzing the evolution of the data itself, i.e. its history or provenance. This approach overcomes the limitations of the previous one as it does not require external data sources and can also take into account the timeliness dimension. However, this approach provides an approximation of the quality, rather than an accurate measurement. In other words, it provides a proxy measure for data quality that is referred to as trustworthiness (Dai et al. Citation2008).
This article presents a system to compute a trustworthiness score for each version of a geographic feature by analyzing its provenance and evolution. Typically, in the literature, provenance is defined as the historical evolution of data over time, but in the scope of this work we distinguish between data provenance and data evolution. Fixed a point in time, by provenance we intend the sequence of edits that a feature undergoes over time until the given time instant; by evolution we intend the edits that the feature will undergo in the future. The edit sequence of a feature over time is assumed to be implemented through versioning. Both provenance and evolution include authoring information. Accordingly, our system computes two scores: (1) reputation is a score that is associated to a volunteer and that denotes her reliability; (2) trustworthiness is a score that is associated to each version of a geographic feature and that depends on both the sequence of edits that the feature undergoes over time and the reputation of its author.
The main underlying idea is that, according to the many eyes principle (Raymond Citation1999), the quality of a feature will improve over time and editing: the more volunteers contribute information about a feature, the higher the probability that errors and inconsistencies are spotted and corrected, and, thus, the higher the probability that the feature is correctly mapped in the VGI system. Such a concept is captured by the notion of confirmation. Approaches to encourage crowdsourcing take into account people’s intrinsic motivation, such as in Martella, Kray, and Clementini (Citation2015).
We distinguish three main effects making up a confirmation: direct, indirect, and temporal. The direct effect corresponds to the case where a new version of a feature is contributed that leaves untouched a subset of the attributes of the current feature version. We assume that this is an indication that the attribute values were already correct, thus the overall trustworthiness of the feature must increase. The indirect effect covers the cases where a feature is edited that is close enough to the feature being confirmed. Since the volunteer only modified the nearby feature, this can be considered as an indication of the quality of the feature being confirmed. Finally, the temporal effect addresses the persistency of a feature version over time, i.e. the longer a version stays untouched, the higher the probability that it is correctly mapped.
Direct and indirect effects are finer divided into three components, to more precisely account for the different aspects characterizing the editing preferences of contributors: thematic, geometric, and qualitative. The first two components have been included in order to model more precisely the skills and the preferences of the volunteers. For example, a volunteer with little or no surveying skills may be more inclined to contribute information only about the thematic component of a geographic feature and leave untouched the geometric part. This means that confirmations generated by these kinds of people must be weighted differently for the geometric and the thematic aspects.
The qualitative aspect has been introduced to address properties of human spatial cognition. Findings in cognitive science (Mark Citation1993) have shown that humans conceptualize space in a relative and qualitative manner, i.e. mental representations of space are typically geometrically distorted, but some qualitative relations among objects (e.g. order, direction, and topology) are interiorized correctly. This means that while a volunteer may be unable to notice a small geometric imprecision in a piece of data, she/he may notice much more easily a wrong qualitative spatial relation (e.g. two disconnected buildings that have been mapped as touching each other).
The rest of the article is structured as follows. In Section 2, we discuss more in detail background work on the subject. Section 3 is the core of our model: we discuss the types of changes that affect VGI data, we define trustworthiness and reputation as the main aspects that influence VGI data quality, and we distinguish among direct, indirect, and temporal effects. In Section 4, we describe a system architecture that implements our model: the resulting framework, called TandR (for Trustworthiness and Reputation), makes use of domain ontologies for data representation. In Section 5, we carried out an experiment with a selected portion of OpenStreetMap (OSM) data (http://www.openstreetmap.org), whose various feature versions were compared to ground truth data to explore how trustworthiness and reputation indexes vary over time following data editing. Section 6 draws short conclusions and highlights future improvements and extensions.
2. State of the art
While VGI is a very successful means to collect geographic information at low cost (Goodchild Citation2007), it suffers a major drawback: VGI comes with no assurance of quality (Goodchild and Li Citation2012). The issue is inherently related to the very nature of VGI, that is provided by volunteers in a relatively unconstrained manner. Indeed, most of the VGI systems currently implemented do not impose any enforcement on their contributors, except for some guidelines to streamline the input data. So, according to the mainstream philosophy of VGI, there is no control in place that guarantees the goodness of the contributed information.
Recent surveys (Antoniou and Skopeliti Citation2015; Senaratne et al. Citation2017; Degrossi et al. Citation2018; Fonte et al. Citation2017) perform a review of quality measures and indicators for VGI. Specifically, Senaratne et al. (Citation2017) discriminate among three different forms of VGI systems: map-based (e.g. OSM), image-based (e.g. Flickr), and text-based (e.g. geo-blogs). They conclude that the first form is by far the most widespread. As quality measures for map-based VGI, they identify completeness, consistency, positional accuracy, temporal accuracy, and thematic accuracy. These quality measures are defined in ISO 19157. As for quality indicators, they find trustworthiness, credibility, and reputation, among others.
Accordingly, there exists two main methods to assess VGI quality. The first compares VGI data-sets against professionally surveyed ground truth data-sets. In this case, it is possible to assess the aforementioned quality measures. The second aims at deriving some quality indicators only by analyzing the VGI data-sets themselves, without a comparison with external sources.
Several studies have carried out in the last years to assess quality of map-based VGI (mainly OSM) by comparison against professionally surveyed data-sets. Most studies focused on quality assessment of road networks in England (Haklay Citation2010), Germany (Zielstra and Zipf Citation2010; Neis, Zielstra, and Zipf Citation2012), and France (Girres and Touya Citation2010), among other countries. Other work focused on general features rather than street networks only (Helbich et al. Citation2012; Mooney, Corcoran, and Winstanley Citation2010; Fan et al. Citation2014). All such contributions came to similar conclusions: (1) coverage and accuracy of map-based VGI data-sets are approaching those of professionally surveyed data-sets and (2) VGI quality is not homogeneously distributed, with peaks in the most populated areas.
Goodchild and Li (Citation2012) suggest three approaches to assure VGI quality without resorting to external data sources. The first is termed “crowdsourcing” and assumes that quality increases with the number of contributors. Basically, this is an adaptation of the so-called Linus’s Law in honor of Linus Torwalds. Speaking about open-source software, Torwalds stated that “given enough eyeballs, all bugs are shallow” (Raymond Citation1999). When adapted to crowdsourcing, Linus’s Law is sometimes referred to as the many eyes principle: “If something is visible to many people then, collectively, they are more likely to find errors in it. Publishing open data can therefore be a way to improve its accuracy and data quality, especially where a good interface for reporting errors is provided” (http://opendatahandbook.org/glossary/en/terms/many-eyes-principle/). Therefore, Goodchild and Li (Citation2012) conclude that the crowdsourcing approach does not properly apply to less known facts, such as geographic features located in a sparsely populated area. Indeed, in this case, the many eyes needed to assure the quality would be missing. The second approach mentioned by Goodchild and Li (Citation2012) was named “social”. It relies on the construction of a hierarchy of moderators, i.e. individuals that are reputed trustworthy in the community because of the quality of their contributions. The third approach is termed “geographic” and is the one that is best suited for full or semiautomatization: it decides on the quality of a feature by comparing it against geographical laws – e.g. a shoreline should have a fractal shape.
The many eyes principle comes in support of collective intelligence. According to this theory, a group of individuals performs better than its best members. Spielman (Citation2014) analyzes the issue of VGI quality from this perspective. He argues that there are two approaches to quality assessment: validation-by-accuracy and validation-by-credibility. The former corresponds to measuring VGI quality by comparison against ground truth data-sets. The latter aims at deriving VGI quality indicators based on the credibility of the volunteer contributing a feature that, in turn, depends on reputation, trustworthiness, and motivation of the volunteer (Bishr and Mantelas Citation2008). Spielman (Citation2014) concludes that VGI systems should be designed to foster collective intelligence.
2.1. VGI quality indicators: trustworthiness and reputation
Bishr and Janowicz (Citation2010), among others, suggest to use data trustworthiness (aka reliability) as a proxy measure for VGI quality. Arguably, the reliability of an object, a person, or an action corresponds to its grade of predictability. Reliability reflects this idea and corresponds to “a bet about the future contingent actions of others” (Sztompka Citation1999). Mezzetti (Citation2004) provides a compatible definition of trustworthiness by asserting that an entity is trustworthy, within a given context, if it actually justifies reliance on the dependability of its behavior within that context. Additionally, Bishr and Janowicz (Citation2010) stress the notion of people–object transitivity: the degree of reliability associated to a person propagates to the entities that are somehow connected to her/him. Moreover, they argue that the reputation of a person indicates how much this person is considered reliable within a community.
Reliability indicators relating to spatial features contributed in a VGI system (trustworthiness) and to their contributors (reputation) seem to be valid approximations of VGI data quality. Lodigiani and Melchiori (Citation2016) propose an adaptation of the PageRank algorithm for web pages to derive contributors reputation. Barron, Neis, and Zipf (Citation2014) introduce a framework that incorporates 25 quality indicators and corresponding methods for OSM data quality. Finally, Keßler, Trame, and Kauppinen (Citation2011) propose to derive reliability scores from historical information of VGI items. They argue that, from the edit history of features, one can obtain all necessary information to define trustworthiness scores for the spatial features in a VGI system and reputation scores for their contributors.
2.2. Data provenance
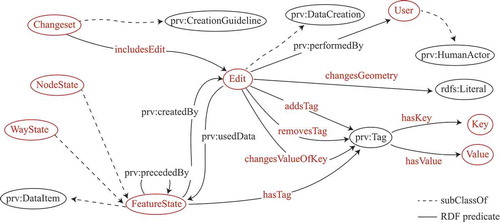
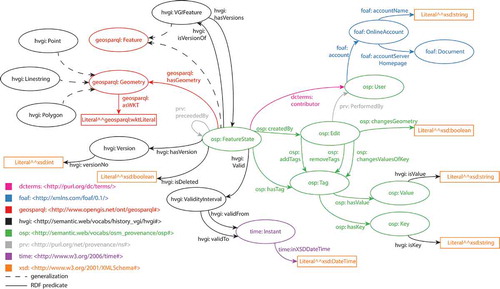
In order to use historical information to derive quality indicators, it is convenient to use an appropriate model. Keßler, Trame, and Kauppinen (Citation2011) tackle the challenge by adapting the concept of data provenance (Hartig Citation2009) to VGI. More specifically, Keßler, Trame, and Kauppinen (Citation2011) introduce the ontology in to represent OSM data provenance. They introduce the concept of “Editing Pattern”: a sequence of editing actions from which it is possible to deduce useful information to derive a score for user reputation and data trustworthiness. The identified patterns are “Confirmations”, “Corrections”, and “Rollbacks”, including the special cases of “SelfCorrections” and “SelfRollbacks”. Each editing pattern has a different effect on reputation and trustworthiness. Keßler and Groot (Citation2013) suggest that the trustworthiness of a feature should grow proportionally with the number of versions, contributors, and confirmations, and inversely with the number of corrections and rollbacks.
Figure 1. OSM provenance ontology diagram.
3. Modeling trustworthiness and reputation
This section details a novel model to derive data trustworthiness and user reputation from feature edit sequences. A first version of the model appeared in D’Antonio, Fogliaroni, and Kauppinen (Citation2014). We drew inspiration from the work of Keßler, Trame, and Kauppinen (Citation2011) and Keßler and Groot (Citation2013) – see Section 2.2 – but our model differs from other approaches with regard to the following aspects. Our model:
can fit any map-based VGI system (rather than OSM only) provided that the system implements feature versioning and that differences between versions are ascribable to series of atomic operations; namely, creation, modification, and deletion;
associates a reputation score to each VGI author;
derives a trustworthiness score for each feature version (rather than for each feature);
accounts for the impact of changes between two versions according to their relevance;
derives trustworthiness and reputation scores also considering evolution information (i.e. future edits, rather than only provenance information).
3.1. Model overview
Our first goal was to design a model to derive trustworthiness and reputation scores from both data provenance and evolution. That is, rather than evaluating a feature contributed at a specific point in time only by analyzing current and historical information in the system, we also exploit information that has to come. For this to be possible, two conditions must be satisfied: (1) the VGI system at hand implements versioning; (2) every time an event alters the state of the information system, the trustworthiness score of features affected directly or indirectly (see Section 3.5) by the change are also updated.
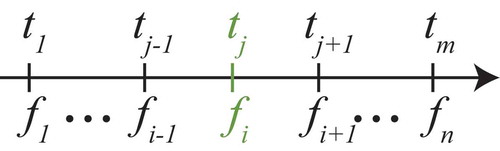
Versioning is a method that prevents data from being lost and defines a temporal order among feature states (as shown in ). The state of a feature is called feature version and is, simply, a set of attributes describing the feature at a given point in time. We denote by
the
version of a feature
. A new version is established every time a user of the VGI system creates or deletes a feature, or modifies a non-empty subset of the attributes of an existing feature. This user is the author of the version and to each version is associated exactly one author. The time interval between a feature version and the next is called the version lifetime. The creation of a feature starts a feature version lineage. Each new version extends the lineage, which terminates with the deletion of the feature.
Figure 2. Versioning establishes a temporal ordering on feature states.
3.2. Model dynamics
Every time a new feature version is added to the VGI system the feature version lineage of
gets extended and we use the new bit of information to update trustworthiness and reputation for a subset of the system’s features and authors. For example, assume that feature
, currently at version
, is modified, generating version
. The model is designed to derive a trustworthiness value for the new feature version by comparing it with previous versions. Concurrently, the reputation of the author of the new feature will also be updated. The new version also triggers an adjustment of the trustworthiness of previous versions of
, as now we have a new version that they can be compared against. Consequently, the reputation of the authors of these versions will also be adjusted. Finally, the newly introduced version indirectly affects the trustworthiness of currently alive versions of “nearby” features (see Section 3.5 for details) and the reputation of their authors.
Each time a trustworthiness or reputation score is updated, it is assigned a validity timestamp, which denotes that the score value accounts for all information available in the VGI system from that point in time; it will be valid until the next update. Also, in order to support the analysis and the monitoring of the system dynamics, scores are never deleted: simply, newer scores supersede older ones.
3.3. Types of edits
We call edit any operation on the VGI system that generates a new feature version. Some previous approaches (Keßler, Trame, and Kauppinen Citation2011; Keßler and Groot Citation2013) focus on specific VGI systems (i.e. OSM) and aims at modeling emergent editing patterns of the system at hand. Such an approach allows for treating more accurately specific patterns: one exemplary editing pattern goes under the name of “edit wars” (Keßler and Groot Citation2013) or “tag wars” (Mooney and Corcoran Citation2012); two or more users keep changing the attributes of a feature back and forth between the same states. Nevertheless, the approach delivers a rigid model, in the sense that it hardly applies to VGI systems exposing different editing patterns than the one for which it has been designed. Conversely, we favored generality and flexibility over specialty and designed a model to respond to atomic editing operations.
3.3.1. Creation
A new feature is added to the VGI system, along with its first version. Creation starts a version lineage that is used at later points in time to derive trustworthiness scores. At creation time, though, there is no historical information available to derive the trustworthiness of the new feature version, so this is set equal to the reputation of its author.
3.3.2. Modification
A new feature version is generated by adding, altering, or deleting some attributes of the latest version of the feature. At modification time, the trustworthiness of the new version is derived and the trustworthiness of previous versions is updated according to the similarity to all versions in the lineage, which was just extended by the new version.
3.3.3. Deletion
A feature is removed from the VGI system. In fact, this creates a special version of the feature denoting the end of the feature lineage. The trustworthiness of this version is set equal to the reputation of its author and the trustworthiness of previous versions are not updated. Indeed, a deletion may denote one of two things: either the feature is not existing any longer in the reality or the information provided is totally wrong. In the first case, the trustworthiness of previous versions should not be affected as these were established in the past, when the feature was still existing. In the latter case, according to the many eyes principle, the wrong information will eventually be corrected by restoring the deleted feature. Restoration is treated as a modification, meaning that the trustworthiness associated to the “deleted” version will decrease drastically and, proportionally, the reputation of its author.
3.4. Impact and aspects of edits
In general, the trustworthiness of a feature at a given point in time is a function of the similarity among the versions in the feature lineage. We adopt the typical geographical information system (GIS) perspective that considers a geographic feature as consisting of thematic and geometric attributes, but we further add a qualitative spatial level that takes into account more drastic changes that might be caused by small geometric changes. In fact, a small geometric change may change drastically the qualitative spatial relations holding among a feature and its neighbors and vice versa.
Accordingly, for the computation of trustworthiness and reputation, we consider the aspects reported in the following subsections.
3.4.1. Thematic aspect
The thematic aspect describes the nongeometric characteristics of the feature. For example, the fact that the feature represents either a road, a traffic light, or a building with an orange facade. Thematic information is assumed to be represented by key–value pairs.
A simple approach to account for thematic edits is to look at the number of differences between the pairs associated to the new version and the pairs associated to other versions in the lineage. A finer-grained alternative would be to look at the semantic similarity between the values associated to the different versions. For example, this can be done by considering the lexical distance (i.e. the shortest path) between two terms on the Wordnet graph (http://graphwords.com/) (Miller Citation1995). Alternatively, the shortest distance in an ontology including both previous and altered key–value pairs can be used.
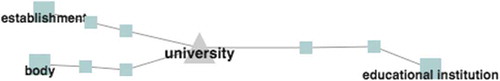
For example, consider the case where the key “amenity” of feature version , initially set to “Establishment”, undergoes two thematic edits. The first edit changes its value to “University”, and the second to “Educational Institution”. If we only look at the number of thematic differences, both edits would result in a score of one. Conversely, using the lexical distance on the Wordnet graph (as shown in ), it would be possible to better characterize the edits: the first edit would be characterized by a score of three, the latter by a score of six with respect to
.
Figure 3. Wordnet graph example.
3.4.2. Geometric aspect
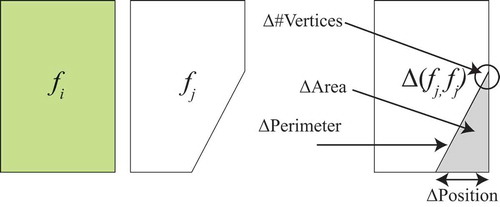
The geometric aspect describes shape and position of a feature. The relevance of a geometric edit is evaluated with respect to a series of geometrical properties, such as perimeter, area, number, and position of vertices. Versions of a feature (as shown in ) are compared to see the differences in these geometric components. For example, version has more vertices than version
, but lesser area and perimeter.
Figure 4. Geometric comparison between versions.
3.4.3. Qualitative spatial aspect
The qualitative spatial aspect refers to changes in the qualitative spatial relations holding between a feature and its neighbors. According to Clementini (Citation2013), qualitative spatial relations belong to one of three classes: topological (Egenhofer Citation1989; Randell and Cohn Citation1989; Tarquini and Clementini Citation2008), projective (Clementini et al. Citation2010; Tarquini et al. Citation2007; Fogliaroni and Clementini Citation2015; Billen and Clementini Citation2006, Citation2005b, Citation2005a), and metric (Hernández, Clementini, and Di Felice Citation1995; Moratz and Ragni Citation2008).
The simultaneous consideration of both the geometric and qualitative spatial aspects allows for weighting more appropriately spatial edits. A qualitative spatial change happens when a modification to the geometric properties of a feature alters at least one qualitative spatial relation between the feature and its neighbors. The impact on trustworthiness is a function of the distance on the conceptual neighborhood graph between the relations holding before and after the qualitative spatial change.
As an example, let us consider topological relations only. Consider the scenario depicted in , where two features and
at version
and
, respectively, are very close to each other but topologically Disjoint. A geometric edit occurs that slightly modifies
into
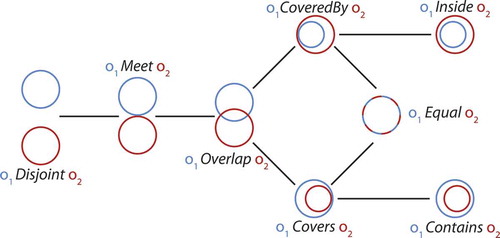
, as depicted on the right side of the figure. Although the geometric change is very small, it changes the topological relation holding between the two features. They are not Disjoint any longer but, rather, they Overlap, which, according to the theory of conceptual neighborhoods (Freksa Citation1991), is a sensible change. The conceptual neighborhood graph for topological relations (Egenhofer and Mark Citation1995) (as shown in ) indicates how topological relations may evolve following a continuous transformation. The distance on the graph evaluates the qualitative spatial difference between two topological configurations. For example, the relations Disjoint and Overlap are at distance two, because there is an intermediate configuration (Meet) between them.
Figure 5. A small geometric change may correspond to a qualitative spatial change.
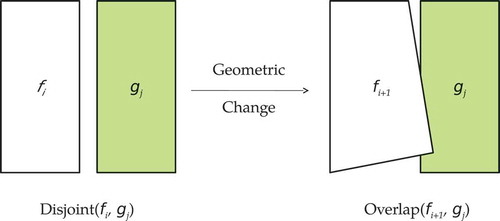
Figure 6. Conceptual neighborhood graph of topological relations, as defined in 9–Intersection model.
3.5. Trustworthiness and reputation
Data trustworthiness () and user reputation (
) are discrete functions of time
defined on the set
of time instants when new feature versions are contributed that influence their value. Their values range in a continuum going from
(i.e. minimum reliability) to
(i.e. maximum reliability). To keep notation cleaner, in the following we avoid to make explicit the time dependency of trustworthiness and reputation: we write
and
instead of
and
, respectively.
The reputation of an author
is the average of the trustworthiness values of all the feature versions authored by
:
where is the set of feature versions contributed by
until this point in time,
denotes the cardinality of a set, and
is the trustworthiness currently associated to the i–th of such feature versions.
All the complexity of the model lies in the definition of trustworthiness as an implementation of the many eyes principle (Raymond Citation1999): the more authors contribute to a feature (i.e. more versions), the higher the probability that errors are spotted and corrected – so that the contributed feature fits well to reality. Such a concept is captured by the notion of confirmation (resp. contradiction): the more versions conform (resp. differ) to each other with respect to the aspects described in Section 3.4, the higher (resp. lower) the trust of these versions.
We differentiate among three different types of confirmations, each capturing a different effect on the overall trustworthiness score: direct effect (), indirect effect (
), and temporal effect (
). Trustworthiness is defined as their weighted sum:
where , and
are weights balancing the respective components. Since
, we have
, with
.
3.5.1. Direct effect
The direct effect () expresses the similarity among all versions in the lineage of a feature. We call this effect “direct” as the information conveyed in the system by each version of a feature affects the trustworthiness of all versions of the same feature. So, this is a direct confirmation (or contradiction) of the state of a feature. Direct trustworthiness of a feature version increases as the attribute-wise difference to the average feature version diminishes, where the average feature version is obtained by averaging (attribute-wise) all versions in the lineage of a feature.
According to the tripartite classification of the aspects of an edit presented in Section 3.4, direct effect is regarded as consisting of three components: direct thematic effect (), direct geometric effect (
), and direct qualitative spatial effect (
). The overall direct effect is obtained as the weighted sum of the three components:
where and
are weights balancing the respective components. Since
, we have
, with
.
3.5.2. Indirect effect
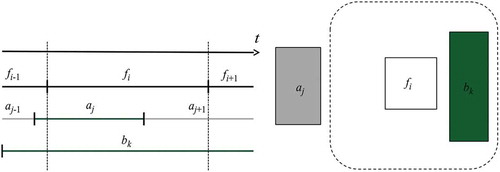
The indirect effect () is designed to account for the effect of indirect confirmations on the trustworthiness of a feature. The concept of indirect confirmation was first introduced in Keßler and De Groot (Citation2013). It is based on the consideration that if an author contributes a new version of a feature but leaves untouched nearby ones, then the latter are likely to be correctly mapped. Accordingly, their trustworthiness must increase. Rather than considering all nearby features, it would probably be more appropriate to consider nearby landmarks, or more generally, outstanding features in the local context. There is a large literature addressing the challenge of defining what a landmark is – see Richter and Winter (Citation2014) for an extensive survey – but this falls outside the scope of this article. So, in this work we consider indirect confirmation based on spatial proximity and temporal co-occurrence of feature versions. That is, for a feature version
to be indirectly confirmed by another feature version
, two conditions must be fulfilled:
(temporal co-occurrence)
exists when
(spatial proximity)
The example in illustrates the indirect effect in case of versions ,
, and
of three different features. ) represents the lifetime of the feature versions and can be referred to check temporal co-occurrence, while ) depicts spatial proximity, with the dotted line denoting the proximity range of feature
. The entities that satisfy the temporal co-occurrence or spatial proximity are depicted in green. Only the trustworthiness of those entities that satisfy both criteria (green on both sides of the figure) are indirectly affected by
; those in gray are not affected. Version
is created during
and
lifetime, with
also falling in the proximity area. Both versions
and
satisfy the condition on temporal co-occurrence, but only
satisfies the condition on spatial proximity. So,
is indirectly confirmed by
, while
is not. Note that the feature version
is not affected by
as it is still not existing. Conversely, when
will start to exist, it will influence the trustworthiness of
– assuming that the condition on spatial proximity will also be satisfied.
Figure 7. Versions that determine indirect effect.
Similarly to the direct effect, also the indirect effect consists of three components: indirect thematic effect , indirect geometric effect
, and indirect qualitative spatial effect
. The overall indirect effect is obtained as the weighted sum of the three components:
where , and
are weights balancing the respective components. Since
, we have
, with
.
3.5.3. Temporal effect
The temporal effect () is designed to account for temporal confirmation, that is, the longer a version persists in the system, the higher the probability that it is well mapped. Accordingly, we want that the trustworthiness of a feature version increases over time as it remains unaltered, converging to
as
tends to infinity. Again, this is a derivation of the many eyes principle: a version with serious and remarkable errors is more likely to be modified sooner than a version with negligible errors.
The temporal effect determines the increment of trustworthiness until the maximum possible level. As illustrated in , the temporal effect asymptotically increases toward 1, as described by the function:
Figure 8. Temporal effect contribution on trustworthiness.
where is the lifetime of feature version
,
is the overall lifetime of feature
(i.e. the sum of the lifetimes of all versions of
), and
is a parameter that can be adjusted to modify the curve slope.
3.6. A possible implementation of direct and indirect trustworthiness
In previous sections, we introduced our model for trustworthiness and reputation and gradually broke down trustworthiness into finer pieces. The finest level comprises thematic, geometric, and qualitative spatial aspects for both direct and indirect effects; specifically, direct thematic effect (), direct geometric effect (
), direct qualitative spatial effect (
), indirect thematic effect (
), indirect geometric effect (
), and indirect qualitative spatial effect (
).
In this section, we propose one possible implementation of these fine-grained components of trustworthiness. The empirical evaluation of the model presented in Section 5 is based on this implementation. We leave for future work the task of deriving more complex implementations.
3.6.1. Direct thematic effect
The direct thematic effect () considers how thematic attributes vary among different versions. If a set of attributes is used more consistently throughout different versions of a feature, then the contribution of these attributes to the direct thematic effect is higher.
A possible behavior can be expressed as follows:
where is the version under assessment,
is the number of versions of the feature
, and noDiffThem
is the number of versions of
that have a different thematic attribute set than
. As mentioned before, more complex behaviors would take into consideration other metrics for the attributes, for example, not only by counting the number of versions with different attribute sets, but also measuring the lexical distance among them.
3.6.2. Direct geometric effect
The direct geometric effect () addresses the difference between a feature version
and the average feature version
in terms of geometric properties. Let
be a measure of the similarity between and
for what concerns the generic geometric property
, where
is the value of the property for
,
is the average property value over the versions currently present in the feature version lineage, and
is a parameter that can be adjusted to modify the curve slope. Then, the direct geometric effect can be expressed as
where is the set of considered geometric properties and
denotes its cardinality. Note that the set of considered properties can be altered according to those available in the VGI at hand.
3.6.3. Direct qualitative spatial effect
The direct qualitative spatial effect () considers the change in qualitative relations among different versions. For this effect, speaking of average values makes no sense, as in general qualitative relations range in a discrete set with no total order defined. Therefore, we count the number of times a specific qualitative spatial relation occurs between the feature version at hand
and the other features in the system. To reduce the computational complexity, we suggest to filter the features to be considered. A simple filter can be achieved by considering only those features falling within a given distance
from the feature version
. Alternatively, filtering can be based on more sophisticated criteria that only select features satisfying given thematic or geometric constraints. For example, one may select only buildings whose area is bigger than a given threshold.
For simplicity, let us consider only current neighbors of feature version , i.e. the set of feature versions
that are alive when version
is generated and whose distance from
is not greater than
. We denote by
the set of all versions of feature
, with
being its latest version. Let
be the qualitative spatial relation holding between the j–th version of and the k–th neighbor of
. Finally, we use Iverson bracket notation and define
as the number of times the relation holding between and the generic neighbor
also holds for previous versions of
.
Then, we can define direct qualitative spatial trustworthiness as
where denotes the total number of versions of feature
, and
denotes the number of neighbors of
. Said differently, we first count for each neighbor
of
the number of times the relation
also holds for past versions
(with
) of
and normalize it by dividing by the number of versions of
. Then, we average these values over all neighbors of
.
Note that, although previous versions of neighbors are not considered here, they will affect the trustworthiness of indirectly, provided that we chose a commutative filtering function to generate set
(such as distance).
3.6.4. Indirect effects
One very easy approach to model indirect effects (,
,
) is to consider the reputation of the author
that contributes the feature version
triggering an indirect confirmation for feature
.
We defined the overall reputation of an author in Equation 1 as the average trustworthiness of the feature versions authored by
. Trustworthiness, as defined in Equation 2, consists of direct, indirect, and temporal effects. In turn, direct (Equation 3) and indirect (Equation 4) effects consist of thematic, geometric, and qualitative spatial aspects. By substituting Equations 3 and 4 in Equation 2 and by applying basic algebraic transformations, we can refactor the overall trustworthiness in terms of aspects (rather than by effects):
with the generic component ,
equal to
Equivalently, we can refactor the overall reputation of author as follows:
with the generic component ,
equal to
where is the set of feature versions contributed by
until this point in time,
denotes the cardinality of a set, and
is the trustworthiness aspect (Equations 12 and 13) currently associated to the i–th of such feature versions.
Then, we can define indirect trustworthiness effects as
presents a summary of how trustworthiness is composed.
Figure 9. Graphic explanation of the composition of trustworthiness (reputation looks identical).
4. System architecture
In Section 3, we presented a model to derive trustworthiness and reputation scores for VGI. This section presents and analyzes a system architecture that implements the model and that we call TandR, shortly for Trustworthiness and Reputation.
4.1. Requirements and features
The TandR framework uses feature evolution information. The outputs consist of a trustworthiness score for each spatial feature version and a reputation score for each contributor. The framework is able to manage only VGI systems that adhere to the model of Section 3; that is, feature evolution information is organized in versions, where each version is the result of an atomic edit, either a creation or a modification or a cancellation.
The framework must perform data analysis on multiple VGI system sources; it does not have to provide direct support to each specific system format, but it must be able to analyze data from different sources; such data have to be brought back to an established format that is flexible and general enough to be able to manage all necessary information.
The problem of giving the right structure to feature evolution information can be solved by organizing data in versions and defining a common format for information sources. Provenance information was already adopted and properly structured in Keßler, Trame, and Kauppinen (Citation2011), as already discussed in Section 2.2. shows the ontology designed in this work, which correlates spatial data taken from the OSM VGI system with provenance information. We use such an ontology as a starting point to introduce, in Section 4.2, a more general ontology that models VGI information.
The model introduced in Section 3 describes a basic strategy for scores calculation; nonetheless, it can handle changes and extensions. Extensibility of the framework is implemented through a mechanism of module selection, with which the framework can handle different implementations of the trustworthiness and reputation model: each module has the task of managing a different implementation. The selection of a given module is made by the user via a string passed to the framework configuration.
In addition to the last trustworthiness and reputation scores, the framework keeps record of historic scores that show how trustworthiness and reputation evolve over time. The model implementation follows events time line; therefore, computation takes into account a series of trustworthiness and reputation scores, each representing the level of “reliability” that versions and users had in the moment the scores calculation refers to.
4.2. Data models
Data are modeled following two ontologies: HVGI and TandR. The historical VGI (HVGI) ontology, shown in , models the domain of VGI systems provenance information and is used to manage VGI feature versions. This ontology includes many concepts defined in external ontologies, notably, the OSM provenance information ontology proposed by Keßler, Trame, and Kauppinen (Citation2011) that defines the concept of FeatureState (corresponding to our feature version). Also, it includes the ontology defined by the Open Geospatial Consortium (OGC) to manage feature geometry, with the Geometry class and its subtypes Point, LineString, and Polygon. Finally, it includes the Friend Of A Friend (FOAF) ontology to manage user details.
Figure 10. Domain ontology: HVGI.
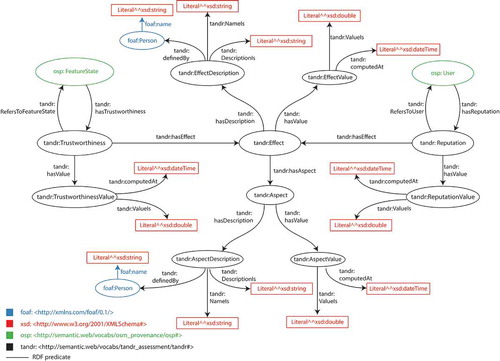
The TandR ontology (as shown in ) models trustworthiness and reputation scores domain. It allows us to represent the score data of the model introduced in Section 3. The ontology provides definition of Trustworthiness and Reputation concepts, linking them to the concept of Effect. This can consist of one or more Aspects, as for the case of direct and indirect effects that are broken down into semantic, geometric, and qualitative aspects. The concepts of Effect and Aspect provide flexibility to the model, in the sense that they are general and can be used to extend or modify the model proposed in this work. Note that Trustworthiness and Reputation are connected to FeatureState and User concepts, respectively, both defined in the OSM provenance information ontology (Keßler, Trame, and Kauppinen Citation2011). TrustworthinessValue and ReputationValue group two bits of information: the numerical score value and a timestamp, indicating the point in time since when the score is valid. Thanks to this information, it is possible to reconstruct the evolution of the trustworthiness of a feature version and of the reputation of a user over time. The Effect concept is related to two more concepts. The EffectDescription provides the name of the effect, a human-readable description of it, and relates to the person that defines it. The EffectValue reports the numeric value of the effect and the date from which that value is valid. The Aspect concept is specular to the Effect.
Figure 11. Domain ontology: trustworthiness and reputation.
4.3. Framework overview
In this section, we describe the system components diagram of the TandR framework (as shown in ). The system uses semantic technologies, hence information persistence is managed by the Parliament triple store (http://parliament.semwebcentral.org/). Parliament uses the quadruple pattern (graph {subject predicate object}) and is spatially enabled via the GeoSPARQL standard (http://www.opengeospatial.org/standards/geosparql/). The system adopts the Parliament libraries available in the Java language, that provide an API to interact with the underlying triple store. As shown in , the triple store manages three different components, each of which represents a graph that contains a set of related RDF (https://www.w3.org/RDF/) triples: the graph that contains VGI data, the graph that contains trustworthiness and reputation scores, and the graph that contains results of scores validation.
Figure 12. The TandR framework: component diagram.
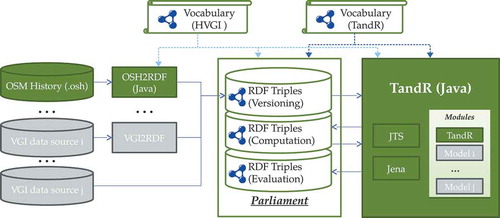
The TandR framework is implemented in Java. To manage interactions with the triple store and process data, TandR uses two external components: the Java Topology Suite (JTS) (https://github.com/locationtech/jts/) and Jena (https://jena.apache.org/). The former provides support for spatial operations, while the latter collaborates with Parliament to manage the connection to the triple store.
Data sources are divided into two kinds. The first one, the most commonly used, needs a layer that adapts data from the VGI system format to the application format, as specified by the HVGI ontology. The second kind of source provides data directly to the format required by the application. OSM represents an example of the first kind of source that requires the development of a component that translates the OSM history file into the application format: we called such a component OSH2RDF. In , the components in green indicate that they have been implemented in our prototype, while the components in gray indicate that they can be added in future developments.
The framework supervises the following activities:
Installation. The installation process aims at preparing a triple store to host data. More in detail, the installation process carries out the management and creation of graphs, the VGI system data import, and spatiotemporal indexing.
Scores Computation. As already mentioned, multiple scores are provided for versions and users, each associated with a validity date. The latest score available is always the most reliable, due to the fact that it was computed with a greater amount of provenance information. The obtained scores are structured and made persistent in such a way that they are properly differentiated by version date.
Scores Validation Scores validation. compares the obtained scores against a ground truth data-set, in order to assess their quality. We will explore how validation works in Section 5.
In the framework configuration, it is possible to select which of the three activity the user wishes to perform or even more than one activity at a time.
4.4. Framework behavior
Events and edits are considered in temporal order. Therefore, the framework will take into account the order in which versions were generated and process them accordingly. One way to achieve this result is presented in the following algorithm:
Retrieve all dates in which at least one feature version was created.
For each date:
Retrieve all versions whose lifetime begins in that date.
For each version:
Delegate scores calculation to selected module.
Reputation and trustworthiness scores may be calculated according to our model (Section 3.6). After the first time a version is processed, trustworthiness is updated whenever a new feature version (direct effect) or a nearby version (indirect effect) is created; the temporal effect is updated every time either of the other effects are altered. See the following algorithm:
Retrieve, if any, previous versions to current version .
Retrieve, if any, living neighbors.
Trigger Trustworthiness calculation of .
Trigger Reputation calculation for author.
For each previous version of
:
Update Trustworthiness of .
Update Reputation of author.
For each living nearby version :
Update Trustworthiness of .
Update Reputation of author.
5. Empirical validation
In order to prove the validity of the proposed model, we should show that feature versions with higher trustworthiness resemble more closely the features mapped in authoritative data-sets. In this section, we provide a qualitative validation of the model by (1) running our TandR Java framework on VGI data to derive trustworthiness and reputation scores and (2) selecting a feature and comparing its lowest
, medium
, and highest
trustworthy versions against the corresponding feature
from a ground truth data-set. The model proves valid if the similarity
of the three feature versions to the reference feature grows as trustworthiness grows. That is, the following system of equations should be satisfied:
where the similarity function accounts for the same aspects used by the TandR framework to compute trustworthiness and reputation scores. Note that the model does not require a comparison to a ground truth data-set to work. This is only done to prove the validity of the model.
5.1. Data sources
As VGI data source we use the OSM full history dump file (http://planet.osm.org/planet/full-history/), which contains the evolution history from the beginning of the project until today. The ground truth data-set was obtained from Open Government Wien (https://open.wien.gv.at/), which provides Austrian land cover data; a view of such government data is shown in and is about the municipality of Vienna in 2012.
Figure 13. Wien ground truth data-set from open government Wien.
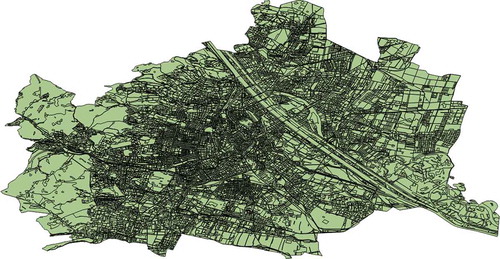
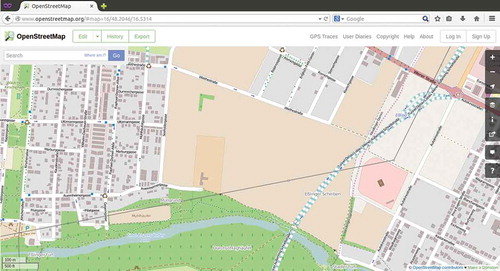
For the experiment reported in this article, we restrict ourselves to the spatial window depicted in and to a temporal window of four years starting January 2010 and ending December 2013. The resulting data-set, obtained from the OSM full history dump, consists of 834 feature versions belonging to 552 different geographic features edited by 38 users.
Figure 14. Screenshot of the selected area in OSM.
5.2. Experiment setup and validation methodology
First, we run the TandR framework on the data-set defined above with the following weights: . For the slope parameters of the temporal effect (Equation 5) and the direct geometric aspect (Equation 7), we set the values 500 and 1, respectively. For the geometric aspect we adopted the measures
and for the qualitative aspect we considered topological relations as defined in the 9-Intersection model (Egenhofer Citation1989). For the thematic aspect we used the formula in Equation 6.
As a second step, we performed a qualitative validation. The validation methodology associates to each ground truth feature the corresponding VGI feature
and compares each version
of
against the corresponding feature
from the ground truth data-set. In other words, we consider the feature
from the ground truth as if it was an extra version of the corresponding VGI feature. Then, the comparison is done by applying the same calculations used for computing the direct trustworthiness values only (since the ground truth data-set does not evolve over time, it does not make sense to account for the temporal and the indirect effects).
Since the ground truth data-set does not report thematic information, the comparison is performed only considering the direct geometric and direct qualitative aspects. Accordingly, the first-level weights of the model (Equation 2) have been set as follows: ,
. The finer-grained weights for the direct effect (Equation 3) have been set to:
,
.
The high-level algorithm used to validate trustworthiness indexes can be described as follows:
For each feature in the ground truth data-set:
Retrieve corresponding VGI feature .
For each version of the retrieved VGI feature:
Compare the geometry of with the geometry of
.
Apply comparison logic to obtain the similarity score .
To identify correspondences between the VGI and the ground truth data-set, we consider the versions of VGI feature
, whose geometry intersects
. Hence, for each feature
in the ground truth data-set, we retrieve the VGI feature
that has in its lineage the version
with the largest intersection area with
. The similarity score
is obtained by comparing the geometries of the VGI features against those of the authoritative ones, as explained in Section 3.6.
5.3. Results
To showcase the results obtained in our experiment, we report in the computed trustworthiness values for the OSM feature 32506491 over time. Note that while edits are identified by the date and time they occurred, the x-axis is not scaled over time. That is, dates are nominal values in this plot. The different versions of the feature are reported in different colors. Also, note that, although this specific feature (in the time range considered in our experiment) consists of 16 versions, the number of plotted trustworthiness values are much more. The first data point of each version (color) is equal to the reputation of the version’s author at the time of insertion in the VGI system. All the other data points in a feature version life correspond to an adjustment of the trustworthiness ignited by indirect confirmations.
Figure 15. Trustworthiness values for the OSM feature 32506491 varying over edits and feature versions.
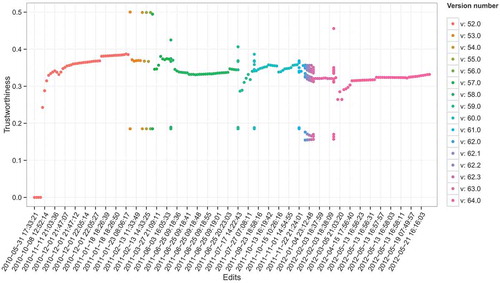
In general, we can observe how the trustworthiness value swings quite smoothly up and down according to the impact of the effects and aspects discussed in previous sections. However, at the beginning of the time interval the trustworthiness value jumps quite abruptly from 0 to approximately 0.3. This might be related to the specific choice of the slope parameters influencing the behavior of the temporal aspect (Equation 5) and of the direct geometric aspect (Equation 7). The value of the parameters shall be tuned in future experiments to obtain a smoother effect.
As an example, we show in and trustworthiness and similarity scores obtained for two polygons: OSM feature ids 38838966 and 45275690, respectively. The trustworthiness scores are computed using all the effects and aspects discussed in Section 3.6. The similarity values are computed using only the direct geometrical aspect and the direct qualitative spatial aspect, as explained in the previous section. Both types of values, trustworthiness and similarity, do not have an absolute meaning. Rather, they have to be interpreted in a relative manner among several versions of the same features. So, for example, we can read that version of feature 38838966 is the most trustworthy among all of its versions, but we cannot infer anything about how reliable this version is with respect to other features.
Table 1. Validation indexes for feature id 38838966.
Table 2. Validation indexes for feature id 45275690.
Both the examples reported below satisfy the qualitative validation inequalities reported in Equation 19. For feature 38838966 (), the qualitative validation condition reported in Equation 19 is satisfied: it is enough to set ,
, and
to versions
,
(version
would work as well), and
, respectively. Note that we have several versions (namely
,
, and
) of feature 38838966 with different trustworthiness but same similarity scores. This is due to the fact that we could only apply the geometric and qualitative spatial aspects to compare against the ground truth data-set, while these versions are generated by thematic edits.
For the other sample feature 45275690 (), we only have two versions. In this case, one can simply let two of the versions in Equation 19 be the same. For example, we can set and
to versions
and
, respectively.
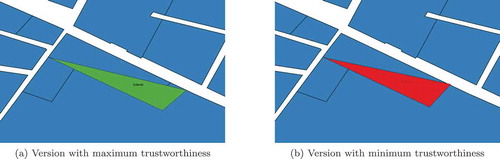
and allow for a visual comparison of the versions of the selected VGI features with minimum (in red) and maximum (in green) trustworthiness against the ground truth data-set (in blue) in the background. reports about VGI feature and clearly shows how better feature version
()) geometrically matches the reference feature from the ground truth data-set. The latter is visible in , underneath version
of the VGI feature (in red). reports about VGI feature
: ) shows version
with maximum similarity to the ground truth data-set; ) shows version
with minimum similarity. In this case, neither of the two versions really fits well to the ground truth reference, yet, according to the similarity measures used, version
results the best fit. In this case the lineage of the feature (with only two versions) is definitely too short to efficiently implement the many eyes principle.
Figure 16. Two versions of feature 38838966 superimposed on the ground truth data-set.
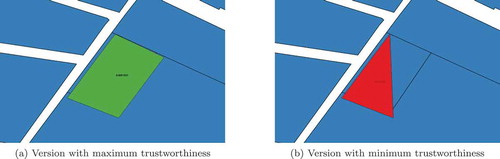
Figure 17. Two versions of feature 45275690 superimposed on the ground truth data-set.
All results in the selected territory portion seems to indicate that our model of trustworthiness provides a valid measure of VGI data quality with respect to ground truth data. Collected data encourages this approach and shows its validity; nevertheless, it is necessary to improve it and perform more exhaustive tests.
6. Conclusions and future work
VGI systems collect spatial information from Internet users and follow the principles that stand behind crowdsource information. The scope of map-based VGI systems, such as OSM, is to build a global map by filling spatial information and to maintain it freely accessible. One key factor for developing and popularizing these systems are “web users” and the contribution they provide; the higher is the number of contributors, the larger is the collected information, in terms of both amount and quality. The definition of a method that quantifies how good VGI is constitutes an active research topic. Among proposed methods, we based our work on the approach taken by Keßler, Trame, and Kauppinen (Citation2011) and Keßler and De Groot (Citation2013).
We presented a model to derive trustworthiness and reputation scores for geographic features and contributors of a VGI system, respectively. The model relies on provenance information and applies to all VGI systems that support versioning, where each version is the outcome of an atomic edit action, either creation, modification, or deletion. The model provides a trustworthiness score for each feature version and a reputation score for each author.
The model was implemented as a Java application using semantic technologies: ontologies have been developed for the representation of data that was made persistent with triplestores. The system architecture is thought of as a framework that can be easily extended and modified by introducing new modules that implement different score calculation models.
The software framework was run on an OSM data-set (full history dump). The obtained scores were validated against a ground truth data-set provided by an authoritative source. For each authoritative feature, we selected the corresponding VGI feature and verified that versions with increasing trustworthiness scores have increasing similarity to the reference feature. In the validation, we only applied direct geometric and qualitative spatial aspects, but we did not consider the thematic aspect and the temporal effect. The results met the expectations since an increase in trustworthiness corresponds to an increase in the similarity to the authoritative reference feature.
The current implementation of the framework can be extended in many directions. We foresee to extend the model by also considering the typical region of contribution of single users. That is, typically the same user contributes information about the same geographic region(s). Consequently, it is reasonable to derive a reputation score for this user that is a proxy measure of her/his local knowledge. Arguably, over time the user reputation will increase and, accordingly, the trustworthiness of the features authored by her/him. Yet, if the same user starts contributing information about a different area (maybe because she/he moved to a different city or state), there is no reason to assume that she/he has good local knowledge about the new region. Thus, the reliability of her/his contributions should be rated accordingly. This is especially true for the thematic aspect of edits but not much for her mapping and cognitive skills (i.e. the geometric and qualitative aspect, respectively).
The reputation of a user should also account for the frequency of contributions, that is, if a user becomes inactive, her/his reputation should diminish over time. This behavior might be modeled similarly to the temporal effect of trustworthiness. In this case, the curve should be monotonically decreasing and converging to 0.
The computation of trustworthiness scores might be improved by introducing a temporal window. Indeed, as of now, trustworthiness scores are updated by comparing each version in a feature lineage against the “average feature version”. This might led to very strange behaviors in case a feature disappears or changes drastically in the real world. For example, consider the case when a building is demolished. In this case, the older versions of the feature will be completely different than the newer versions. With time, the trustworthiness of the newer versions will increase while the trustworthiness of the older versions will decrease. The reputation of their authors will be altered accordingly. Yet, the deterioration of the reputation of the authors of old versions should be mitigated as at the time of contribution the building was still existing. To solve this issue, we suggest to introduce a temporal window that, at the moment of updating trustworthiness scores, only selects a subset of the versions in a feature lineage, leaving untouched very old versions and, consequently, the reputation of their authors.
Finally, the framework can be more thoroughly validated by considering other case studies, the thematic aspect, more domain ontologies, and a wider range of qualitative spatial relations (such as directional and distance operators).
Additional information
Notes on contributors
Paolo Fogliaroni
Paolo Fogliaroni is a post-doctoral researcher in the Department for Geodesy and Geoinformation, Vienna University of Technology, Austria. He received his BS and MS degrees from the University of L’Aquila in 2005 and 2008, respectively. He received his Doctoral degree (Dr.-Ing.) from University of Bremen, Germany, in 2012. His research interests are in the areas of spatial Human–Computer Interaction (HCI), spatial databases, spatial cognition, and Qualitative Spatial Representation and Reasoning (QSR). His latest research endeavors are in the areas of Spatial HCI with cutting-edge media technology, Spatial and Geographic Information Science, and Virtual Spatial Cognition. He investigates how the virtual augmentation of physical reality affects spatial cognition and what are the best metaphors to spatially interact with a virtually augmented world.
Fausto D’Antonio
Fausto D’Antonio obtained his BS and MS degrees from the University of L’Aquila in 2011 and 2014, respectively. He was on Erasmus exchange with Vienna University of Technology. He discussed an MS thesis on evaluation of data trustworthiness through the analysis of historical data within VGI. His research interests are VGI and Semantic Web. He is currently collaborating with University of L’Aquila and working in a private company Thales Alenia Space on On-Board Software for Space and Avionic Systems.
Eliseo Clementini
Eliseo Clementini is an associate professor of computer science at the Department of Industrial and Information Engineering and Economics of the University of L’Aquila (Italy). He received his M.Eng. in Electronics Engineering from University of L’Aquila in 1990 and his Ph.D. in Computer Science from University of Lyon (France) in 2009. He has been a visiting professor at the National Center for Geographic Information and Analysis of the University of Maine, at the Department of Geography and Geomatics of the University of Glasgow, at the Department of Geography of the University of Liege, and at the Department of Geodesy and Geoinformation of Vienna University of Technology. His research interests are mainly in the fields of spatial databases and geographical information science. One of his well-known contributions is the DE+9IM model for topological relations, which is part of Open Geospatial Consortium recommendations and ISO/TC 211 standard. He is a member of the program committee of important conferences such as the Conference on Spatial Information Theory (COSIT), the ACM SIGSPATIAL International Conference on Advances in Geographic Information Systems (ACM GIS), and the International Conference on Geographic Information Science (GIScience).
References
- Antoniou, V., and A. Skopeliti. 2015. “Measures and Indicators of VGI Quality: An Overview.” ISPRS Annals of the Photogrammetry, Remote Sensing and Spatial Information Sciences 1: 345–351. doi:10.5194/isprsannals-II-3-W5-345-2015.
- Barron, C., P. Neis, and A. Zipf. 2014. “A Comprehensive Framework for Intrinsic OpenStreetMap Quality Analysis.” Transactions in GIS 18 (6): 877–895. doi:10.1111/tgis.12073.
- Billen, R., and E. Clementini. 2005a. “Introducing a Reasoning System based on Ternary Projective Relations.” In Developments In Spatial Data Handling 11th International Symposium on Spatial Data Handling, edited by P. Fisher, 381–394. Berlin, Heidelberg: Springer.
- Billen, R., and E. Clementini. 2005b. “Semantics of Collinearity among Regions.” In On the Move to Meaningful Internet Systems 2005: OTM 2005 Workshops, edited by R. Meersman, Z. Tari, and P. Herrero, Vol. 3762, 1066–1076. LNCS. Berlin, Heidelberg: Springer.
- Billen, R., and E. Clementini. 2006. “Projective Relations in a 3D Environment.” In Geographic Information Science: 4th International Conference, GIScience 2006, edited by M. Raubal, H. J. Miller, A. U. Frank, and M. F. Goodchild, Vol. 4197, 18–32. LNCS. Berlin, Heidelberg: Springer.
- Bishr, M., and K. Janowicz 2010. “Can We Trust Information? The Case of Volunteered Geographic Information.” In Towards Digital Earth Search Discover and Share Geospatial Data Workshop at Future Internet Symposium, edited by A. Devaraju, A. Llaves, P. Maué and C. Keßler, Vol. CEUR-WS Vol. 640. ISSN 1613-0073. http://ceur-ws.org
- Bishr, M., and L. Mantelas. 2008. “A Trust and Reputation Model for Filtering and Classifying Knowledge about Urban Growth.” GeoJournal 72 (3–4): 229–237. doi:10.1007/s10708-008-9182-4.
- Clementini, E. 2013. “Directional Relations and Frames of Reference.” GeoInformatica 17 (2): 235–255. doi:10.1007/s10707-011-0147-2.
- Clementini, E., S. Skiadopoulos, R. Billen, and F. Tarquini. 2010. “A Reasoning System of Ternary Projective Relations.” IEEE Transactions on Knowledge and Data Engineering 22 (2): 161–178. doi:10.1109/TKDE.2009.79.
- D’Antonio, F., P. Fogliaroni, and T. Kauppinen. 2014. “VGI Edit History Reveals Data Trustworthiness and User Reputation.” In Proceedings of the 17th AGILE Conference on Geographic Information Science, Connecting a Digital Europe through Location and Place, edited by J. Huerta, S. Schade and C. Granell. Castellon, Spain: AGILE Digital Editions. 03–06 June, 2014. ISBN: 978-90-816960-4-3
- Dai, C., D. Lin, E. Bertino, and M. Kantarcioglu. 2008. “An Approach to Evaluate Data Trustworthiness Based on Data Provenance.” In Secure Data Management: 5th VLDB Workshop, SDM 2008, edited by W. Jonker and M. Petković, Vol. 5159, 82–98. LNCS. Berlin, Heidelberg: Springer.
- Degrossi, L. C., J. P. De Albuquerque, R. D. Santos Rocha, and A. Zipf. 2018. “A Taxonomy of Quality Assessment Methods for Volunteered and Crowdsourced Geographic Information.” Transactions in GIS 22 (2): 542–560. doi:10.1111/tgis.2018.22.issue-2.
- Egenhofer, M. J. 1989. “A Formal Definition of Binary Topological Relationships.” In Foundations of Data Organization and Algorithms: 3rd International Conference, FODO 1989, edited by W. Litwin and H. J. Schek, Vol. 367, 457–472. LNCS. Berlin, Heidelberg: Springer.
- Egenhofer, M. J., and D. M. Mark. 1995. “Modelling Conceptual Neighbourhoods of Topological Line-Region Relations.” International Journal of Geographical Information Systems 9 (5): 555–565. doi:10.1080/02693799508902056.
- Elwood, S., M. F. Goodchild, and D. Sui. 2013. “Prospects for VGI Research and the Emerging Fourth Paradigm.” In Crowdsourcing Geographic Knowledge: Volunteered Geographic Information (VGI) in Theory and Practice, edited by D. Sui, S. Elwood, and M. F. Goodchild, 361–375. Dordrecht: Springer.
- Fan, H., A. Zipf, Q. Fu, and P. Neis. 2014. “Quality Assessment for Building Footprints Data on OpenStreetMap.” International Journal of Geographical Information Science 28 (4): 700–719. doi:10.1080/13658816.2013.867495.
- Fogliaroni, P., and E. Clementini. 2015. “Modeling Visibility in 3D Space: A Qualitative Frame of Reference.” In 3D Geoinformation Science: The Selected Papers of the 3D GeoInfo 2014, edited by M. Breunig, M. Al-Doori, E. Butwilowski, P. V. Kuper, J. Benner, and K. H. Haefele, 243–258. Cham: Springer.
- Fonte, C. C., V. Antoniou, L. Bastin, J. Estima, J. J. Arsanjani, J. C. L. Bayas, L. M. See, and R. Vatseva. 2017. “Assessing VGI Data Quality.” In Mapping and the Citizen Sensor, edited by G. Foody, L. See, S. Fritz, P. Mooney, A. M. Olteanu-Raimond, C. C. Fonte, and V. Antoniou, 137–163. London: Ubiquity Press.
- Freksa, C. 1991. “Conceptual Neighborhood and its Role in Temporal and Spatial Reasoning.” In Decision Support Systems and Qualitative Reasoning, edited by M. Singh and L. Travé-Massuyès, 181–187. Amsterdam: North Holland.
- Girres, J. F., and G. Touya. 2010. “Quality Assessment of the French OpenStreetMap Dataset.” Transactions in GIS 14 (4): 435–459. doi:10.1111/j.1467-9671.2010.01203.x.
- Goodchild, M. F. 2007. “Citizens as Sensors: The World of Volunteered Geography.” GeoJournal 69 (4): 211–221. doi:10.1007/s10708-007-9111-y.
- Goodchild, M. F., and L. Li. 2012. “Assuring the Quality of Volunteered Geographic Information.” Spatial Statistics 1: 110–120. doi:10.1016/j.spasta.2012.03.002.
- Haklay, M. 2010. “How Good is Volunteered Geographical Information? A Comparative Study of OpenStreetMap and Ordnance Survey Datasets.” Environment and Planning B: Planning and Design 37 (4): 682–703. doi:10.1068/b35097.
- Hartig, O. 2009. “Provenance Information in the Web of Data.” In Proceedings of the 2nd Workshop on Linked Data on the Web (LDOW2009), edited by C. Bizer, T. Heath, T. Berners-Lee and K. Idehen, vol. CEUR-WS 538. ISSN 1613-0073. http://ceur-ws.org
- Helbich, M., C. Amelunxen, P. Neis, and A. Zipf. 2012. “Comparative Spatial Analysis of Positional Accuracy of OpenStreetMap and Proprietary Geodata.” In Geoinformatics Forum 2012: Geovisualization, Society and Learning, edited by T. Jekel, A. Car, J. Strobl, and G. Griesebner, 24–33. Berlin, Offenbach am Main: Herbert Wichmann-Verlag
- Hernández, D., E. Clementini, and P. Di Felice. 1995. “Qualitative Distances.” In Spatial Information Theory: A Theoretical Basis for GIS, edited by A. Frank and W. Kuhn, Vol. 988, 45–57. LNCS. Berlin: Springer-Verlag.
- Keßler, C., and R. T. A. De Groot. 2013. “Trust as a Proxy Measure for the Quality of Volunteered Geographic Information in the Case of OpenStreetMap.” In Geographic Information Science at the Heart of Europe, edited by D. Vandenbroucke, B. Bucher, and J. Crompvoets, 21–37. Cham: Springer.
- Keßler, C., J. Trame, and T. Kauppinen. 2011. “Tracking Editing Processes in Volunteered Geographic Information: The Case of OpenStreetMap.” In Proceedings of Workshop on Identifying Objects, Processes and Events in Spatio-Temporally Distributed Data (IOPE 2011), Workshop at COSIT’11, edited by A. Galton, M. Worboys, M. Duckham and J. Emerson, unpublished. Belfast: Maine. 12–16 September 2011.
- Lodigiani, C., and M. Melchiori. 2016. “A PageRank-based Reputation Model for VGI Data.” Procedia Computer Science 98: 566–571. doi:10.1016/j.procs.2016.09.088.
- Mark, D. M. 1993. “Human Spatial Cognition.” In Human Factors in Geographical Information Systems, edited by D. Medyckyj-Scott and H. M. Hearnshaw, 51–60. London: Belhaven Press.
- Martella, R., C. Kray, and E. Clementini. 2015. “A Gamification Framework for Volunteered Geographic Information.” In AGILE 2015 Geographic Information Science as an Enabler of Smarter Cities and Communities, edited by F. Ba¸Cão, M. Y. Santos, and M. Painho, Vol. 217, 73–89. LNGC. Cham: Springer.
- Mezzetti, N. 2004. “A Socially Inspired Reputation Model.” In Public Key Infrastructure. EuroPKI 2004, edited by S. K. Katsikas, S. Gritzalis, and J. López, Vol. 3093, 191–204. LNCS. Berlin, Heidelberg: Springer.
- Miller, G. A. 1995. “WordNet: A Lexical Database for English.” Communications of the ACM 38 (11): 39–41. doi:10.1145/219717.219748.
- Mooney, P., and P. Corcoran. 2012. “Characteristics of Heavily Edited Objects in OpenStreetMap.” Future Internet 4 (1): 285–305. doi:10.3390/fi4010285.
- Mooney, P., P. Corcoran, and A. C. Winstanley. 2010. “Towards Quality Metrics for OpenStreetMap.” In Proceedings of the 18th SIGSPATIAL International Conference on Advances in Geographic Information Systems, edited by D. Agrawal, P. Zhang, A. El Abbadi and M. Mokbel, 514–517. New York: ACM Press.
- Moratz, R., and M. Ragni. 2008. “Qualitative Spatial Reasoning about Relative Point Position.” Journal of Visual Languages & Computing 19 (1): 75–98. doi:10.1016/j.jvlc.2006.11.001.
- Neis, P., D. Zielstra, and A. Zipf. 2012. “The Street Network Evolution of Crowd-sourced Maps: OpenStreetMap in Germany 2007–2011.” Future Internet 4 (1): 1–21. doi:10.3390/fi4010001.
- Randell, D. A., and A. G. Cohn. 1989. “Modelling Topological and Metrical Properties of Physical Processes.” In Proceedings of the 1st International Conference on Principles of Knowledge Representation and Reasoning (KR’89), edited by R. J. Brachman, H. J. Levesque and R. Reiter, 357–368. San Francisco, CA: Morgan Kaufmann.
- Raymond, E. S. 1999. The Cathedral and the Bazaar: Musings on Linux and Open Source by an Accidental Revolutionary. Sebastopol, CA: O’Reilly Media.
- Richter, K. F., and S. Winter. 2014. Landmarks: GIScience for Intelligent Services. Cham: Springer International Publishing.
- Senaratne, H., A. Mobasheri, A. L. Ali, C. Capineri, and M. Haklay. 2017. “A Review of Volunteered Geographic Information Quality Assessment Methods.” International Journal of Geographical Information Science 31 (1): 139–167. doi:10.1080/13658816.2016.1189556.
- Spielman, S. E. 2014. “Spatial Collective Intelligence? Credibility, Accuracy, and Volunteered Geographic Information.” Cartography and Geographic Information Science 41 (2): 115–124. doi:10.1080/15230406.2013.874200.
- Sztompka, P. 1999. Trust: A Sociological Theory. Cambridge: Cambridge University Press.
- Tarquini, F., and E. Clementini. 2008. “Spatial Relations between Classes as Integrity Constraints.” Transactions in GIS 12 (SUPPL. 1): 45–57. doi:10.1111/tgis.2008.12.issue-s1.
- Tarquini, F., G. De Felice, P. Fogliaroni, and E. Clementini. 2007. “A Qualitative Model for Visibility Relations.” In KI 2007: Advances in Artificial Intelligence, edited by J. Hertzberg, M. Beetz, and R. Englert, Vol. 4667, 510–513. LNCS. Berlin, Heidelberg: Springer.
- Wand, Y., and R. Y. Wang. 1996. “Anchoring Data Quality Dimensions in Ontological Foundations.” Communications of the ACM 39 (11): 86–95. doi:10.1145/240455.240479.
- Zielstra, D., and A. Zipf. 2010. “A Comparative Study of Proprietary Geodata and Volunteered Geographic Information for Germany.” In Proceedings of 13th AGILE International Conference on Geographic Information Science, edited by M. Painho, M. Y. Santos and H. Pundt, 1–15. Guimarães, Portugal: AGILE Digital Editions. ISBN: 978-989-20-1953-6