
ABSTRACT
Natural disasters, such as wildfires, earthquakes, landslides, or floods, lead to an increase in topical information shared on social media and in increased mapping activities in volunteered geographic information (VGI) platforms. Using earthquakes in Nepal and Central Italy as case studies, this research analyzes the effects of natural disasters on short-term (weeks) and longer-term (half year) changes in OpenStreetMap (OSM) mapping behavior and tweet activities in the affected regions. An increase of activities in OSM during the events can be partially attributed to those focused OSM mapping campaigns, for example, through the Humanitarian OSM Team (HOT). Using source tags in OSM change-sets, it was found that only a small portion of external mappers actually travels to the affected regions, whereas the majority of external mappers relies on desktop mapping instead. Furthermore, the study analyzes the spatio-temporal sequence of posted tweets together with keyword filters to identify a subset of users who most likely traveled to the affected regions for support and rescue operations. It also explores where, geographically, earthquake information spreads within social networks.
1. Introduction
Crowd-sourced data, such as volunteered geographic information (VGI) (Goodchild Citation2007) and social media posts, have been used to manage relief efforts around natural disasters (Zook et al. Citation2010; Haworth and Bruce Citation2015), to study the formation of user mapping communities after such disasters (Budhathoki and Haythornthwaite Citation2013), and to analyze human dynamics as a result of such events (Qi and John Citation2014). While short-term effects of crisis events on Twitter activity patterns (Goolsby Citation2010) and OpenStreetMap (OSM) mapping patterns (Zook et al. Citation2010) in response to natural crises have already been analyzed in previous studies, their effects on longer term VGI contribution patterns and social media usage, as well as on human travel patterns (human dynamics) toward affected regions are less understood. Also, information about the types of edits and the categories of new features mapped by the OSM community in response to natural disasters could reflect how the degree of completeness of the different feature categories is affected (i.e. increased) by such mapping efforts. The objectives of this study are to determine:
How earthquakes, as examples of natural disasters, change both short-term and longer-term activity behavior in OSM and Twitter.
How the proportion of local and external data contributors changes throughout such events.
How contributions of organized mapping communities, such as Humanitarian OSM Team (HOT), differ from those of other mappers.
Patterns of human dynamics in response to such events.
Feature types primarily mapped in OSM in response to such events.
The analysis provides new insights into OSM data growth patterns (Neis and Zipf Citation2012) and user loyalty (Napolitano and Mooney Citation2012), adding on to previously analyzed factors that affect VGI contribution patterns, such as land use type (Arsanjani et al. Citation2015; Alivand and Hochmair Citation2017), socio-economic factors (Heipke Citation2010), organized mapping events and campaigns (Dittus, Quattrone, and Capra Citation2017), and natural disasters, such as earthquakes (Poiani et al. Citation2016). It also contributes to the large research topic of human movement pattern analysis from crowd-sourced and social media data (Valle et al. Citation2017), especially in response to natural disasters (Goodchild and Glennon Citation2010). This knowledge will improve planning abilities for crisis management in the future, since it reveals which type of OSM data will get mapped and continuously updated after such an event, and to which extent it contains local contributions, allowing to draw conclusions about its data quality (Zielstra et al. Citation2014). The case study revolves around two crisis events, which are a 2015 earthquake in Nepal and a 2016 earthquake in central Italy.
The remainder of this paper is structured as follows. Section 2 reviews related literature on VGI mapping contributions, social media activities, and derived human dynamics in response to natural crises. Section 3 presents data sources, data extraction, and analysis methods. In Section 4, analysis results are presented for each data source and case study with regard to data contribution patterns. Section 5 explains about the human dynamics. Section 6 provides a discussion of the study results, followed by conclusions and plans for future work.
2. Related works
2.1. Collaborative mapping and crisis events
Over the past decade, volunteer mappers have used a growing number of tools and platforms to contribute geospatial information to crowd-sourced data repositories in response to natural and political crises (Zook et al. Citation2010; Ziemke Citation2012; Ahmouda and Hochmair Citation2017). An early example of collaborative mapping efforts could be observed in the aftermath of a 2010 earthquake in Haiti, where a Haiti Ushahidi site and the OSM platform provided important street maps and infrastructure information for relief efforts (Goolsby Citation2010). The HOT, which supports the generation of free up-to-date maps for relief efforts through collaborative mapping, also contributed to the 2010 Haiti earthquake as one of the many tasks completed in response to various crises (OpenStreetMap Wiki Citation2018a), including the Typhoon Yolanda in the Philippines 2013 (Palen et al. Citation2015).
Several studies have analyzed the processes that are involved in collaborative mapping during crisis events, as well as the short-term changes in contribution behavior to crowd-sourcing platforms. For example, Poiani et al. (Citation2016) review the effect of an earthquake which hit Nepal on 25 April 2015, on OSM contributions between April 15 and May 15. Results reveal a sharp rise in the number of active contributors around the event, which can be partially explained by mapping parties organized in Bangalore (India) and in Barcelona (Spain) shortly after the earthquake. The vast majority (about 99%) of nodes and ways during that 1-month observation period were edited or added after the earthquake, showing that the event triggered a large wave of user participation. Soden and Palen (Citation2016) conducted 36 semi-structured interviews with GIS practitioners and information managers who were involved in the emergency response to that earthquake. The study identified an increased level of collaboration and spatial data sharing between map producers and the Nepal government compared to previous crises, reflected by 8,000 OSM volunteer mappers contributing after the Nepal earthquake, compared to the much smaller number of 500 contributors mapping around the Haiti (2010) earthquake over the same time period (Soden and Palen Citation2014). That higher number of participants is, however, also driven by the general increase in the number of registered OSM users from 200,000 in 2010 to around 2.2 millions in 2015 (OpenStreetMap Wiki Citation2018b). Previous papers that examined OSM contribution patterns in the context of natural disasters discussed the number of edits or edited objects in response to events and the proportion of new versus more experienced mappers (Palen et al. Citation2015; Poiani et al. Citation2016), but did not elaborate on longer term changes in the contribution patterns over time. Other studies describe recruitment efforts and emerging collaborations in disaster relief efforts (Dittus, Quattrone, and Capra Citation2017), and the interaction between the mapping community and stakeholders in crowd-based disaster mapping (Soden and Palen Citation2016).
2.2. Social media activity and crisis events
While VGI platforms are primarily used for mapping tasks, social media platforms, such as Twitter, YouTube, and Facebook, provide platforms to share information and opinions about crisis events, such as refugee movements (Rettberg and Gajjala Citation2016), terrorist attacks (Cassa et al. Citation2013), earthquakes (Crooks et al. Citation2013), tsunamis (Acar and Muraki Citation2011), or flood events (de Albuquerque et al. Citation2015). The activity level in social media networks increases during crisis events (Austin, Liu, and Jin Citation2012) to share up-to-date information about the events and to provide emotional support (Cvetojevic and Hochmair Citation2018).
Tweet analyses use different pieces of information from tweets, including tweet message, location, timestamp, or linked information such as images (Steiger, Albuquerque, and Zipf Citation2015; Cvetojevic, Juhasz, and Hochmair Citation2016). Middleton, Middleton, and Modafferi (Citation2014) introduce a social media crisis mapping platform for natural disasters that, based on real-time Twitter data, maps affected regions. Resch, Usländer, and Havas (Citation2018) use tweets to assess the footprint of and damages caused by natural disasters through a combination of Latent Dirichlet Allocation (LDA) for semantic information extraction and local spatial autocorrelation for hot-spot detection. The granularity of geographic references in tweet texts that were used to specify the spatial extent of two earthquakes in Italy and Myanmar are analyzed in (Zahra, Ostermann, and Purves Citation2017), showing that a larger number of toponyms are used for Myanmar than for Italy, although most of the toponyms for the Myanmar earthquake relate to areas in countries surrounding Myanmar, such as Bangladesh and India, but not to Myanmar itself.
2.3. Human dynamics and crises
Previous work has shown that crisis events can affect movement patterns of people at different geographic scales. Li et al. (Citation2010) assess the effect of Hurricane Katrina on the migration and return process of New Orleans residents, which includes an analysis of evacuation return rates, experiences, motivations to return or stay, and evacuation routes. The study used data from surveys, phone and in-person interviews, and focus groups, but no crowd-sourced mapping or social media data. Another paper uses geo-tagged tweets to study the influence of three tropical storms (Hurricane Sandy, Typhoon Wipha, and Typhoon Haiyan) on human mobility patterns, revealing that during the events the frequency of longer trips decreased significantly (Qi and John Citation2014). Geotagged data from about 500,000 Twitter users between 2011 and 2013 were used to infer trends of out-migration rates for various countries around the world, including Mexico, Spain, Greece, and Ireland, due to economic conditions (Zagheni, Garimella, and Weber Citation2014).
Besides this research, travel dynamics toward natural events (e.g. for aid and support teams) at the worldwide scale have not yet been addressed in previous work. The studies and methods presented in this paper will add to the body of knowledge that connects travel patterns to natural crises using VGI and social media data.
3. Data and methods
3.1. Study areas
The first earthquake analyzed had a 7.8-moment magnitude scale (M) and occurred on 25 April 2015, at an approximate depth of 8.2 km and 80 km northwest of Kathmandu, the capital of Nepal ()). Over 9,000 people were killed and more than 23,000 were injured. On 12 May 2015, a major aftershock occurred near the Chinese border between Kathmandu and the Mount Everest with a magnitude of 7.3 M. This aftershock killed more than 200 people and injured more than 2,500 people. This earthquake is considered the worst natural disaster that has hit Nepal since 1934.
Figure 1. Affected and control areas of the analyzed earthquakes in Nepal/India (a) and Italy (b).
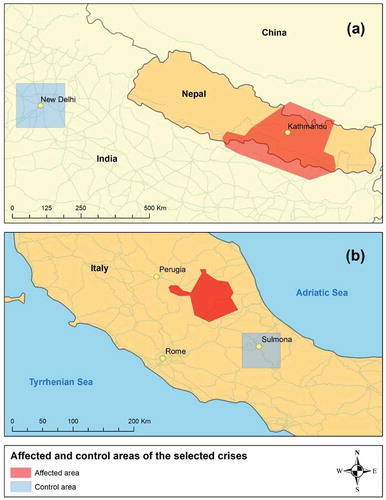
The second earthquake analyzed hit Central Italy on 24 August 2016, with a magnitude of 6.2 M ()). It caused the death of 297 people and injury of at least 365 people. Severe damage was reported in some towns, including Amatrice, Accumoli, and Pescara del Tronto. The estimated economic loss ranged between $1 billion and $11 billion (The Royal Gazette Citation2016).
OSM edits and Twitter activity data were extracted for the study areas affected by earthquakes (red areas in ), and for nearby control areas (blue squares in ). The extent of the affected areas was determined from earthquake maps of the United States Geological Survey (USGS): M 7.8 – 36 km E of Khudi, Nepal (USGS Citation2015) and M 6.2 – 10 km SE of Norcia, Italy (USGS Citation2016). The control areas were chosen in a way to be close to, but not directly affected by the earthquakes in question, and to reflect similar population characteristics (rural vs. urban) as the affected areas. For the Nepal earthquake, New Delhi is the closest nearby large city to Kathmandu. For the Italy earthquake which took place in the Umbria region in the central mountain region, the area around Sulmona, a small city in the mountains south of the affected area was chosen as a control area.
3.2. Data collection and preparation
Data for this study come from OSM and the Twitter streaming API. Only geocoded tweets were used, which make around 1% of all tweets (Graham, Hale, and Gaffney Citation2014).
For OSM, the full planet history dump file, which contains feature edits, was downloaded. Selected OSM change-set files, which contain all changes made to OSM features by any mapper in a geographic area, were downloaded as well. Next, the OSM-history-splitter tool was applied to extract data for the areas of interest from the history dump file. This data was imported into a PostgreSQL database using the OSM-history-importer. Next, SQL queries were run to identify features that were newly mapped or edited during the analysis time period of this study. As a further step in OSM data preparation, the following two criteria were considered for the removal of OSM data edits that were most likely generated by automated scripts, so-called bots (Zielstra et al. Citation2014):
Remove edits from change-sets with a tag comment “mechanical = yes” or “bot = yes”.
Remove edits on nodes and ways in change-sets with more than 4,000 edits.
The bots were first identified in OSM change-sets and corresponding edits were subsequently removed from features in the areas of interest.
Geo-tagged Twitter data were collected 6 months before and 6 months after the earthquakes from the affected and nearby control regions and downloaded in JavaScript object notation (JSON) format which contains tweet id, time created, tweet content, hashtags, location, and user profile information. These data were subsequently stored in a PostgreSQL database. When posting a tweet, a user has two options to provide geolocation information. The first, less precise option, is through a place tag, which is suggested by the Twitter app based on the current user location, resulting in a bounding box in the JSON field. The second option is exact coordinates, resulting in a latitude/longitude pair of the current user position in the JSON field. Before May 2015, users could opt to have all their tweets geocoded with exact coordinates in Twitter apps (e.g. Twitter for Android). However, since May 2015, due to a change in the API functionality, the user needs to request the use of exact coordinates for each individual tweet, which significantly reduces the number of tweets posted with exact coordinates.
As part of Twitter data preparation, tweets from automated Twitter accounts (bots) were excluded, where travel speed, tweet frequency, and tweet source were considered. A speed threshold of 200 km per hour between subsequent tweets of the same user and a frequency threshold of more than 150 tweets per day were applied (Zhang and Paxson Citation2011; Azmandian et al. Citation2012). Also, only tweets from mobile applications or computer applications that people typically use to tweet (e.g. Twitter for Android, Twitter for iOS, or twitter.com) were kept for further analysis. Tweets posted from sources, such as Google, Big Planet Earth, and TweetMyJOBS, were excluded. Also, only original tweets were used for further analysis, and retweets were excluded.
3.3. Analysis methods
OSM contribution patterns and Twitter activity patterns were analyzed over a one-year period for each event, which extends between 6 months before and 6 months around the crisis event under consideration. The next few paragraphs describe the extraction of user patterns from OSM and Twitter data sources in more detail.
3.3.1. OSM
OSM editing patterns were extracted from the OSM history dump file. By comparing two consecutive rows, one can identify the edits that occurred to a feature between two versions, and when they occurred. Three basic operations can be applied to each OSM feature, which are: create, modify, and delete (Ramm and Topf Citation2010; Rehrl et al. Citation2013; Zielstra et al. Citation2014). Nodes and ways are the basic features of OSM where the nodes represent points and ways represent linear or areal features consisting of a list of nodes that define a polyline. Nodes with tags represent point features, such as points of interest, and differ therefore from nodes on ways which usually have no tags but provide solely geometry information to define the shape of ways. In this study, nodes were filtered by their tags to extract stand-alone point features, and hence nodes without tags (as found in ways) were not considered for node statistics. The following operations on OSM nodes and ways were taken into account for the analysis of contribution patterns:
(1) Operations on nodes:
- Create geometry (new node)
- Remove geometry (deleted node)
- Change position of geometry
- Add/remove/update a tag
(2) Operations on ways:
- Create geometry (new way)
- Remove geometry (delete way)
- Change position of geometry (move a node on way)
- Add node to way
- Remove node from way
- Add/remove/update tag
Besides monthly frequency plots of operations, statistical tests, such as the chi-squared test of independence were performed to determine differences in OSM contribution patterns between an affected area and its reference area. The number and type of operations were also analyzed for different OSM feature types. OSM offers 23 primary feature types, including amenity, highway, shop, or building. The primary feature type of an OSM object can be extracted through the key tag in the key-value pair of the analyzed OSM object.
Various methods can be applied to determine the home region of an OSM mapper (Neis and Zipf Citation2012; Zielstra et al. Citation2014). In this study, the analysis of a user’s home region was built upon three criteria, which are the first change-set created, the number of change-sets made, and the number of changes made by the user. More specifically, if the location of the first point created and the centroid of the first change-set created are within the affected area, and the affected area is within the country in which a user contributed most operations, the user is called local to the region. This region becomes then the user’s home region. The same is also true if either most change-set centroids or most feature operations fall within the affected area. In case of a tie in count numbers between the affected area and other areas, the user is considered local to the affected area. This approach was conducted locally on downloaded data, and no online OSM tools were used to determine the user’s home region.
A user is called external to the affected area, if his or her home region does not overlap with the affected area. In addition, if the user’s home region is located in a different country than the affected area, the user is considered to be an international user. The defining criteria for a local mapper provided above correctly identify a mapper as an external (or international) mapper even if his or her first point is mapped in the crisis region (and not in the mapper’s true home region) but the other criteria are not satisfied. Such a case is common for international HOT members who start contributing to OSM as part of a disaster mapping task, but then move on to other countries for later tasks. In principle, an external user could map remotely within the affected area just at the time of the event and thus be incorrectly classified as local based on the above criteria. To evaluate this type of error, mapping operations after the event were analyzed in more detail for all users. Results show that for the Nepal earthquake 43.6% of local users made OSM changes after the earthquake (i.e. between 7 days and 6 months after the event) exclusively within the affected area, whereas only 4.8% of them made changes outside the affected area. For the Italy earthquake, the corresponding numbers are 33.3% and 4.4%, respectively. Although this method does not provide a ground truth evaluation, it indicates that the applied method to distinguish between local and external mappers works reasonably well. This is, because most mappers that are classified as local contributors focus indeed almost exclusively on the affected area.
For human dynamics related to the mapping of crisis events, it is necessary to understand where an OSM mapper was physically located before, during, and after a crisis event, respectively. The “source” tag of a change-set, if populated by the user, can help to determine whether a mapper was physically present in a region while mapping (namely, if using a local mapping source), or whether the user conducted desktop mapping from satellite imagery instead. Although individual OSM features also have a source tag, these are sparsely populated (Juhász and Hochmair Citation2016), so that this study relies solely on source tag information in change-sets. An OSM contributor’s simplified travel trajectory can then be derived by connecting two regions of local mapping activities of that contributor, namely the crisis region near the earthquake, and the mapper’s prior mapping region away from the earthquake, such as the mapper’s home region. When aggregating the identified travel trajectories from all OSM contributors a flow map can be generated that reflects the general event-related travel pattern among OSM users traveling to the crisis event. Physically present users in a crisis region could theoretically use remotely sensed sources only (e.g. “Bing” satellite images) for OSM data edits so that they would not be discovered through our approach. However, it is quite unlikely that such a local mapper uses only a remote source in the crisis region after traveling there.
An alternative method to distinguish between local and remote mapping (which is not applied in our study though) is supervised machine learning approaches, e.g. decision tree, support vector machine, or logistic regression on OSM edits (Basiri, Amirian, and Mooney Citation2016). This would require a substantial manually annotated training set of edits based on known local mapping tasks and remote mapping tasks, and a selection of measurable OSM editing variables (e.g. proportion and variety of primary keys or values in edited features, density of edited nodes on polyline features) for the prediction of the mapping type.
3.3.2. Twitter
The average number of geo-referenced tweets per day, week, and month was used to analyze differences in tweet activities between different time periods and locations, and to assess the effect of the earthquakes on tweeting behavior. In addition, the proportion of event-related tweets among all tweets was computed for different points in time, using event-related hashtags, such as #nepalearthquake, #terremotiitalia, #prayfornepal, or #terremoto2016, and event-related keywords, such as earthquake, sisma, nepalquake, nepalshakes, devastation, disaster, and collapse. The lists of keywords and hashtags related to the events were constructed manually in an iterative process e.g. by parsing tweet content and identifying hashtags and keywords in English (and some in Italian) that were common and frequently used during the events. As shown in (Hong, Convertino, and Chi Citation2011), more than half of posted tweets are in English, which, together with the nine other top languages, cover 95.6% of tweets. Italian and Nepali were not among them, which is why these languages were not used in our analysis, with the exception of a few hashtags in Italian that could be easily identified. Furthermore, in order to determine if a user was local or external to a region of interest, and to determine the user’s home country, the tweeting history of each user who posted from the earthquake region during the event time was obtained from the Twitter API, which allows downloading the latest 3,000 tweets of a user. A user was considered local if the majority of the user’s geotagged tweets fell within the affected area.
To identify an actual trip of a Twitter user to one of the analyzed crises regions the user’s locations of tweet activities before, during, and after the crisis events were compared. More specifically, a user who posted tweets from the affected area during but not before or after the event and who also posted tweets before or after the event from an outside area, was considered to be traveling to the crisis area. From among this identified group of traveling Twitter users, those who were likely traveling because of the event were identified through event based keywords and hashtags found in their tweet posts. Keywords related to rescue operations, such as rescue, relief, support, and emergency and hashtags related to rescue operations, such as #rapidresponseteam, #earthquakeresponse, #searchandrescue, and #rapidrescueteam, were used for this purpose. The movement of a user was considered to be related to the crisis event if at least one of his or her tweets contained such as a keyword or hashtag and was posted during the time of the event in the affected area. In the generated flow maps, all observed travel movements were aggregated for each user, so that one unit on a flow arrow corresponds to travel of one user.
4. Analysis of contribution and activity patterns
The section describes observed OSM and Twitter contribution patterns, and begins with the OSM data analysis for both earthquakes, followed by Twitter analysis.
4.1. OSM data contributions
4.1.1. Nepal earthquake
The monthly counts of created OSM way features, changes of way tags and way geometries, and users contributing to ways before, during, and after the months of the Nepal earthquake events (25 April 2015, and 12 May 2015) are shown in ). A spike in April and May in all four charts reveals a significant impact on the mapping contributions in OSM in the affected area during the event period and up to 2 months later. A similar pattern was observed for nodes in the Nepal area. As opposed to this, the Nepal control area (New Delhi) does not reflect an increase in mapping activities during the event periods (chart not shown for brevity).
Figure 2. Edit and user counts for OSM ways in the affected Nepal area (a) and number of local and external contributors including HOT members (b) (# = number).
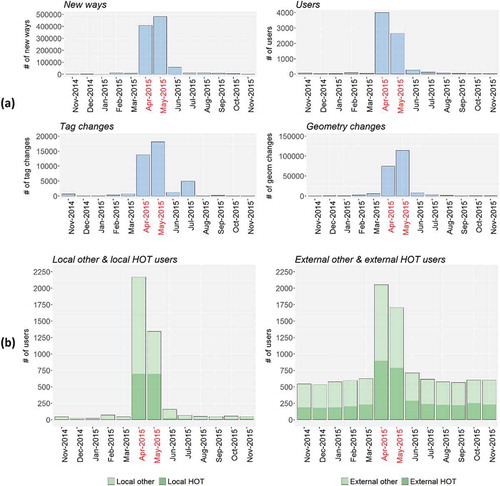
Monthly user plots show a significant increase both in the number of local and external contributors around the time of the earthquake ()), where the relative increase is higher for local than for external contributors. This suggests the presence of an active local mapping community during the crisis. The figure shows also a permanent contributor base of HOT members among external mappers before, during, and after the event, whereas local activities only spike during the event, also for local HOT users.
Next, the contribution history of users is analyzed in more detail. In , values in the center row (25 April 2015–18 May 2015) refer to the subset of users who mapped during the earthquake in the crisis region. Rows above and below indicate which proportion of these users mapped also before or after the event, respectively. The rightmost four columns subdivide these user counts for local and external users. The second column shows that few users mapped in the region before and during the event (up to 0.26%), whereas the percentage of contributors who continue to map after the event remains somewhat higher for at least 3 months (0.50% or more). External contributors make a significantly higher share than local mappers both before and after the event. As opposed to this, local users constitute the larger group during the crisis with 54.7%.
Table 1. Monthly activities of local and external contributors who also mapped during the Nepal earthquake.
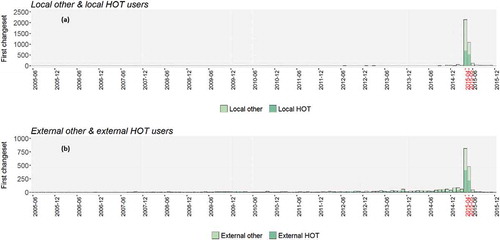
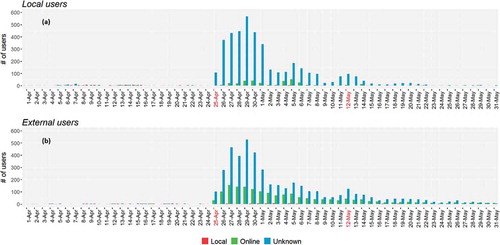
plots on a timeline from 2005 to 2015 the month in which users who mapped during the earthquake in the affected Nepal area submitted their first OSM change-set. A large percentage of local users (84.6%) ()) and external users (39.5%) ()) signed up for OSM during the weeks of the earthquake, which is true both for HOT members and other mappers. This illustrates the power of such events to attract new OSM contributors.
Figure 3. Monthly numbers of first OSM change-sets submitted by local (a) and external (b) contributors who mapped in the affected Nepal area during the earthquake.
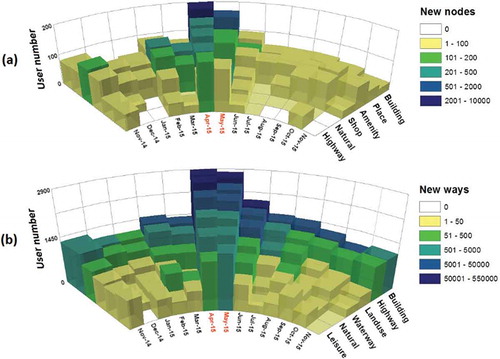
shows for the most frequently added OSM feature types the number of new nodes (i.e. point features) ()) and ways ()) mapped during the analyzed one-year period. The x-axis represents the month, the y-axis the OSM feature type, and the z-axis the number of contributors mapping a feature type. The color value indicates the number of nodes or ways added (according to the legend). Both for nodes and ways, buildings are most frequently mapped during the earthquake, suggesting that buildings receive most attention during earthquake-related events. For ways, highways are the second most mapped feature type. This dominance of mapping highway and building features reflects the expected HOT-OSM mapping behavior in disaster response, which is apparently also followed by non-HOT members. While for created ways, buildings are the most frequently mapped features throughout the year ()), for nodes this is only the case during the earthquake ()), revealing a change in the mix of features that are mapped in the affected region as a result of the earthquake.
Figure 4. Most prominent OSM node (a) and way (b) features mapped in the affected Nepal area.
A chi-squared test of independence was conducted to check for a statistical association between the change in the proportion of mapped feature types between two-time periods (e.g. before and during the earthquake) and mapping region. A first test compared the change in the proportion of node features added before and during the earthquake between the Nepal earthquake area and the New Delhi reference area, which was found to be significantly different between both regions, χ2 (5, N = 11,975) = 1401.4, p < 2.2e−16. This means that the earthquake has a significant effect on the types of features being mapped when compared to a non-affected area. The same test procedure was conducted to compare the change in contribution behavior before and after the earthquake between the affected and the reference area, χ2 (5, N = 1556) = 42.085, p < 0.0001, suggesting that the earthquake affects also the composition of feature types being mapped after the earthquake. Similar test results were obtained for way features.
4.1.2. Italy earthquake
During the month of the Italy earthquake event, which took place on 24 August 2015, OSM mapping activities peaked significantly ()), whereas the Sulmona reference area showed no increase in OSM mapping activities whatsoever (plots not shown for brevity).
Figure 5. Edit and user counts for OSM ways in the affected Italy area (a) and number of local and external contributors including HOT members (b) (# = number).
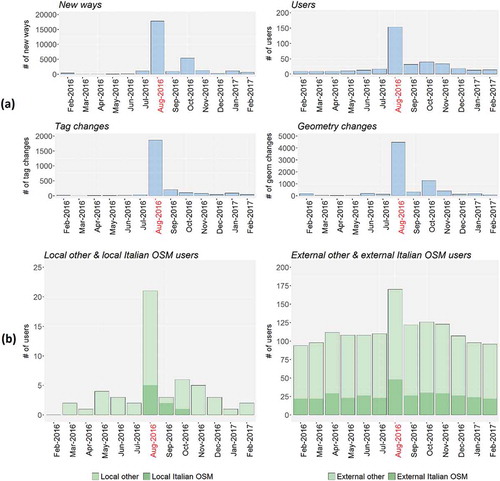
The bar charts in ) indicates an increase both in the number of local and external contributors around the time of the earthquake, where the relative increase is higher for local than for external users. An Italian task manager project was opened during the earthquake and managed by an Italian OSM team (OSM Tasking Manager – Wikimedia Italia Citation2016). ) shows that both external and local contributors are part of the Italian OSM team. While an increase in local OSM team member activities (left chart) lasts until 2 months after the earthquake, external OSM team members showed increased levels of activities only during the event (right chart).
Similar to the Nepal earthquake case, among contributors who mapped during the earthquake in the Italy crisis region, it is primarily the external contributors who continue their mapping activities in the region after the event and who already mapped before the event. The difference to Nepal is that local mappers are the minority of users (13.1%) also during the earthquake (compared to 54.7% for Nepal), meaning that the earthquake triggered only a moderate increase in mapping activities within the local OSM community. This can also be seen by the relatively small number of users in the left chart of ) for August 2016, compared to much larger user numbers in the right chart for that same month.
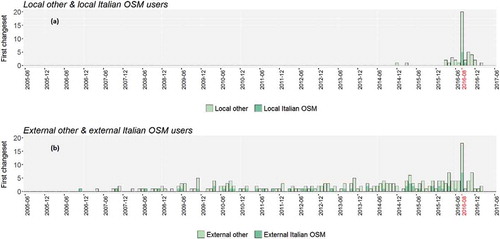
The timelines in show that a large percentage of local contributors (42.2%) who mapped during the Italy earthquake began their first contributions around that time ()), whereas a larger portion of external members (87.2%) had mapped before the first day of the earthquake ()). Therefore, the Italy earthquake attracted a somewhat different, i.e. more experienced, OSM mapper crowd than this was the case for Nepal.
Figure 6. Monthly numbers of first OSM change-sets submitted by local (a) and external (b) contributors who mapped in the affected Italy area during the earthquake.
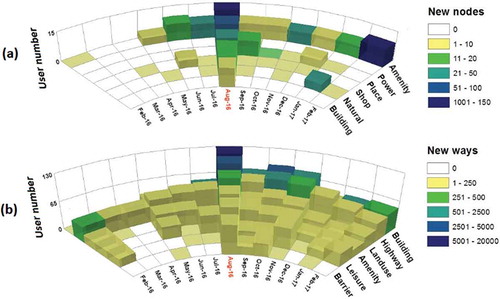
The proportion of created OSM node and way features of different types varied throughout the analyzed year (,)). Specifically, buildings (ways) and amenities (nodes) were more frequently mapped during and after the earthquake than before the event, suggesting that the mapping community considered these feature types particularly relevant to be mapped. As opposed to the Nepal case, only a few buildings were mapped as nodes, but instead mostly as ways. This areal digitization approach requires somewhat more experience. The largely external mapping community present in the affected Italy area with its multi-year mapping experience likely brings the necessary skills, which explains this somewhat different mapping pattern compared to Nepal.
Figure 7. Most prominent OSM node (a) and way (b) features mapped in the affected Italy area.
A chi-squared test revealed a statistical association between the change in the proportion of mapped node features (χ2 (5, N = 217) = 53.346, p < 0.0001) and way features (χ2 (5, N = 17,207) = 2,087, p < 2.2e-16) before and during the earthquake and the mapping region (i.e. affected area vs. reference area). A similar significant impact of the region was observed for a before and after comparison of mapped OSM feature types for node and way features.
4.2. Tweet activity patterns
4.2.1. Nepal earthquake
The average monthly numbers of geo-referenced tweets with exact coordinates posted during the analyzed one-year period around the Nepal earthquake (25 April 2015) and the aftershock (12 May 2015) are shown in ) (left). The same data for the New Delhi reference area as a control is shown in ) (right). The Nepal chart reveals a peak during the first month of the earthquake (April 2015), followed by a sharp decline in tweet numbers in May. The latter is caused by a change in the Twitter app interface which requires more steps from the user to post geo-tagged tweets with exact coordinates. The reference area in New Delhi shows a similar tweet pattern, however, with a less prominent peak during the 2 months of the earthquake compared to March. In both plots, the right axis of the chart (ranging between 0 and 1) shows the magnitude of contributions in the different months relative to the peak months, suggesting a drop of tweets numbers by over 50 percent due to changes in the application user interface. The reason we analyzed the Nepal earthquake and not another earthquake that did not undergo this decline in tweets due to technical changes is the magnitude of the Nepal earthquake, which allows to observe pronounced changes in Twitter activities. For example, a Myanmar earthquake occurred on the same day as the Italy earthquake (Zahra, Ostermann, and Purves Citation2017). However, it was less powerful than the one in Italy, causing fewer casualties (four people died compared to 297 in Italy) and less damage. ) also shows the monthly local and external user tweeting activities. A small increase in the proportion of tweets from external tweeting persons can be observed during the 2 months of the earthquake for Nepal, but not for New Delhi. This could be the result of international aid organizations operating in the affected area during these 2 months.
Figure 8. Average monthly number of tweets in the affected Nepal area and the New Delhi reference area (a) and daily number of tweets in both areas (b) (# = number).
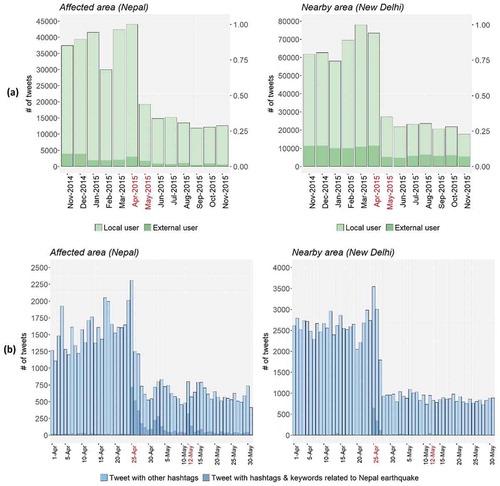
A refined analysis of daily tweet numbers for April and May reveals a similar peak on the day of the first earthquake (April 25) in the affected area () left) and the reference area () right). Additional hashtag and keyword analysis shows that a significant proportion of tweets in both regions is thematically related to the Nepal earthquake (darker bars in the figure). As opposed to this, hashtags and keywords related to the aftershocks are only found in the Nepal area. These results indicate that the Nepal earthquake was initially of interest to the tweeting community across an extended, international region, but that the interest in this topic faded after the first earthquake.
4.2.2. Italy earthquake
A spike in the average number of tweets during the month of the earthquake (August 2016) both within the affected area and the reference area (Sulmona) is shown in ).
Figure 9. Average monthly number of tweets in the affected Italy area and the Sulmona reference area (a) and daily number of tweets in both areas (b) (# = number).
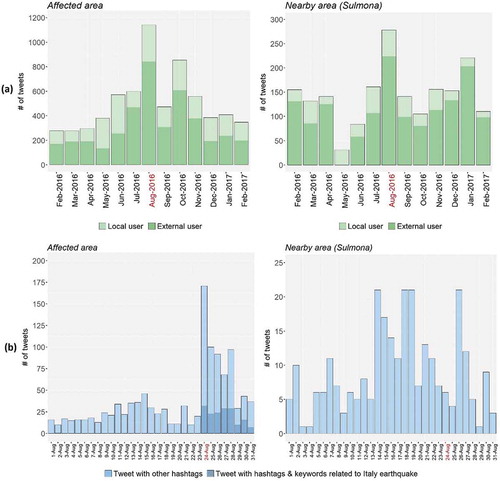
A closer look at daily tweet numbers, however, reveals that only the affected area (), left) experiences a peak on the day of the earthquake (August 24), whereas the reference area (), right) experiences no peak on that day. Additional hashtag and keyword analysis reveals that a significant proportion of tweets is thematically related to the earthquake only in the affected area (darker bars in ), left), but not in the reference area. This shows that the effect of the earthquake on Twitter behavior is limited to a local area in the Italy case.
5. Human dynamics
This section derives human travel patterns from OSM contributions and tweet activities for both analyzed earthquake regions. For OSM, the source tag of a change-set can among others indicate a local data collection activity (e.g. “GPS” or “survey”) or the use of remotely sensed online sources which do not require a physical presence at the mapped site (e.g. “satellite imagery” or “Bing Maps”). Oftentimes, however, the source field is left empty. shows for local and external OSM mappers the distribution of data sources during the 2 months around the Nepal earthquake event (April 1–May 31). To identify an external mapper who physically traveled to the crisis area to contribute to local mapping activities, the user needs to demonstrate local mapping activities in an external area before the crisis followed by local mapping activities in the affected area during the crisis (April 25–May 7).
Figure 10. Distribution of reported OSM sources by local (a) and external (b) contributors in the affected Nepal area (# = number).
For the Nepal earthquake, review of OSM data identified more than 1,390 international contributors (i.e. from outside Nepal) who mapped during that event in the affected area. These contributors were from 113 different countries ()). Sixteen of these contributors traveled to Nepal to participate in local mapping activities related to the Nepal earthquake event, based on the source tag analysis described before. Most of these contributors were from Europe. The flow lines in the figure reflect human dynamics in relation to this crisis event.
Figure 11. Nepal earthquake: OSM contributors (a) and Twitter users (b) by country, overlaid by user flow lines derived from both sources.
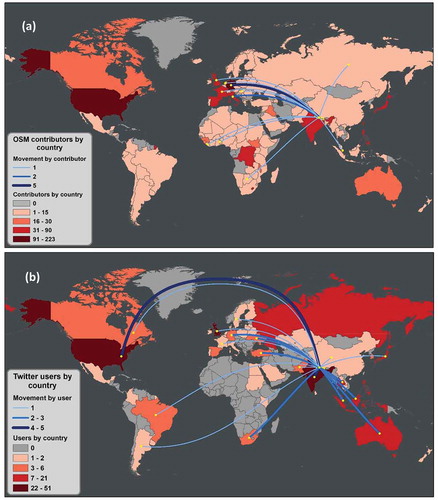
Location analysis of geotagged tweets under consideration of event-related hashtags and keywords identified more than 150 international users from 44 different countries who tweeted during the Nepal earthquake event from within the affected area, but not all of them tweeted from other areas before the event. Among the 150 users, 23 traveled to Nepal to participate in aid and rescue operations, based on identified previous tweet activities outside Nepal and analyzed keywords ()). Most of these users were found to travel from the United States. In addition to this, 75 of the 98 external Nepal users (i.e. users who posted primarily from outside the affected area but from within Nepal) were identified to travel from other areas of Nepal to the earthquake affected area for the purpose of aid and rescue operations, based on keyword analysis. Additionally, the analysis discovered another 65 movements to the Nepal crisis region from within and outside Nepal that matched the expected spatial movement pattern but did not have a rescue operation related keyword. The choropleth map in ) shows the number of international users from different home countries around the world who tweeted during the event in the affected area (but who did not necessarily travel there in response to the event to participate in rescue operations).
OSM data analysis for the Italy earthquake identified 50 international contributors from 25 different countries who mapped remotely during that event in the affected area. Three users traveled from other regions in Italy to the area affected by the earthquake, but based on source tag analysis, no OSM user from outside Italy visited the affected region for crisis mapping.
Location analysis of geotagged tweets identified 15 international users from 6 different countries who were tweeting during the Italy earthquake from the affected area, however none of these posts contained keywords related to rescue operations. Also, 17 of the external Twitter users came from other regions of Italy to the area affected by the earthquake and used keywords related to rescue operations.
For both OSM and Twitter, the number of contributors per country and travelers to the earthquake region is sufficiently high for Nepal to generate flow and choropleth maps for visualization, but it is too small to run more detailed statistical analyses (e.g. proportion of travelers among the country population, the influence of travel distance on travel activities). For OSM, the countries with most data contributions to the Nepal earthquake affected area correspond to those countries with a generally active OSM mapping community (Neis and Zipf Citation2012), including Germany, the U.S., and some other European countries. Also India, which is bordering Nepal to the north, reflects a high OSM contribution activity. ) shows that the US, which is one of the countries with the highest Twitter penetration rate in the world (Hawelka et al. Citation2014), has the highest number of users tweeting from the event in Nepal besides neighboring India. Since the sample size of event related tweets is smaller for the Italy earthquake, it was not possible to draw clear conclusions about human dynamics and international tweets patterns for that event, which is why no corresponding map is shown for the Italy earthquake. The travel analysis in this study reflected the level of internationality associated with the different crisis events. The Nepal affected area receives more international mapping activities and registers more international travel activities than Italy, which could indicate that developing countries need (and receive more) assistance from abroad than developed countries for such events, based our case study.
6. Conclusions
This study expands previous research on event-based VGI contribution behavior (Neis, Zielstra, and Zipf Citation2013; Zielstra et al. Citation2014) in various aspects. It analyzes the proportion of local and external contributors in mapping and tweeting activities before, during, and after the analyzed earthquakes, the change in OSM feature types mapped, the proportion of newbies and experienced OSM users mapping in response to these events, the effect of the events on tweet frequency in affected and reference regions, as well as worldwide travel patterns to disaster events. The study presented a novel approach to derive an OSM mapper’s physical presence in an event area during mapping, using the source tag from change-sets. There are limitations to this method, such as data scarcity or potential incorrect tagging, but the approach is a first attempt to produce a general map about travel dynamics, which could possibly be refined in future steps.
In summary, it can be stated that natural crises have a clear impact on OSM contribution patterns and tweet activities. For both analyzed study areas the number of local and external OSM contributors increased significantly during the time of the crises, where external OSM contributors kept a more active level of mapping in the crisis region after the event than local contributors. A series of chi-squared tests showed that an earthquake has a significant effect on the OSM feature types being mapped in both cases of Nepal and Italy, reflecting a disproportionally strong emphasis on the mapping of building and highway features after the earthquake, as can be expected from the mission of HOT mapping tasks. The analysis results show more OSM feature edits and users contributing to event-related mapping efforts in Nepal than in Italy (compare and ). This could be explained by the lack of detailed OSM maps in the Nepal region before the earthquake, as a consequence of a poorer economy, less developed communication infrastructure, or other social and environmental factors (Heipke Citation2010; Gröchenig, Brunauer, and Rehrl Citation2014).
Twitter data analysis, based on keyword selection, showed that news about earthquakes are posted both in affected areas (whether they are rural or urban) and to some extent in relatively nearby urban areas (i.e. New Delhi), but not in nearby rural areas (Sulmona control area for Italy). This suggests that this type of disaster is treated as a local event in the Twitter information landscape in rural areas, but reaches beyond the affected area in, typically better connected, metropolitan areas with a wider range of information channels about current events.
The study demonstrates that especially OSM can provide relatively up-to-date in-situ information about areas affected by natural disasters which is necessary for effective disaster management (Poser and Dransch Citation2010). It shows that part of the OSM community is engaged in elevated mapping activities up to a month or two after such an event, where especially the continued engagement of the (small) local mapping community can contribute to the accurate mapping of features that may have been affected by the earthquake (e.g. closed roads). The two showcases of this study, which captured OSM contribution behavior after earthquakes in remote (Nepal) and rural (Italy) areas, showed that external users played a major role in OSM mapping. Although large, metropolitan areas around the world with a strong OSM presence have a considerable share of external mapper contributions (Neis, Zielstra, and Zipf Citation2013), we would nevertheless expect that, in case of a natural disaster in an urbanized area with strong OSM presence, the mapping activities in the aftermaths of such an event would be primarily conducted by the local community on site due to its mapping experience and local knowledge. We would also expect that the need for physical travel to the site, which was found to be extensive in the Nepal case, decreases if such an event occurred in an urban area with a strong local OSM mapping community already present.
Part of the analysis conducted in this study relied on metadata about contributions from individual OSM and Twitter users, such as the past locations of OSM edits or the tweeting history of an individual user to distinguish between local and external users. In the future, the implementation of new governmental data protection guidelines may restrict the type of user metadata that become available. This may have implications for the analysis of crowd-soured data in similar future projects. A prominent example of such guidelines is the recent general data protection regulation (GDPR) for the European Union (EU) which aims to give control to citizens over their personal data and hence strictly regulates the processing and storage of personal data for any organization that collects and processes personal data of individuals located inside the EU. The OSM Foundation License Working Group (LWG) investigated the impact of the GDPR on the OSM project and took several steps in the adaptation of user policies and data handling to adhere to GDPR guidelines (OSMF Licence Working Group Citation2018). One change is that, in order to access metadata (user account ID, display ID, timestamp, change-set ID, etc.), the contributors will need to be logged on and have agreed to a set of Terms of Understanding. Hence, metadata are removed for geo-data “dumps” and “diffs”, as well as for data obtained from the Website and via API for anonymous consumers. The LWG also suggested to update the Contributor Terms and Privacy Policy to explicitly describe and require affirmative consent to all data processing. Furthermore, based on the right to be forgotten, the LWG suggests removal of account specific information of deleted accounts (e.g. e-mail address) retroactively to existing data dumps. Twitter also announced adaptations to its platform in May 2018 in anticipation of new EU privacy laws going into effect. Besides changes in terms and policies a change in product offerings involves user time zones to become private values in the API, and stored background profile image data being removed (Twitter Developers Citation2018). The analysis techniques presented in this paper would, however, still have been possible even under the new GDPR regulations. Hence this kind of analysis can be replicated for other types of natural disasters (e.g. wildfires, floods) in the near future, unless even more strict data privacy guidelines will prevent this.
For future work, we plan to extend the analyses to other events, such as wildfires or floods. Another aspect is to determine if individual users contribute to one or several crowd-sourcing platforms in the case of crisis events and whether related information is cross-tagged between different data sources (Juhász and Hochmair Citation2016).
Additional information
Notes on contributors
Ahmed Ahmouda
Ahmed Ahmouda is a PhD candidate and graduate assistant in the Geomatics Program, University of Florida. In his research, he analyzes how political and natural crises affect contribution patterns to crowd-sourced data platforms and social media activities. He received his master’s degree in Geographic Information Systems from the University of Redlands, California.
Hartwig H. Hochmair
Hartwig Hochmair is an associate professor of Geomatics at the University of Florida where he teaches courses in GIS, digital mapping, adjustment computations, and geodesy. In his research, he focuses on the quality assessment of crowd-sourced geo-data, and the analysis of transportation networks and travel behavior with a focus on bicycle and public transportation. He obtained his PhD degree in Geographic Information Science from the Technical University of Vienna, Austria.
Sreten Cvetojevic
Sreten Cvetojevic is a PhD candidate from the Geomatics Program at the University of Florida. His research evolves around information propagation in social networks, including Twitter. He obtained his master’s degree in Telecommunications Engineering from the University of Belgrade, Serbia.
References
- Acar, A., and Y. Muraki. 2011. “Twitter for Crisis Communication: Lessons Learned from Japan’s Tsunami Disaster.” International Journal of Web based Communities 7 (3): 392−402. doi:10.1504/IJWBC.2011.041206.
- Ahmouda, A., and H. H. Hochmair. 2017. “Using Volunteered Geographic Information to Measure Name Changes of Artificial Geographical Features as a Result of Political Changes: A Libya Case Study.” GeoJournal 83 (2): 237−255.
- Alivand, M., and H. H. Hochmair. 2017. “Spatiotemporal Analysis of Photo Contribution Patterns to Panoramio and Flickr.” Cartography and Geographic Information Science 44 (2): 170−184. doi:10.1080/15230406.2016.1211489.
- Arsanjani, J. J., P. Mooney, M. Helbich, and A. Zipf. 2015. “An Exploration of Future Patterns of the Contributions to OpenStreetMap and Development of a Contribution Index.” Transactions in GIS 19 (6): 896−914. doi:10.1111/tgis.12139.
- Austin, L., B. F. Liu, and Y. Jin. 2012. “How Audiences Seek out Crisis Information: Exploring the Social-mediated Crisis Communication Model.” Journal of Applied Communication Research 40 (2): 188−207. doi:10.1080/00909882.2012.654498.
- Azmandian, M., K. Singh, B. Gelsey, Y. H. Chang, and R. Maheswaran. 2012. “Following Human Mobility Using Tweets.” The 8th International Workshop of Agents and Data Mining Interaction, Valencia, Spain, June 4−5.
- Basiri, A., P. Amirian, and P. Mooney. 2016. “Using Crowdsourced Trajectories for Automated OSM Data Entry Approach.” Sensors 16 (9): 1510. doi:10.3390/s16122100.
- Budhathoki, N. R., and C. Haythornthwaite. 2013. “Motivation for Open Collaboration: Crowd and Community Models and the Case of OpenStreetMap.” American Behavioral Scientist 57 (5): 548−575. doi:10.1177/0002764212469364.
- Cassa, C. A., R. Chunara, K. Mandl, and J. S. Brownstein. 2013. “Twitter as a Sentinel in Emergency Situations: Lessons from the Boston Marathon Explosions.” PLOS Currents. doi:10.1371/currents.dis.ad70cd1c8bc585e9470046cde334ee4b.
- Crooks, A., A. Croitoru, A. Stefanidis, and J. Radzikowski. 2013. “#Earthquake: Twitter as a Distributed Sensor System.” Transactions in GIS 17 (1): 124−147. doi:10.1111/j.1467-9671.2012.01359.x.
- Cvetojevic, S., and H. H. Hochmair. 2018. “Analyzing the Spread of Tweets in Response to Paris Attacks.” Computers, Environment and Urban Systems. doi:10.1016/j.compenvurbsys.2018.03.010.
- Cvetojevic, S., L. Juhasz, and H. H. Hochmair. 2016. “Positional Accuracy of Twitter and Instagram Images in Urban Environments.” GI_Forum 1: 191−203. doi:10.1553/giscience2016_01_s191.
- de Albuquerque, J. P., B. Herfort, A. Brenning, and A. Zipf. 2015. “A Geographic Approach for Combining Social Media and Authoritative Data Towards Identifying Useful Information for Disaster Management.” International Journal of Geographical Information Science 29 (4): 667−689. doi:10.1080/13658816.2014.996567.
- Dittus, M., G. Quattrone, and L. Capra. 2017. “Mass Participation during Emergency Response: Event-centric Crowdsourcing in Humanitarian Mapping.” The 20th ACM Conference on Computer-supported Cooperative Work and Social Computing, Portland, Oregon, USA, February 25−March 01.
- Goodchild, M. F. 2007. “Citizens as Sensors: The World of Volunteered Geography.” GeoJournal 69 (4): 211−221. doi:10.1007/s10708-007-9111-y.
- Goodchild, M. F., and J. A. Glennon. 2010. “Crowdsourcing Geographic Information for Disaster Response: A Research Frontier.” International Journal of Digital Earth 3 (3): 231−241. doi:10.1080/17538941003759255.
- Goolsby, R. 2010. “Social Media as Crisis Platform: The Future of Community Maps/Crisis Maps.” ACM Transactions on Intelligent Systems and Technology (TIST) 1 (1): Article 7.
- Graham, M., S. A. Hale, and D. Gaffney. 2014. “Where in the World are You? Geolocation and Language Identification in Twitter.” The Professional Geographer 66 (4): 568−578. doi:10.1080/00330124.2014.907699.
- Gröchenig, S., R. Brunauer, and K. Rehrl. 2014. “Digging into the History of VGI Data-sets: Results from a Worldwide Study on OpenStreetMap Mapping Activity.” Journal of Location based Services 8 (3): 198−210. doi:10.1080/17489725.2014.978403.
- Hawelka, B., I. Sitko, E. Beinat, S. Sobolevsky, P. Kazakopoulos, and C. Ratti. 2014. “Geo-located Twitter as Proxy for Global Mobility Patterns.” Cartography and Geographic Information Science 41 (3): 260−271. doi:10.1080/15230406.2014.890072.
- Haworth, B., and E. Bruce. 2015. “A Review of Volunteered Geographic Information for Disaster Management.” Geography Compass 9 (5): 237−250. doi:10.1111/gec3.12213.
- Heipke, C. 2010. “Crowdsourcing Geospatial Data.” ISPRS Journal of Photogrammetry and Remote Sensing 65 (6): 550−557. doi:10.1016/j.isprsjprs.2010.06.005.
- Hong, L., G. Convertino, and E. H. Chi. 2011. “Language Matters in Twitter: A Large Scale Study.” The 5th International AAAI Conference on Weblogs and Social Media, Barcelona, Spain, July 17−21.
- Juhász, L. and Hochmair, H. H. (2016). “Cross-linkage between Mapillary Street Level Photos and OSM Edits”. In Geospatial Data in a Changing World: Selected papers of the 19th AGILE Conference on Geographic Information Science (Lecture Notes in Geoinformation and Cartography Series), edited by T. Sarjakoski, M. Y. Santos & T. Sarjakoski, 141–156. Berlin: Springer.
- Li, W., C. A. Airriess, A. C. C. Chen, K. J. Leong, and V. Keith. 2010. “Katrina and Migration: Evacuation and Return by African Americans and Vietnamese Americans in an Eastern New Orleans Suburb.” The Professional Geographer 62 (1): 103−118. doi:10.1080/00330120903404934.
- Middleton, S. E., L. Middleton, and S. Modafferi. 2014. “Real-time Crisis Mapping of Natural Disasters Using Social Media.” IEEE Intelligent Systems 29 (2): 9−17. doi:10.1109/MIS.2013.126.
- Napolitano, M., and P. Mooney. 2012. “MVP OSM: A Tool to Identify Areas of High Quality Contributor Activity in OpenStreetMap.” The Bulletin of the Society of Cartographers 45 (1): 10−18.
- Neis, P., D. Zielstra, and A. Zipf. 2013. “Comparison of Volunteered Geographic Information Data Contributions and Community Development for Selected World Regions.” Future Internet 5 (2): 282−300. doi:10.3390/fi5020282.
- Neis, P., and A. Zipf. 2012. “Analyzing the Contributor Activity of a Volunteered Geographic Information Project - The Case of OpenStreetMap.” ISPRS International Journal of Geo-Information 1 (2): 146−165. doi:10.3390/ijgi1020146.
- OpenStreetMap Wiki. 2018a. “Humanitarian OSM Team.” http://wiki.openstreetmap.org/wiki/Humanitarian_OSM_Team
- OpenStreetMap Wiki. 2018b. “Stats.” https://wiki.openstreetmap.org/wiki/Stats
- OSM Tasking Manager - Wikimedia Italia. 2016. “#13 - Terremoto Centro Italia 24- 08-2016.” http://osmit-tm.wmflabs.org/project/13
- OSMF Licence Working Group. 2018. “White Paper on the Introduction of the General Data Protection Regulation.” https://wiki.openstreetmap.org/w/images/8/88/GDPR_Position_Paper.pdf
- Palen, L., R. Soden, T. J. Anderson, and M. Barrenechea. 2015. “Success & Scale in a Data-producing Organization: The Socio-technical Evolution of OpenStreetMap in Response to Humanitarian Events.” The 33rd Annual ACM Conference on Human Factors in Computing Systems, Seoul, Republic of Korea, April 18−23.
- Poiani, T. H., R. Dos Santos Rocha, L. C. Degrossi, and J. P. de Albuquerque. 2016. “Potential of Collaborative Mapping for Disaster Relief: A Case Study of OpenStreetMap in the Nepal Earthquake 2015.” The 49th Hawaii International Conference on System Science, Koloa, HI, USA, Januay 5−8.
- Poser, K., and D. Dransch. 2010. “Volunteered Geographic Information for Disaster Management with Application to Rapid Flood Damage Estimation.” Geomatica 64 (1): 89−98.
- Qi, W., and E. T. John. 2014. “Quantifying, Comparing Human Mobility Perturbation during Hurricane Sandy, Typhoon Wipha, Typhoon Haiyan.” Procedia Economics and Finance 18: 33−38. doi:10.1016/S2212-5671(14)00910-1.
- Ramm, F., and J. Topf. 2010. OpenStreetMap. 3rd ed. Berlin: Lehmanns Media.
- Rehrl, K., Gröchenig, S., Hochmair, H. H., Leitinger, S., Steinmann, R., and Wagner, A. (2013). “A Conceptual Model for Analyzing Contribution Patterns in the Context of VGI”. In Progress in Location Based Services (Lecture Notes in Geoinformation and Cartography Series), edited by J. M. Krisp, 373–388. Springer: Berlin.
- Resch, B., F. Usländer, and C. Havas. 2018. “Combining Machine-learning Topic Models and Spatiotemporal Analysis of Social Media Data for Disaster Footprint and Damage Assessment.” Cartography and Geographic Information Science 54 (4): 362−376.
- Rettberg, J. W., and R. Gajjala. 2016. “Terrorists or Cowards: Negative Portrayals of Male Syrian Refugees in Social Media.” Feminist Media Studies 16 (1): 178−181. doi:10.1080/14680777.2016.1120493.
- The Royal Gazette. 2016. “Reinsurers Face up to $166m Italy Quake Loss.” http://www.royalgazette.com/re-insurance/article/20160901/reinsurers-face-up-to-166m-italy-quake-loss
- Soden, R., and L. Palen. 2014. “From Crowdsourced Mapping to Community Mapping: The Post-Earthquake Work of OpenStreetMap Haiti.” The 11th International Conference on the Design of Cooperative Systems, Nice, France, May 27−30.
- Soden, R., and L. Palen. 2016. “Infrastructure in the Wild: What Mapping in Post-earthquake Nepal Reveals about Infrastructural Emergence.” The 2016 CHI Conference on Human Factors in Computing Systems, San Jose, California, USA, May 07−12.
- Steiger, E., J. P. Albuquerque, and A. Zipf. 2015. “An Advanced Systematic Literature Review on Spatiotemporal Analyses of Twitter Data.” Transactions in GIS 19 (6): 809−834. doi:10.1111/tgis.12132.
- Twitter Developers. 2018. “Upcoming Changes to the Developer Platform.” https://twittercommunity.com/t/upcoming-changes-to-the-developer-platform/104603
- USGS. 2015. “M 7.8-36km E of Khudi, Nepal.” https://earthquake.usgs.gov/earthquakes/eventpage/us20002926#map
- USGS. 2016. “M 6.2-10km SE of Norcia, Italy.” https://earthquake.usgs.gov/earthquakes/eventpage/us10006g7d#map
- Valle, D., S. Cvetojevic, E. P. Robertson, B. E. Reichert, H. H. Hochmair, and R. J. Fletcher. 2017. “Individual Movement Strategies Revealed through Novel Clustering of Emergent Movement Patterns.” Scientific Reports 7: 44052. doi:10.1038/srep44052.
- Zagheni, E., V. R. K. Garimella, and I. Weber. 2014. “Inferring International and Internal Migration Patterns from Twitter Data.” The 23rd International Conference on World Wide Web, Seoul, Korea, April 07−11.
- Zahra, K., F. O. Ostermann, and R. S. Purves. 2017. “Geographic Variability of Twitter Usage Characteristics during Disaster Events.” Geo-spatial Information Science 20 (3): 231−240. doi:10.1080/10095020.2017.1371903.
- Zhang, C. M., and V. Paxson. 2011. “Detecting and Analyzing Automated Activity on Twitter.” The 12th International Conference on Passive and Active Measurement, Atlanta, USA, March 20−22.
- Zielstra, D., H. H. Hochmair, P. Neis, and F. Tonini. 2014. “Areal Delineation of Home Regions from Contribution and Editing Patterns in OpenStreetMap.” ISPRS International Journal of Geo-information 3 (4): 1211−1233.
- Ziemke, J. 2012. “Crisis Mapping: The Construction of a New Interdisciplinary Field?” Journal of Map & Geography Libraries 8 (2): 101−117. doi:10.1080/15420353.2012.662471.
- Zook, M., M. Graham, T. Shelton, and S. Gorman. 2010. “Volunteered Geographic Information and Crowdsourcing Disaster Relief: A Case Study of the Haitian Earthquake.” World Medical & Health Policy 2 (2): 7−33. doi:10.2202/1948-4682.1069.