ABSTRACT
The social functionality of places (e.g. school, restaurant) partly determines human behaviors and reflects a region’s functional configuration. Semantic descriptions of places are thus valuable to a range of studies of humans and geographic spaces. Assuming their potential impacts on human verbalization behaviors, one possibility is to link the functions of places to verbal representations such as users’ postings in location-based social networks (LBSNs). In this study, we examine whether the heterogeneous user-generated text snippets found in LBSNs reliably reflect the semantic concepts attached with check-in places. We investigate Foursquare because its available categorization hierarchy provides rich a-priori semantic knowledge about its check-in places, which enables a reliable verification of the semantic concepts identified from user-generated text snippets. A latent semantic analysis is conducted on a large Foursquare check-in dataset. The results confirm that attached text messages can represent semantic concepts by demonstrating their large correspondence to the official Foursquare venue categorization. To further elaborate the representativeness of text messages, this work also performs an investigation on the textual terms to quantify their abilities of representing semantic concepts (i.e., representativeness), and another investigation on semantic concepts to quantify how well they can be represented by text messages (i.e., representability). The results shed light on featured terms with strong locational characteristics, as well as on distinctive semantic concepts with potentially strong impacts on human verbalizations.
1. Introduction
Considerable technological advancements in recent years have made possible the widespread use of location-based social networks (LBSNs) like the check-in service Foursquare (now called Swarm). On LBSN platforms, users check-in to places and publish details about their daily life, including experiences, opinions, and emotions in the form of attached text snippets and ratings. Recently, LBSNs and other forms of social media have attracted considerable research interest in the social and geospatial sciences, and were utilized in different fields such as human mobility studies (Cho, Myers, and Leskovec Citation2011; Wang et al. Citation2011), location recommendation (Noulas et al. Citation2012a; Ye, Yin, and Lee Citation2010), traffic forecasting (Abbasi et al. Citation2015; Abidin, Kolberg, and Hussain Citation2015), event detection (Chen and Roy Citation2009; Gupta, Li, and Chang Citation2014), disaster management (de Albuquerque et al. Citation2015; Kongthon et al. Citation2012), and the public health domain (Burton et al. Citation2012; Lee, Agrawal, and Choudhary Citation2013).
Locational information on Foursquare appears in two forms: the coordinates of the check-ins and the corresponding venue names. The latter place names are particularly interesting given that these are semantic descriptors possibly reflecting social functionalities or affordances. The semantic dimension of geolocation and place often provides rich information about human routine and casual behaviors (e.g. dinning, working) as well as vernacular or explicated functions of regions (e.g. business, education). These semantics, however, are not always fully covered by the place names commonly provided by LBSNs. Although some place names may hint on deeper semantic descriptions revealing the functionality of a venue (e.g. Yankee Stadium), many names do not provide this kind of information in an explicit and trivially exploitable form. Clearly, links between place descriptions and their most likely functionalities and characterizations must be inferred from additional information provided by the users along with their check-ins.
Assuming a link between human verbalization and whereabouts, the user-generated text snippets might (at least partially) reflect some semantic configurations of the associated places. For example, users might probably mention terms like dining, spaghetti, or delicious when they check-in at some restaurant. Reversely, a text message containing similar terms is likely to be related to a restaurant. In fact, this assumption has been widely adopted in investigations of related geosocial media platforms such as Twitter where text messages have been leveraged widely to infer semantic properties of locations for a range of purposes (Hiruta et al. Citation2012; Kim, Lee, and Kyeong Citation2013; Mostafa Citation2013; Sengstock and Gertz Citation2012; Steiger et al. Citation2015; Tang and Liu Citation2010). Still, given the complexity of human communication, this strategy might be considered positivist and naïve in terms of concerns regarding the validity of the identified semantic concepts (i.e., the conceptualizations of the semantics of a place, as verbalized textually by users) with respect to the true ones associated with given places. It is hence necessary to investigate the representativeness of text messages for the semantic concepts associated with the underlying Foursquare check-in venues.
The main idea of Foursquare is to check-in at predefined venues rather than posting textual messages. The potential value of text messages attached to Foursquare datasets is thus often overlooked. Existing studies on Foursquare mainly focus on human spatiotemporal mobility, and the obtained knowledge in this aspect is applied to a range of applications such as recommending venues (Noulas et al. Citation2012b), inferring user profiles (Vasconcelos et al. Citation2012), predicting user interest (Li et al. Citation2016), and inferring user activity (Noulas, Mascolo, and Frias-Martinez Citation2013). Although Foursquare was not primarily designed for posting texts, our dataset of 579,786 Foursquare check-ins (crawled from February 1 to June 30 in 2014) shows that 306,388 of them come with text attachments, which amounts to more than half of the entire dataset. Aside of the optional text messages, the locational information found in Foursquare datasets has been enriched by a mandatory semantic description of check-in places through venue categories. Similarly, to the folksonomy representing the thematic dimensions of the OpenStreetMap project (Mocnik, Zipf, and Raifer Citation2017), the Foursquare venue categories are generated by users and, after adoption by Foursquare, organized into a predefined categorization hierarchy. This way, the well-organized information of venue categories provides a-priori semantic knowledge, which can be used to validate the identified semantic concepts from the text messages. This makes Foursquare well suited for the purpose of this study, which is to examine whether (and how well) the user-generated text messages in LBSNs represent semantic concepts of locations.
In line with this research objective, three research questions (RQs) are raised:
RQ 1:
Are the semantic concepts identified from the text messages compatible with those given by the Foursquare categorization?
RQ 2:
How well can single terms represent semantic concepts?
RQ 3:
How well can associated text messages represent semantic concepts?
RQ 1 examines the feasibility of representing semantic concepts with text messages in LBSNs in a general sense. The other two questions discuss further investigations of individual terms and semantic concepts. RQ 2 assumes that some terms may have stronger locational characteristics and could be more closely linked to the semantic concepts of the associated places. In contrast, RQ 3 assumes that some semantic concepts may have stronger impact on the users’ postings, which could facilitate their representations in text messages. Hence, they concern the representativeness of terms and representability of semantic concepts respectively. In general, the answers to these RQs can lead to a more sophisticated understanding of the text messages in Foursquare for representing the semantic concepts about the respective places. This, in turn, contributes to a better understanding of the quality of the links between places and peoples’ textual verbalizations. The study results are thus also interesting for investigations of other, text-based forms of social media like Twitter.
The remainder of this paper is organized as follows: Section 2 explains the official Foursquare categorization, describes our employed dataset and relevant pre-processing procedures, and introduces a convention of this paper. Section 3 outlines the major technique of this work, i.e., the latent semantic analysis (LSA), and answers RQ 1. Sections 4 and 5 then focus on evaluating the representativeness of terms (RQ 2) and the representability of semantic concepts (RQ 3), respectively. The paper closes with a discussion of the results and by drawing a conclusion.
2. Background and data
This section explains the Foursquare dataset in general, as well as our used dataset and processing procedures. A convention of this paper is also included in this section.
2.1 The categorization hierarchy of Foursquare
Foursquare is one of the most popular LBSN platforms, with more than 55 million users and over 6 billion check-ins (BrandonGaille Citation2015). Every time a user checks into a place, a unique data record, i.e., a check-in, is created in the Foursquare database with a timestamp, geographic coordinates, possibly text messages, and further attributes. The place being checked-in is referred to as a venue, which is recorded in the database with its name, location, category, user ratings, and tips. Users can either select an existing category or manually specify a new one for a venue when they make a check-in. The attached categorical information of venues is one of the most distinctive features that distinguish Foursquare from other LBSNs (Cramer, Rost, and Holmquist Citation2011), as it is able to provide an additional insight into the semantic concepts of the check-in places.
Although the user-generated categorical information can provide rich semantic information about the venue, the messy crowd-sourcing data would hinder its proper use. Hence, Foursquare provides an official pre-defined categorization hierarchyFootnote1 to organize this information into kind of agreed upon topics. The official categorization hierarchy is regularly extended by additional user-generated categories. Up to the date of this study in November 2016, this hierarchy contains 886 categories organized into five levels. The first level contains 10 main categories, each of which is linked to several secondary categories. That second level, in turn, contains 437 secondary categories, but only a subset (49) of them is linked to any tertiary category. The third, fourth, and fifth hierarchical levels contain 345, 81, and 13 categories, respectively.
2.2 Dataset description
A five-month check-in dataset (covering a period from 1 February to 30 June 2014) from New York City, US, is crawled for the purpose of this study. The dataset comprises 579,786 raw check-ins; 306,388 of which are accompanied by optional text messages. Considering that some users tend to contribute duplicate check-ins including the same text messages, these duplicates are removed as they would affect the analysis otherwise. After the removal of redundant information, 297,781 check-ins (51.36% of the initial data) remain. Please note that Foursquare has updated its venue categorization in 2016 and all the following results are thus based on the older version of the venue categorization.
2.3 Data pre-processing
Separate data pre-processing procedures are applied to the text messages and the venue categories. The pre-processing of text messages involves natural language processing (NLP) steps. These include the removal of URLs, special characters, punctuations, and emoji, and the reformatting of numbers and repetitive characters (e.g. like in yeeees).
Because venue categories are defined hierarchically, a category might be represented at multiple levels, and thus multiple times simultaneously. For example, a Chinese Restaurant at the third level has its representation as Asian Restaurant in the second level and Food in the first level. Such polysemy might introduce semantic ambiguity to the analysis. To avoid this effect, all analytical steps should be performed on the same hierarchical level, where each category would be represented only once. This target level is comparable to the “scale” of an analysis, which corresponds here to the semantic granularity. Clearly, the third, fourth, and fifth levels are not appropriate candidates, because these are not exhaustive with respect to all categories. The first level, in contrast, is superordinate to all categories and would in consequence fail to provide sufficient semantic detail. Hence, the second level, which is both exhaustive and precise, is chosen as the target level.
Having all categories mapped onto the second level, 337 out of the 437 official secondary categories are actually mentioned in our dataset and utilized within the subsequent steps. These 337 categories do not show the same degree of popularity among users. The most popular 30 categories are depicted in , with the popularities of all 337 categories given in the upper-right corner. demonstrates the oftentimes observed long-tail distribution of characteristics in social media data. The dominance of the dataset by few popular categories calls for specific treatment, which is explained in detail in Section 3.2.
Figure 1. The popularities of Foursquare secondary categories in the pre-processed dataset.
2.4 Conventions
For the convenience of the following discussions, here we introduce some conventions for the remainder of this paper. From here afterward, single terms from the Foursquare texts are formatted as italic and lowercased (e.g. happy, dinning), and semantic concepts (or venue categories) are italic with capitalized first letters (e.g. Hotel, Italian Restaurant). Additionally, in figures, terms are printed as grayish, while semantic concepts are colored by their corresponding main categories in the Foursquare hierarchy.
2.5 Notes on potential limitations
This study is based on user-specified verbalizations of place semantics. These can be complex, and there is thus a risk that some of the Foursquare venue types might be overly simplistic leading to a mismatch with the assessed topic. Similarly, because our employed method LSA draws on a bag-of-words model, this might also affect the quality of the assessed topics. We consider, however, that these points should only have minor impacts on the achieved results. First, the Foursquare categorization of venue types is rather detailed and should capture a broad range of concepts. Second, the venue types are relatively well defined and do not cover colloquial and vernacular concepts. The data quality of the check-ins can therefore be heterogeneous. However, given the fitness-of-purpose of the data (see Mocnik, Zipf, and Fan Citation2017) for a discussion on data quality and fitness-for-purpose) for the present investigation, we are sure that there may have been only minor negative effects on the results achieved.
3. Identification of semantic concepts from text messages
This section discusses how well the latent semantic concepts conveyed by text messages correspond to the Foursquare categorization. The discussion is based on LSA (see Section 3.1) and aims to answer RQ 1.
3.1 Latent semantic analysis (LSA)
LSA extracts underlying (and thus latent) semantic concepts from textual documents. It is a well established text-mining technique, which has been used frequently for a range of purposes such as text classification (Sebastiani Citation2002), document ranking, or indexing (Deerwester et al. Citation1990; Gong and Liu Citation2001) and sentiment analysis (Maas et al. Citation2011; Wang and Wan Citation2011). Based upon a term-document matrix describing the occurrences of terms in documents, the technique assumes that terms with close meaning tend to co-occur in documents. The key to LSA is a singular value decomposition (SVD), a generalization of the eigenvalue decomposition toward singular and rectangular matrices. The ultimate goal of LSA is then to reduce the semantic dimensionality and find a low-rank approximation to the original matrix. With a lower rank, not only the computational load can be reduced, but also the most significant features can be identified from the noisy original matrix through evaluating the singular values. These identified features are represented by several uncorrelated dimensions (in analogy to eigenvectors), which span a semantic space. The original matrix can then be mapped onto that semantic space, so that the similarities between terms or documents can be measured in terms of the underlying semantic dimensions.
3.2 Data resampling and document construction
Applying LSA to social media messages typically means to treat each individual piece of plain text (e.g. a Twitter tweet) as a single document. In this paper, however, this straightforward strategy is adapted by taking into account the Foursquare venue categories. Prior to LSA and for each venue type, a list of synthetic documents is compiled from the text snippets attached to them. Each document, in turn, comprises a number of text messages that are all associated with the same check-in types of a specific venue category. The least 100 popular categories are neglected for the following steps, because each of them comprises less than 30 text messages, leaving 237 documents left for LSA. Applying this strategy, each document can be interpreted as one venue category (or one semantic concept). Thus, the goal with respect to RQ 1 is now to investigate whether the semantic space obtained by LSA is compatible to the venue categories provided by Foursquare.
The document construction process also handles the diversity issue of the category popularities by resampling. As depicted in , the 237 categories are not uniformly distributed. If all text messages are allocated to the corresponding synthetic documents as they are, the documents representing extremely popular categories (such as Bar and Airport) would have a disproportionate impact on the results. As we are interested in the semantic concepts rather than depicting their popularities, such impact would be a major disturbing factor. We hence resampled the data for document construction with the following strategy:
Ni denotes the original message counts of a venue category Ci, whereas Ñi is the adjusted number of sampled messages in the respectively constructed document. Variables m and k reflect tunable auxiliary parameters to control the base sample size and the slope. In this study, m is adjusted to 1,394 (85th percentile of Ni) and k is empirically set as 30. Our proposed strategy from Equation (1) attenuates the sample sizes for popular categories while it ensures sufficient sample representations for less popular categories, so that the popular categories do not inflate and, as a result, bias the results. It is conceptually similar to a stabilization of the variability among the message counts, and its rationale is further demonstrated by graphic illustrations in Appendix 1.
3.3 Results and analysis
The 237 synthetic documents are used to construct a large and sparse term-document matrix. Because the popularities of the terms as well as their distributions vary across documents, the common weighting scheme tf-idf (term frequency–inverse document frequency) is applied here. SVD is performed upon the weighted scores to obtain the semantic dimensions. The identified semantic dimensions form a semantic space, onto which both the terms and the synthetic documents can be projected. In this study, we retain the first 48 dimensions. As an example, plots the terms and documents in the first four (and thus most prevailing) semantic dimensions. These four dimensions account for 10% of the entire raw information.
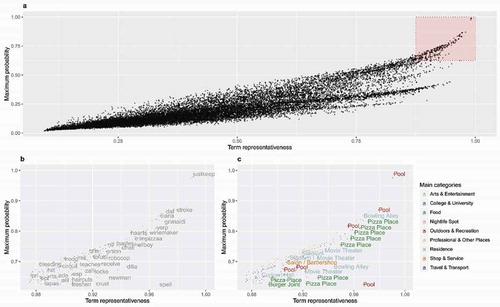
Figure 2. Terms (in gray) and synthetic documents (colored to main categories) in the four main semantic dimensions. (a) and (b) plot the second dimension against the first dimension, where (b) enlarges the highlighted part of (a). (c) and (d) plot the third and fourth dimensions against the 1st dimension respectively.
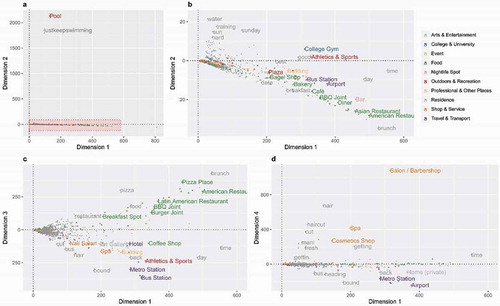
) plots the second dimension against the first dimension. In this figure, a distinctive term (justkeepswimming) and the associated semantic concept (Pool) stretch significantly beyond the scope of their peers in the second dimension. It implies that some terms might have better ability to represent semantic concepts (i.e., better representativeness), and some semantic concepts can be better represented by text messages (i.e., better representability). These hints correspond to RQ 2 and RQ 3, which will be further explored in Sections 4 and 5.
In addition, it is generally observed from that semantically associated terms and documents (i.e., semantic concepts) tend to appear concurrently. For example, a cluster of dining-related topics (with featured terms such as lunch and brunch, and featured concepts such as Restaurants) are noticeable in , ), and another cluster for transportation-related topics (with featured terms such as home, back and featured concepts such as Metro Station and Airport) are found in , ). The visual coincidence of the terms and semantic concepts provides a first indication toward a positive answer to RQ 1. In the next step, we examine whether the identified semantic dimensions are linked reasonably to the concepts suggested by the Foursquare venue type hierarchy. The reasonability of the identified semantic dimensions could confirm the reasonability of the LSA result, and thereby the validity of the previously outlined results.
All four plots of show the first semantic dimension on the x-axis. They demonstrate that all terms and semantic concepts are distributed at the positive side of the first dimension, and frequent terms tend to stretch toward the positive tail. The first dimension, hence, can be interpreted as a reflection of the dominance of terms and semantic concepts. ) zooms into the highlighted rectangle shown in Figure 2(a). It can be noticed that, in addition to swimming, other sports-related terms and concepts are distributed on the positive side of the second dimension, opposed to dining-related terms and documents on the other side. Hence, the second semantic dimension may be interpreted as the dimension of activeness, which varies from non-active dining-related topics to active sports-related topics. Similarly, dining-related and transportation-related topics are distributed on opposite sides of the third dimension according to ), while cosmetic-related and transportation-related topics are stretching along the fourth dimension in ). These latter two dimensions, thus, identify the mobility and leisure aspects of the terms and semantic concepts. In summary, most dimensions identified by LSA are related to some reasonable semantic explanations.
It can also be seen that many semantic concepts are distributed rather closely in semantic space. This indicates that text messages in respective check-in places are similar. In such cases, text messages may not be sufficient to provide semantic descriptions of check-in places as fine-grained as the Foursquare categorization does. In some cases, in contrast, text messages show better conformity to the true functionality of check-in places. For example, while College Gym is categorized into College & Universities by the Foursquare categorization, its actual semantic relation to sports-related topics such as Athletics & Sports is effectively captured by LSA (see )). Nevertheless, in general, we can conclude that text messages can represent semantic concepts that are compatible to the official categorization.
4. Representativeness of terms
outlines some terms (e.g. justkeepswimming) that extend extremely far along the identified semantic dimensions. These terms present strong semantic signals and may be strongly associated with (and thus highly representative for) certain semantic concepts. Simply put, when such terms occur in a text message, we can be rather confident in inferring the semantic concepts of check-in places with which these text messages are associated. The knowledge on each term’s representativeness (i.e., the ability to represent semantic concepts) can benefit the understanding of the entire dataset. Hence, in line with RQ 2, this section proposes an approach to quantify the representativeness of terms.
4.1 Quantification approach
Projecting the initial term-document matrix onto the semantic space produces a new matrix that considers both primitive occurrences and semantic relations. For instance, if two terms, ta and tb, are considered similar by LSA, and if ta occurs frequently in a document da, the new matrix would indicate a connection between tb and da, even if tb does not appear in da. Thus, the new matrix cells indicate strengths of latent (or: conceptual) semantic relations between terms and documents. depicts four terms with their most strongly related semantic concepts. They represent four general term types as listed in .
Table 1. General types of terms with respect to their interrelations across semantic concepts.
Figure 3. An example of four terms with their most associated semantic concepts (in log scales).
According to and , it is reasonable to consider terms of type I as highly representative. They are strongly correlated with only one semantic concept, which makes their interpretation rather intuitive. The terms of type IV, in contrast, are the least representative ones, as they are semantically vague. Terms of type II and III are more difficult, as these might lead to controversial interpretations. In this work, we consider terms of type II more representative than those of type III. One might concern that dinner (type III) is quite representative for some Restaurant in general, even although it is difficult to assert whether it is a Steakhouse or an Italian Restaurant. This is indeed true, considering that humans can intuitively aggregate restaurants of different types as Restaurant in general. However, this mental aggregation has essentially modified the Foursquare categorization hierarchy, which conflicts the premise of this study. Furthermore, such aggregation cannot be easily and automatically accomplished by machines, not to mention many other type III terms whose major concepts are not as intuitive as dinner. For instance, home is strongly related to both Home (private) and Airport, concepts of which cannot be easily aggregated.
The earlier discussion demonstrates that the key to a term’s representativeness lies in its distribution of semantic relatedness with respect to all semantic concepts. Specifically, an uneven distribution indicates less uncertainty of semantic concepts, and vice versa. Talking about uncertainty, Shannon entropy (Shannon Citation1948) is borrowed here. Shannon entropy (Hi) is a widely applied measure for uncertainty:
with
Indices i and j denote the row and column of the matrix, and xij is the entry of the corresponding cell. pij quantifies the probability of relating a given term to a semantic concept. Thus, Hi stands for the term’s entropy for representing semantic concepts. As Hi theoretically ranges within [0, +∞], it is not convenient for the interpretation of representativeness. Therefore, the representativeness score (Rti) is determined with a descending transformation of Hi:
Equation (4) represents an S-shaped transformation of Hi. It restricts the score to an interval between 0 and 1 without changing the relative relations determined by Hi. Parameter k corresponds to the entropy value of 0.5 (i.e., the inflection point of the S-curve), and parameter f controls the slope around the inflection point. The rationale behind the transformation can be found in Appendix 2 with graphic illustrations. In this study, k is adjusted to the mean entropy (4.97) and f is set to 1.
4.2 Results and verification
) plots each term’s representativeness, Rti, against the maximum probability that the respective term reaches within the data. Terms highlighted in the upper-right corner are those with high representatives and, therefore, clear interpretations. They are labeled in ), and their strongest related semantic concepts are labeled in Figure 4(c). All labels are printed in a non-overlap style to ensure readability.
Figure 4. The representativeness of all terms (a). The most representative terms are re-plotted in (b), and their most related semantic concepts are labeled in (c).
) shows that terms with larger maximum probability tend to have higher representativeness scores. This conforms to our prior expectations to assign a higher score to terms with an uneven distribution of potential semantic concepts. According to ), the most representative terms include, for example, justkeepswimming (0.991), bowlathon (0.972), pizzeria (0.971), cragel (0.967), snip (0.958), to name just a few. These terms are strongly related to Pool, Bowling Alley, Pizza Place, Bagel Shop, and Salon/Barbershop, respectively (see )). Note that the terms themselves seem rather uncommon to a human observer. It is the latent term structure across the documents unveiled by LSA that makes them distinctive features for their respective semantic concepts.
Points in the lower-left corner of ) represent the un-representable terms (without printed labels), such as just (0.095), people (0.097), like (0.098), really (0.099), time (0.100), lol (0.101), and love (0.101). These terms appear in a spatially ubiquitous manner and are not specific to any types of check-in places. Comparing the two term lists, we are convinced that terms with high representativeness scores Rti do contain rich locational characteristics and tend to take place at certain types of check-in places, while the ones with low scores are so common that they appear at virtually all places.
Furthermore, ) provides some visual hints to the representability of the semantic concepts. It appears that some semantic concepts such as Pool tend to draw many representative terms, which might aid its representation by text messages. The representability of semantic concepts is the third RQ of this work and will be investigated in detail in the next section.
5. Representability of semantic concepts
In this work, we assume that semantic concepts can impose unequal impacts on users’ verbalization behaviors. Consequently, some places might come with place-type-specific vocabularies, while others may share merely common terms. From the previous analysis, for example, we would have expected Pool to be a very representable semantic concept. An integrated assessment of their representability, i.e., how well they can be represented by text messages (RQ 3), requires a systematic analysis with respect to their overall composition of terms. This is the subject of the following subsections.
5.1 Quantification approach
The semantic concepts of check-in places are representable by text messages to different degrees. A highly representable semantic concept would be appealing to very unique terms, which makes it distinguishable from others. The question is then to quantify the uniqueness (or dissimilarities) of a semantic concept regarding its terms in use. In a semantic space, the similarity between two semantic concepts can be computed by taking the cosine of the angle between their respective vectors:
As the representability considers dissimilarity instead of similarity, our approach is based on the reciprocal of cosine similarity:
λj is the mean dissimilarity of a semantic concept dj. Its theoretical range in (1, +∞) makes the interpretation of representability inconvenient. Similar to Equation (4), an incremental transformation is thus applied to λj in order to quantify the representability (Rbj):
Parameter k in Equation (7) controls the curvature of the transformation, and is set to 5 in this study. The rationale behind the transformation can be found in Appendix 3, including graphical illustrations.
5.2 Result and verification
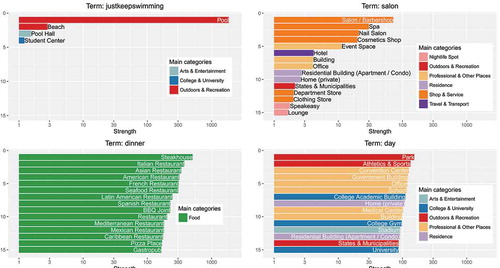
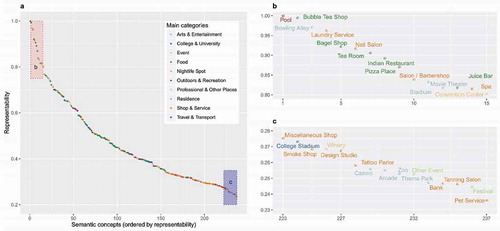
presents the representability of 237 types of semantic concepts in a descending order. It confirms that the most representable semantic concept is Pool (0.999), which is not surprising given the previously outlined results. Other representable semantic concepts include: Bubble Tea Shop (0.994), Bowling Alley (0.970), Laundry Service (0.963), and Bagel Shop (0.921). The un-representable semantic concepts are: Pet Service (0.235), Festival (0.242), Tanning Salon (0.244), Zoo (0.246), and Bank (0.247). The findings from are slightly different from the visual clues found in ). This is because ) is based on representability of individual terms, while takes account of the overall usage of all terms.
Figure 5. The quantified representability of semantic concepts (a). The most and least representable examples are plotted with labels in (b) and (c) respectively.
In order to verify this result, a prediction experiment is set up on the raw text messages (i.e., without document construction). The idea behind the prediction experiment is: supposing that the score can truly describe the representability, a semantic concept with higher representability score should correspond to a higher accuracy when we attempt to make predictions from associated text messages.
The prediction experiment is performed as follows. First, groups of text messages are randomly selected from the raw check-in dataset. The selection procedure selects at least 30 text messages for each semantic concept to ensure valid statistical outcomes. Afterward, each text message is projected into the same semantic space to obtain their vector representations. The cosine similarities between these vectors and each of the 237 other vectors are computed, which, by design, shall describe the semantic similarities of each of the messages to all known semantic concepts. The 237 candidates are then ranked by the similarity value, and N most similar ones are assigned to that text message as predictions. Finally, the predicted semantic concepts are compared with their true concept (the venue categories coming with their text messages), and a statistic of the prediction precision is constructed for each semantic concept.
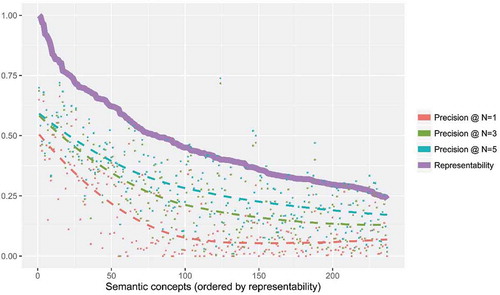
There are 49,994 text messages actually involved in the prediction experiment, and the statistical results are presented in with a reference to the quantified representability scores. demonstrates a high correlation between the precision of the predictions and the representability scores. Specifically, if a semantic concept is evaluated as representable by our approach, it tends to achieve high precision in prediction. In addition, when the number of assigned labels (N) increases, the estimated line of precision is moving closer toward the line of representability. Thus the quantified representability is functioning as a reference to which, in the most perfect case, the line of precision converges. Hence, we can conclude that the quantified representability score can reasonably describe how well a semantic concept can be represented by text messages, which, in essence, indicates the linguistic uniqueness of a semantic concept and its impact on human verbalization.
Figure 6. Verification of the quantified representability of semantic concepts by the predicting precision.
6. Conclusion and discussion
In this study, we first investigated the correspondence of the text messages and the Foursquare categories (RQ 1). LSA has been applied to the textual components of a large Foursquare check-in dataset. The results demonstrate that text messages can, in general, properly describe the semantic concepts about the check-in places as given by the official categorization hierarchy.
Furthermore, we found that some terms are strongly associated with (and representative for) certain semantic concepts. In this study, we proposed an entropy-based approach to quantify the representativeness of terms (RQ 2), and successfully identified representative terms such as justkeepswimming (Pool) and bowlathon (Bowling Alley), and un-representative terms such as just, really, time, and lol that may appear ubiquitously at any location.
Finally, under the assumption that some semantic concepts may have heavier impacts on users’ verbalizations and can thus be better represented by textual snippets due to linguistic uniqueness, we proposed an approach based on cosine similarity to quantify the representability of semantic concepts (RQ 3). The representability scores are verified with a prediction experiment, and results show that the prediction precision is highly correlated with the representability score assigned by our approach.
In general, our study presents comprehensive investigations on the possibility of obtaining semantic knowledge about geographic locations using text messages. The findings on the representativeness of terms and representability of semantic concepts can be further used to improve the LSA model or other text mining approaches by, e.g. tuning the weighting schema.
It should be pointed out that the way how we quantify the representativeness is scale-dependent. For example, it has been mentioned that the term dinner is representative for a generic restaurant, but not for a specific type of restaurant. It can be expected that when the semantic concepts are described at a coarser conceptual scale (e.g. without distinguishing the exact restaurant types), the same term would exhibit much higher representativeness.
With the Foursquare dataset, a LSA model has been constructed with reliable prior knowledge. Theoretically, this model can be used to detect latent semantic concepts of places from text messages of other sources such as Twitter tweets, and the feasibility has already been demonstrated with our prediction experiment. However, users may use different LBSN platforms for different reasons under different scenarios, and this may affect the performance of the identified model for cross-dataset usage. It would still be interesting to apply this model onto datasets from other platforms, because the results of such comparison might reveal some variations in platforms with respect to the usage patterns. In addition, the most representative terms or representable semantic concepts as determined here are very likely not that special in other datasets from different world regions. It would be interesting to observe this shift for both terms and semantic concepts across different data sources.
Additional information
Funding
Notes on contributors
Ming Li
Ming Li is an associated postdoctoral research fellow at the GIScience research group of Heidelberg University. She studied Geodesy and Geomatics at Wuhan University in China. After that, she conducted PhD research in the areas of mobile computing, context-aware geovisualization and the analysis of LBSNs at Heidelberg University.
Rene Westerholt
Rene Westerholt is a research fellow at the GIScience research group of Heidelberg University. He is conducting doctoral research in the areas of spatial analysis, geosocial media, and place-based analysis. Prior to his PhD, he studied Geoinformatics at the University of Osnabrück in northern Germany.
Alexander Zipf
Alexander Zipf is a professor and the chair of GIScience (Geoinformatics) at Heidelberg University (Department of Geography) since late 2009. He is a member of the Centre for Scientific Computing (IWR), the Heidelberg Center for Cultural Heritage and PI at the Heidelberg Graduate School MathComp. He is also a founding member of the Heidelberg Center for the Environment (HCE) and is currently establishing the “Heidelberg Institute for Geoinformation Technology” (HeiGIT), core funded by the Klaus Tschira Stiftung. From 2012 to 2014, he was the managing director of the Department of Geography, Heidelberg University. In 2011−2012, he acted as the vice dean of the Faculty for Chemistry and Geosciences, Heidelberg University. Since 2012, he is the speaker of the graduate school “Crowd Analyser − Spatio-temporal Analysis of User-generated Content.” He is also a member of the editorial board of several further journals and has organized a set of conferences and workshops. In 2012−2015, he was the regional editor of ISI journal “Transactions in GIS” (Wiley). Before coming to Heidelberg, he led the chair of Cartography at Bonn University and earlier was a professor for Applied Computer Science and Geoinformatics at the University of Applied Sciences in Mainz, Germany. He has a background in Mathematics and Geography from Heidelberg University and finished his PhD at the European Media Laboratory EML in Heidelberg where he was the first PhD student. There he also conducted further research as a postdoc for 3 years.
Notes
References
- Abbasi, A., T. H. Rashidi, M. Maghrebi., and S. T. Waller. 2015. “Utilising Location Based Social Media in Travel Survey Methods: Bringing Twitter Data into the Play.” In Proceedings of the 8th ACM SIGSPATIAL International Workshop on Location-Based Social Networks. Bellevue, WA, USA, November 03–06. doi:10.1145/2830657.2830660.
- Abidin, A. F., M. Kolberg, and A. Hussain. 2015. “Integrating Twitter Traffic Information with Kalman Filter Models for Public Transportation Vehicle Arrival Time Prediction.” In Big-Data Analytics and Cloud Computing: Theory, Algorithms and Applications, edited by M. Trovati, R. Hill, A. Anjum, S. Y. Zhu, and L. Liu, 67–82. Cham: Springer International Publishing. doi:10.1007/978-3-319-25313-8_5.
- Brandon Gaille. 2015. 26 Great Foursquare Demographics. Accessed September 1, 2015. http://brandongaille.com/26-great-foursquare-demographics/.
- Burton, H. S., W. K. Tanner, G. C. Giraud-Carrier, H. J. West, and D. M. Barnes. 2012. “‘Right Time, Right Place’ Health Communication on Twitter: Value and Accuracy of Location Information.” Journal of Medical Internet Research 14 (6): 86–96. doi:10.2196/jmir.2121.
- Chen, L., and A. Roy. 2009. “Event Detection from Flickr Data through Wavelet-Based Spatial Analysis.” In Proceedings of the 18th ACM Conference on Information and Knowledge Management, 523–532. Hong Kong, November 02–06. doi: 10.1145/1645953.1646021.
- Cho, E., S. A. Myers, and J. Leskovec. 2011. “Friendship and Mobility: User Movement in Location-Based Social Networks.” In Proceedings of the 17th ACM SIGKDD International Conference on Knowledge Discovery and Data Mining − KDD’11, 1082–1090). San Diego, California, USA, August 21–24. doi:10.1145/2020408.2020579.
- Cramer, H., M. Rost, and L. E. Holmquist. 2011. “Performing a Check-in: Emerging Practices, Norms and ‘Conflicts’ in Location-Sharing Using Foursquare.” In Proceedings of the 13th International Conference on Human Computer Interaction with Mobile Devices and Services − MobileHCI’11, 57–66. New York, USA: ACM Press. doi:10.1145/2037373.2037384.
- de Albuquerque, J. P., B. Herfort, A. Brenning, and A. Zipf. 2015. “A Geographic Approach for Combining Social Media and Authoritative Data towards Identifying Useful Information for Disaster Management.” International Journal of Geographical Information Science 29 (4): 667–689. doi:10.1080/13658816.2014.996567.
- Deerwester, S., S. T. Dumais, G. W. Furnas, T. K. Landauer, and R. Harshman. 1990. “Indexing by Latent Semantic Analysis.” Journal of the American Society for Information Science 41 (6): 17. doi:10.1002/(SICI)1097-4571(199009)41:6<391::AID-ASI1>3.0.CO;2-9.
- Gong, Y., and X. Liu. 2001. “Generic Text Summarization Using Relevance Measure and Latent Semantic Analysis.” Proceedings of the 24th Annual International ACM SIGIR Conference on Research and Development in Information Retrieval, 19–25. New Orleans, Louisiana, USA, September 9–13. doi:10.1145/383952.383955.
- Gupta, M., R. Li, and K.-C.-C. Chang. 2014. “Towards a Social Media Analytics Platform.” In Proceedings of the 23rd International Conference on World Wide Web − WWW’14 Companion, 193–194. Seoul, Korea, April 07–11. doi:10.1145/2567948.2577264.
- Hiruta, S., T. Yonezawa, M. Jurmu, and H. Tokuda. 2012. “Detection, Classification and Visualization of Place-Triggered Geotagged Tweets.” Proceedings of the 2012 ACM Conference on Ubiquitous Computing. Pittsburgh, Pennsylvania, September 05–08. doi:10.1145/2370216.2370427.
- Kim, H. G., S. Lee, and S. Kyeong. 2013. “Discovering Hot Topics Using Twitter Streaming Data Social Topic Detection and Geographic Clustering.” Proceedings of the 2013 IEEE/ACM International Conference on Advances in Social Networks Analysis and Mining (ASONAM 2013), 1215–1220. Niagara, Ontario, Canada, August 25–28 doi:10.1109/ASONAM.2013.6785858.
- Kongthon, A., C. Haruechaiyasak, J. Pailai, and S. Kongyoung. 2012. “The Role of Twitter during a Natural Disaster: Case Study of 2011 Thai Flood.” Technology Management for Emerging Technologies 23 (8): 2227–2232.
- Lee, K., A. Agrawal, and A. Choudhary. 2013. “Real-Time Disease Surveillance Using Twitter Data: Demonstration on Flu and Cancer.” Proceedings of the 19th ACM SIGKDD International Conference on Knowledge Discovery and Data Mining. Chicago, August 11–14. doi:10.1145/2487575.2487709.
- Li, M., G. Sagl, L. Mburu, and H. Fan. 2016. “A Contextualized and Personalized Model to Predict User Interest Using Location-Based Social Networks.” Computers, Environment and Urban Systems 58: 97–106. doi:10.1016/j.compenvurbsys.2016.03.006.
- Maas, A. L., R. E. Daly, P. T. Pham, D. Huang, A. Y. Ng, and C. Potts. 2011. “Learning Word Vectors for Sentiment Analysis.” Proceedings of the 49th Annual Meeting of the Association for Computational Linguistics: Human Language Technologies, 1. Portland, Oregon, June 19–24.
- Mocnik, F.-B., A. Zipf, and H. Fan. 2017. “The Inevitability of Calibration in VGI Quality Assessment.” Proceedings of the 4th Workshop on Volunteered Geographic Information: Integration, Analysis, and Applications (VGI-Analytics), AGILE 2017. Wageningen, May 09.
- Mocnik, F.-B., A. Zipf, and M. Raifer. 2017. “The OpenStreetMap Folksonomy and Its Evolution.” Geo-spatial Information Science 20 (3): 219–230. doi:10.1080/10095020.2017.1368193.
- Mostafa, M. M. 2013. “More than Words: Social Networks’ Text Mining for Consumer Brand Sentiments.” Expert Systems with Applications 40 (10): 4241–4251. doi:10.1016/j.eswa.2013.01.019.
- Noulas, A., C. Mascolo, and E. Frias-Martinez. 2013. “Exploiting Foursquare and Cellular Data to Infer User Activity in Urban Environments.” In Proceedings of the 14th International Conference on Mobile Data Management (IEEE) 1: 167–176. doi:10.1109/MDM.2013.27.
- Noulas, A., S. Scellato, N. Lathia, and C. Mascolo. 2012a. “A Random Walk around the City: New Venue Recommendation in Location-Based Social Networks.” In Proceedings of the 2012 International Conference on Privacy, Security, Risk and Trust and 2012 International Confernece on Social Computing, 144–153. Amsterdam, Netherlands: (IEEE). September 03–05. doi:10.1109/SocialCom-PASSAT.2012.70.
- Noulas, A., S. Scellato, N. Lathia, and C. Mascolo. 2012b. “Mining User Mobility Features for Next Place Prediction in Location-Based Services.” In Proceedings of the 2012 IEEE 12th International Conference on Data Mining, 1038–1043. Brussels, Belgium, December 10–13. doi:10.1109/ICDM.2012.113.
- Sebastiani, F. 2002. “Machine Learning in Automated Text Categorization.” ACM Computing Surveys 34 (1): 1–47. doi:10.1145/505282.505283.
- Sengstock, C., and M. Gertz. 2012. “Latent Geographic Feature Extraction from Social Media.” In Proceedings of the 20th International Conference on Advances in Geographic Information Systems, Redondo Beach, California, November 06–09. doi:10.1145/2424321.2424342
- Shannon, C. E. 1948. “A Mathematical Theory of Communication.” The Bell System Technical Journal 27 (3): 379–423. doi:10.1002/j.1538-7305.1948.tb01338.x.
- Steiger, E., R. Westerholt, B. Resch, and A. Zipf. 2015. “Twitter As an Indicator for Whereabouts of People? Correlating Twitter with UK Census Data.” Computers, Environment and Urban Systems 54: 255–265. doi:10.1016/j.compenvurbsys.2015.09.007.
- Tang, L., and H. Liu. 2010. “Community Detection and Mining in Social Media.” Synthesis Lectures on Data Mining and Knowledge Discovery 2 (1): 1–137. doi:10.2200/S00298ED1V01Y201009DMK003.
- Vasconcelos, M. A., S. Ricci, J. Almeida, F. Benevenuto, and V. Almeida. 2012. “Tips, Dones and Todos: Uncovering User Profiles in Foursquare.” In Proceedings of the Fifth ACM International Conference on Web Search and Data Mining, Seattle, Washington, USA, February 08–12. doi:10.1145/2124295.2124372.
- Wang, D., D. Pedreschi, C. Song, F. Giannotti, and A.-L. Barabasi. 2011. “Human Mobility, Social Ties, and Link Prediction.” In Proceedings of the 17th ACM SIGKDD International Conference on Knowledge Discovery and Data Mining − KDD’11, San Diego, California, USA, August 21–24. doi:10.1145/2020408.2020581.
- Wang, L., and Y. Wan. 2011. “Sentiment Classification of Documents Based on Latent Semantic Analysis.” In Advanced Research on Computer Education, Simulation and Modeling, Eds. S. Lin and X. Huang. Berlin, Heidelberg: Springer-Verlag. doi:10.1007/978-3-642-21802-6_57.
- Ye, M., P. Yin, and W.-C. Lee. 2010. “Location Recommendation for Location-Based Social Networks.” In Proceedings of the 18th SIGSPATIAL International Conference on Advances in Geographic Information Systems, San Jose, California, November 02–05. doi:10.1145/1869790.1869861.
Appendix 1.
Graphical demonstrations for Equation (1)
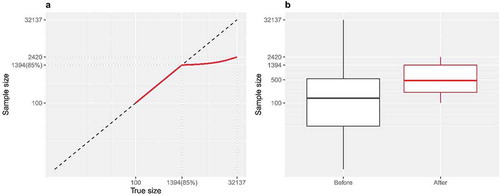
The red line in depicts the rule specified by Equation (1), while the gray dashed line along the diagonal acts as a reference of the true size (raw message counts). According to Equation (1), if the message counts of a semantic concept (venue category) is within the 85th quantile (i.e., m = 1394), all messages would be allotted to the respective synthetic document. For semantic concepts beyond this range (i.e., popular venue categories), their sample sizes are suppressed to avoid inflating the results. shows the variation of message counts before and after the application of Equation (1). The raw sample size has a large variation, and this has been modified by the rule. Thus, Equation (1) is conceptually similar to a stabilization of the variability among the message counts.
Figure A1. The rule specified by Equation (1) to decide sample sizes for each synthetic document (a) and the results after the application of the rule (b). Both subfigures are plotted in log scales.
Appendix 2.
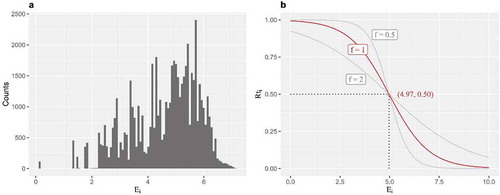
Graphical demonstrations for Equation (4)
In theory, the entropy determined by Equation (4) ranges from 0 to infinite. In practice, the distribution of the entropy value (Ei) for all terms in the investigated data is depicted in . The value is not convenient to interpret the terms’ representativeness (Rti). Therefore, a descending S-shaped transformation is applied on Ei to bound Rti by 0 and 1. The transformation is specified by Equation (4) and illustrated in . The inflection point is determined by the parameter k, which is set to the mean value of Ei. In addition, the parameter f decides the slope around the inflection point. shows exemplar lines with three different setups of f. In this study, f is set as 1 and the corresponding transformation line is printed in red.
Figure A2. Graphic demonstration of the transformation from entropy (Ei) to representativeness (Rti).
Appendix 3.
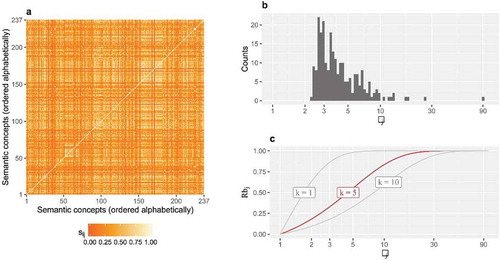
Graphical demonstrations for Equation (7)
depicts the cosine similarities (sij) among the 237 semantic concepts, and sij ranges from 0 to 1, i.e., sij ∈(0, 1). Hence, the reciprocal of sij ranges from 1 to infinite, i.e., 1/sij ∈(1, +∞), and its mean λj thus shares the same range. In practice, the distribution of the dissimilarity value (λj) for the 237 semantic concepts is depicted in . The value is not convenient to interpret the representability of semantic concepts (Rbj). Therefore, an ascending transformation function is applied on λj to bound Rbj by 0 and 1. The transformation is specified by Equation (7) and illustrated in . The parameter k decides the curvature of the transformation line. shows exemplar lines with three different setups of k. In this study, k is set as 5 and the corresponding transformation line is printed in red.
Figure A3. Graphic demonstration of the transformation from dissimilarity (λj) to representability (Rbj).