
 ?Mathematical formulae have been encoded as MathML and are displayed in this HTML version using MathJax in order to improve their display. Uncheck the box to turn MathJax off. This feature requires Javascript. Click on a formula to zoom.
ABSTRACT
This paper proposed and evaluated an estimation method for indoor positioning. The method combines location fingerprinting and dead reckoning differently from the conventional combinations. It uses compound location fingerprints, which are composed of radio fingerprints at multiple points of time, that is, at multiple positions, and displacements between them estimated by dead reckoning. To avoid errors accumulated from dead reckoning, the method uses short-range dead reckoning. The method was evaluated using 16 Bluetooth beacons installed in a student room with the dimensions of 11 × 5 m with furniture inside. The Received Signal Strength Indicator (RSSI) values of the beacons were collected at 30 measuring points, which were points at the intersections on a 1 × 1 m grid with no obstacles. A compound location fingerprint is composed of RSSI vectors at two points and a displacement vector between them. Random Forests (RF) was used to build regression models to estimate positions from location fingerprints. The root mean square error of position estimation was 0.87 m using 16 Bluetooth beacons. This error is lower than that received with a single-point baseline model, where a feature vector is composed of only RSSI values at one location. The results suggest that the proposed method is effective for indoor positioning.
1. Introduction
To localize a position in an indoor environment, wireless-based methods and dead reckoning methods are widely used (Liu et al. Citation2007; Pei et al. Citation2016; Kjærgaard Citation2007). Trilateration methods estimate the position on the basis of the signal strength from wireless beacons or transmitters (Liu et al. Citation2006). Triangulation methods take into account the angle of signals as well as the signal’s strength (Liu et al. Citation2010; Shan and Yum Citation2007). Both methods are affected by multipath propagation, especially in indoor environments. Errors in position estimation with both methods can be large in indoor environments, although very short pulses using ultra-wideband technology can reduce the errors. Complex multipath and non-line-of-sight propagation are still a problem indoors (Xiao et al. Citation2015).
Fingerprinting methods are also used for indoor position estimation (Kjærgaard Citation2007). They are based on a radio fingerprint, or a feature vector, which is composed of the strength of the signals from multiple transmitters. Multipath propagation attenuates or intensifies signal strength indoors in a complicated manner. Fingerprinting methods can utilize the local increase and decrease in signal strength as features, and their estimation errors are regarded as relatively small. However, these methods have been used mainly for area estimation or for finding a reference point.
Dead reckoning methods are used to estimate a relative position from a reference point (Jimenez et al. Citation2009). Dead reckoning estimates a relative offset, that is, a displacement vector, usually on the basis of the double integration of acceleration and accumulates position estimation errors. Therefore, the errors become larger as integration time progresses.
Combinations of fingerprinting and dead reckoning are often used to locate a reference point by fingerprinting and then to measure the displacement by dead reckoning (Chang et al. Citation2015; Seitz et al. Citation2010). They are useful but do not solve the accumulation of estimation errors caused by dead reckoning. Therefore, they generally need other mechanisms to compensate for the accumulation.
In this paper, we propose a method that combines fingerprinting and dead reckoning differently from the conventional methods of combination. The proposed method estimates a position on the basis of compound location fingerprints, which are combinations of radio signals, or fingerprints, at multiple points of time (or positions), and the displacements between them.
A short moving distance between near times (points) can suppress the accumulated estimation errors caused by dead reckoning. Using fingerprints at multiple times (points) can increase the size of the feature vectors without increasing the number of transmitters. We believe that dead reckoning and fingerprinting can complement each other in this combination and thus improve the estimation accuracy.
2. Proposed method
Fingerprinting in the proposed method is based on a combination of fingerprints of radio wave strength at multiple times and the displacement vectors between them.
The proposed method can be divided into three steps: (1) collecting data, (2) building a regression model, and (3) estimating a position. Steps (1) and (2) are preparations for step (3). The first two steps are also called the “offline training phase,” and step (3) is also called the “online position determination phase.”
Assume that beacons are installed in a target area where L is the total number of beacons.
2.1. Step for collecting data
The data collection step is the same as the measurement in conventional fingerprinting methods. A data collector measures the Received Signal Strength Indicators (RSSIs) from all beacons at all points in a measurement point set , where
are known and true coordinates and
is the number of measurement points. In this paper, we focus on a simple coordinate system, that is, a two-dimensional plane, although the proposed method can easily be applied to a three-dimensional space.
Let (
) denote an RSSI vector, that is, a conventional fingerprint, on the k-th measurement at coordinates
, where measurement is repeated K times at each location.
An RSSI vector set at
is expressed as
and the total set R(C) of RSSI vectors at the points in a measurement point set C is also represented as follows:
2.2 Step for building regression model
In the step for building a regression model, a non-linear regression model is built whose explanatory variable and objective variable are respectively a compound location fingerprint vector and a position.
A compound location fingerprint is composed of an RSSI vector
, an RSSI vector
, and a displacement
between coordinate
and coordinate
.
A compound fingerprint and a compound fingerprint set
are respectively expressed by
and
where concatenates vectors
,
, and
into one vector.
A compound fingerprint set , which is made of RSSI vectors and displacements at points in a measurement point set
, is represented as follows:
A regression model M built with a data set G is represented by
The model inputs a compound location fingerprint and outputs an estimated position
. This is expressed as follows:
2.3 Step for estimating position
In this step, a position is estimated on the basis of the built regression model with a measured compound location fingerprint. A user measures RSSIs at times and
. A displacement vector between time
and
is also estimated with dead reckoning. describes the relationship between the compound location fingerprints and their elements.
Figure 1. Compound location fingerprint in estimation.
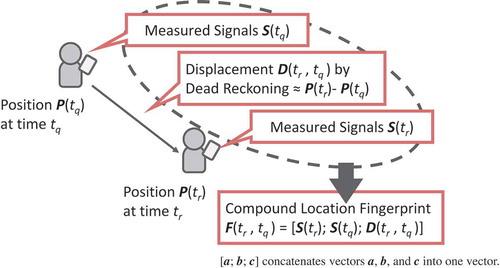
Let be an RSSI from beacon
and
be a signal strength vector at time
.
A displacement vector from time
to time
is estimated with dead reckoning. If
is small,
, where
is a position vector, that is, coordinates at time
, although
and
are unknown. The goal of the proposed method is to estimate
precisely.
Compound location fingerprint is composed of
and
, which is expressed as follows:
A compound location fingerprint is used to estimate a position at time
, that is
, on the basis of the model built in the step for building a regression model. In other words,
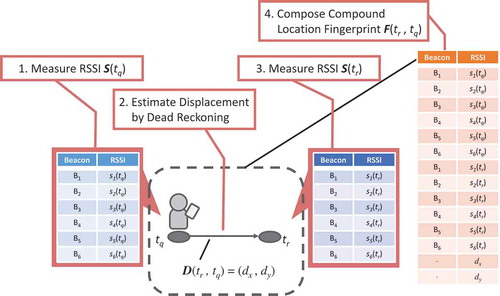
. illustrates an example of a compound location fingerprint.
Figure 2. Composition of compound location fingerprint.
3. Experiment
An experiment was conducted to evaluate the proposed method. We measured the RSSIs from beacons at multiple points and prepared the training data and validation data. We then built a regression model on the basis of the training data and estimated the position on the basis of the regression model with the validation data.
The goal of the experiment was to compare the proposed method with a baseline method that uses a regression model based on simple fingerprints at one measurement, that is, .
3.1. Experimental environment and devices
The proposed method was evaluated in a student room with the dimensions of 11 × 5 m and with many pieces of furniture and windows. The room was located in a reinforced concrete building. The origin of the coordinate system was set to one corner of the room. The shorter and the longer sides of the floor of the room were, respectively, the X and Y axis shown in .
Figure 3. Layout of target room.
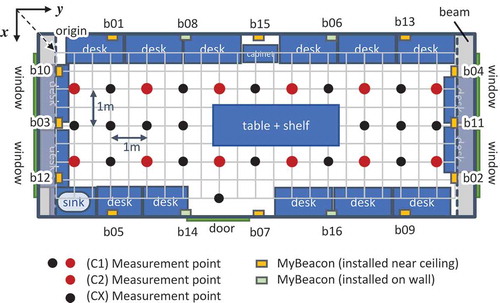
Sixteen Bluetooth beacons were placed in the room, as shown in . The beacons were installed on the ceiling and on the walls. We attached 12 beacons to the ceiling and the remaining 4 on the walls between the ceiling and the floor. We used 16 MyBeacons whose specifications are shown in .
Table 1. Specifications of MyBeacon.
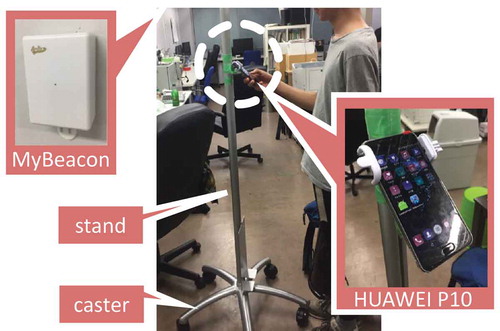
Measurement was performed with a Huawei P10 with the operating system Android 7.0. The specifications of the device are shown in . The device was mounted at a height of 1.35 m on a stand with casters so that it would be easy to change the location of the device. shows the measurement tool. We developed a measurement application program to measure Bluetooth RSSIs.
Table 2. Specifications of HUAWEI P10.
Figure 4. Measurement tool.
3.2. Experimental procedure
In the step for collecting data, we measured the RSSI values of the Bluetooth beacons 10 times at 30 measuring points, which were points of intersections on a 1 × 1 m grid with no obstacles, as shown in . The measuring point set is referred to as . The total number of valid pieces of data in the collected data set
was 300. We divided
into two parts, training data set
and validation data set
, before composing the compound location fingerprints to avoid the compound fingerprints to contain the same fingerprint elements, which could affect the results. The compound fingerprints for training
were composed of fingerprint elements in
and those for validation
were composed of fingerprint elements in
.
In the step for building a regression model, Random Forests (RF) (Breiman Citation2001; Breiman et al. Citation2001) was used to build regression models as it was effective for position estimation in previous experiments (Takayama et al. Citation2018). In particular, the proposed method with the RF outperformed the baseline method with the RF and the Support Vector Regression (SVR) method (Cortes and Vapnik Citation1995). We built the regression models using various numbers of beacons. Beacon bNN in represents a beacon with the identifier number NN. Beacons from b01 to bMM are used where the number of beacons is MM. For example, when the number of beacons is 3, three beacons b01, b02, and b03 are used.
In the step for estimating a position, calculated displacements were used on the basis of the collected data in the evaluation in this paper. These displacements were used to compose compound location fingerprints in the validation data set.
3.3. Evaluation criterion
We evaluated two methods with respect to the estimation distance error and accuracy.
A Root Mean Squared Error (RMSE) is used for estimation distance error. The RMSE is a standard deviation of prediction errors, or the residuals.
Let ,
,
, and
be, respectively, a true position, an estimated position, a distance between
and
, and a permissible tolerance of error distance. If
,
is a correct estimate. The accuracy of estimation is the ratio of the number of correct estimates to the number of total estimates.
4. Results
4.1. Basic evaluation
We first evaluated the proposed method on the basis of regression models by 10-fold cross-validation, referred to as Model C1 , built with a training data set
that consists of compound location fingerprint vectors composed of 90% of a data set
on the 1 × 1 m grid. The remaining 10% of the
were used to create the validation data set
, where the total number of compound location fingerprints in each fold is 900 (= 30 × 30) in
and 72,900 (= 270 × 270) in
. In comparison, conventional fingerprints of baseline method are 30 in
and 270 in
in each fold.
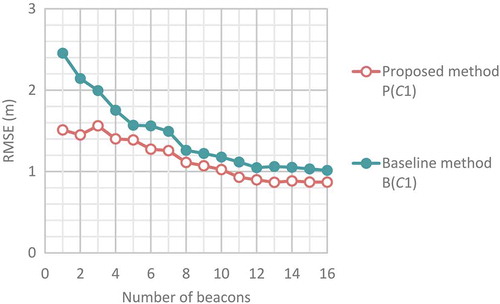
shows the RMSEs at the intersections () of the 1 × 1 m grid: the baseline method, referred to as
, the proposed method, referred to as
. The RMSE of the position estimation in the proposed method with the RF using 16 beacons was 0.87 m. The RMSE of the position estimation of the baseline method using 16 beacons was 1.01 m. The RMSE in the proposed method is smaller than that in the baseline model.
Figure 5. RMSE using model with C1.
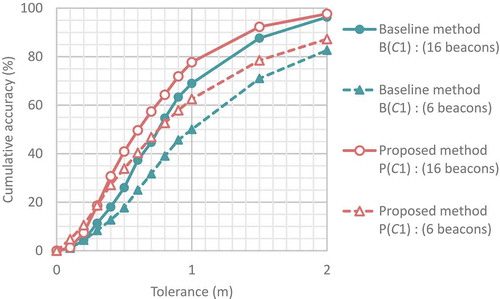
shows the cumulative accuracy of the two methods and
with different numbers of beacons. shows that at a tolerance distance of 0.5 m using 16 beacons, the cumulative accuracy of the proposed method was 40.9%, which was better than that of the baseline method by 14.9 percentage points (pp). Similarly, the cumulative accuracy of the proposed method using six beacons was 33.8%, which was better than that of the baseline method by 16.2 pp.
Figure 6. Cumulative accuracy using model with C1.
The results of the basic evaluation show that the proposed method using compound location fingerprints improved the RMSE and the accuracy compared to the baseline method using the RSSI vectors at one point.
4.2. Accuracy at unknown points
We also evaluated estimation accuracy at unknown points in the proposed method on the basis of regression models by 10-fold cross-validation. We built regression models based on a data set collected at the intersections on a 2 × 2 m grid (10 times at 12 measurement points). The intersection points are referred to as , as shown in . We then validated an in-between data set whose locations are at the intersections of the 1 × 1 m grid but not at the intersections of the 2 × 2 m one. The location points are referred to as
. In other words,
. The in-between points can be considered to be unknown locations whose data are not used in model building. Training data set
was a data set composed of 90% of
(10 times at 12 measurement points), that is,
is 11,664 (= 108 × 108). The regression models are referred to as Model
. The validation data set included
and in-between data set
. The number of compound location fingerprints in
was 32,400 (= 180 × 180). Each fold in 10–fold cross validation has a validation set whose size is 468, that is, 144 (= 12 × 12) in
and 324 (= 18 × 18) in
. In comparison, each hold in baseline method has a training set whose size is 108 in
and a validation set whose size is 12 in
and 18 in
.
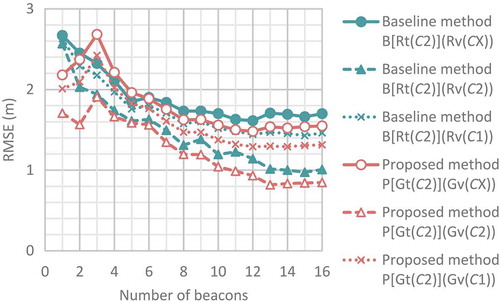
The RMSEs for Model are shown in . The RMSE of the position estimation of the proposed method with the RF using 16 beacons was 1.55 m. This error is smaller than that in the baseline model. The RMSE of the position estimation of the baseline method using 16 beacons was 1.70 m.
Figure 7. RMSE using model with C2.
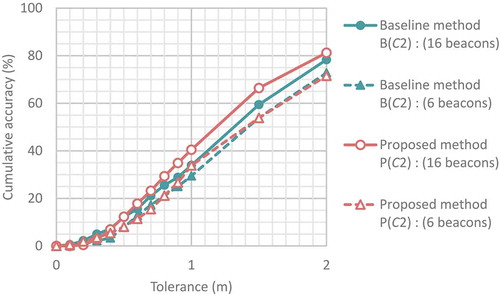
shows the cumulative accuracy for Model . Let
be the cumulative accuracy for the model built with training data set
, validation data set
, the number of beacons
and w is a tolerance distance
in meters. At a tolerance distance of 0.8 m using 16 beacons,
was 29.3%, which was better than that of the baseline method by 3.8 pp. Similarly, at a tolerance distance of 1.0 m using six beacons,
was 33.8%, which was better than that of the baseline method by 4.4 pp.
Figure 8. Cumulative accuracy using model with C2.
The evaluation of the RMSE at the unknown points showed that the RMSE at in-between points of the proposed method with the RF was better than that of the baseline method using models built on more data. This suggests that the proposed method with the RF is effective for precisely estimating a position.
5. Conclusions
We proposed a method for estimating position that is based on non-linear regression models with a unique combination of fingerprinting and dead reckoning. The evaluation results showed that the proposed method was better than the baseline method based on a single fingerprint, suggesting that it can be effective in indoor environments.
Additional information
Notes on contributors
Tomofumi Takayama
Tomofumi Takayama received his B.E., and M.E. degrees from Chiba University, Japan, in 2016, and 2018, respectively. He is now with Hewlett-Packard Japan, Ltd.
Takeshi Umezawa
Takeshi Umezawa received his B.E., M.E., and PhD degrees in Computer Science from Keio University, Yokohama, Japan in 1999, 2001, and 2007, respectively. He joined National Institute of Information and Communications Technology (NICT), Japan, in 2006. He is now with Chiba University as an Assistant Professor.
Nobuyoshi Komuro
Nobuyoshi Komuro received the B.E., M.E., and PhD degrees in Information Science from Ibaraki University, Japan, in 2000, 2002, and 2005, respectively. He is now with Chiba University as an Associate Professor with the Institute of Management and Information Technologies. He was with Rutgers University as a visiting scholar from May 2012 to Apr. 2013.
Noritaka Osawa
Noritaka Osawa received his B.S., M.S., and PhD degrees in information science from the University of Tokyo in 1983, 1985, and 1988, respectively. After working for a software company, the University of Electro-communications, and the National Institute of Multimedia Education, he is now with Chiba University as a professor.
References
- Breiman, L. 2001. “Random Forests.” Machine Learning 45 (1): 5–32. doi:10.1023/A:1010933404324.
- Breiman, L., A. Cutler, A. Liaw, and M. Wiener 2001. “Breiman and Cutler’s Random Forests for Classification and Regression.” Accessed 22 March 2018. https://cran.r-project.org/web/packages/randomForest/randomForest.pdf
- Chang, Q., S. Van de Velde, W. Wang, Q. Li, H. Hou, and S. Heidi 2015. “Wi-Fi Fingerprint Positioning Updated by Pedestrian Dead Reckoning for Mobile Phone Indoor Localization.” China Satellite Navigation Conference (CSNC), Xian, China, May 13-15. doi: 10.1007/978-3-662-46632-2_63.
- Cortes, C., and V. Vapnik. 1995. “Support-Vector Networks.” Machine Learning 20 (3): 273–297. doi:10.1007/BF00994018.
- Jimenez, A. R., F. Seco, C. Prieto, and J. Guevara 2009. “A Comparison of Pedestrian Dead-Reckoning Algorithms Using A Low-Cost MEMS IMU.” IEEE International Symposium on Intelligent Signal Processing, Budapest, Hungary, August 26-28. doi: 10.1109/WISP.2009.5286542.
- Kjærgaard, M. B. 2007. “A Taxonomy for Radio Location Fingerprinting.” International Symposium on Location- and Context-Awareness,Oberpfaffenhofen, Germany, September 20–21. doi: 10.1007/978-3-540-75160-1_9.
- Liu, H., H. Darabi, P. Banerjee, and J. Liu. 2007. “Survey of Wireless Indoor Positioning Techniques and Systems.” IEEE Transactions on Systems, Man, and Cybernetics, Part C: Applications and Reviews 37 (6): 1067–1080. doi:10.1109/TSMCC.2007.905750.
- Liu, J., Q. Cui, X. Tao, and P. Zhang 2006. “A Method to Enhance the Accuracy of Location Systems Based on TOA-Location Algorithms.” 6th International Conference on ITS Telecommunications, Chengdu, China, June 21–23. doi: 10.1109/ITST.2006.288717.
- Liu, Y., Z. Yang, X. Wang, and L. Jian. 2010. “Location, Localization, and Localizability.” Journal of Computer Science and Technology 25 (2): 274–297. doi:10.1007/s11390-010-9324-2.
- Pei, L., Z. Min, D. Zou, R. Chen, and Y. Chen. 2016. “A Survey of Crowd Sensing Opportunistic Signals for Indoor Localization.” Mobile Information Systems 2016 (3): 1–16. doi:10.1155/2016/4041291.
- Seitz, J., J. Jahn, J. G. Boronat, T. Vaupel, S. Meyer, and J. Thielecke 2010. “A Hidden Markov Model for Urban Navigation Based on Fingerprinting and Pedestrian Dead Reckoning.” 13th Conference on Information Fusion (FUSION),Edinburgh, July 26–29. doi: 10.1109/ICIF.2010.5712025.
- Shan, Z., and T. P. Yum 2007. “Precise Localization with Smart Antennas in Ad-Hoc Networks,” Global Telecommunications Conference (GLOBECOM), Washington, November 26–30. doi: 10.1109/GLOCOM.2007.203.
- Takayama, T., T. Umezawa, N. Komuro, and N. Osawa 2018. “An Indoor Positioning Method Based on Regression Models with Compound Location Fingerprints“, 2018 Ubiquitous Positioning, Indoor Navigation and Location-Based Services (UPINLBS), Wuhan,Chin, March 22–23. doi: 10.1109/UPINLBS.2018.8559728.
- Xiao, Z., H. Wen, A. Markham, N. Trigoni, P. Blunsom, and J. Frolik. 2015. “Non-Line-of-Sight Identification and Mitigation Using Received Signal Strength.” IEEE Transactions on Wireless Communications 14 (3): 1689–1702. doi:10.1109/TWC.2014.2372341.