
 ?Mathematical formulae have been encoded as MathML and are displayed in this HTML version using MathJax in order to improve their display. Uncheck the box to turn MathJax off. This feature requires Javascript. Click on a formula to zoom.
ABSTRACT
The localization of persons or objects usually refers to a position determined in a spatial reference system. Outdoors, this is usually accomplished with Global Navigation Satellite Systems (GNSS). However, the automatic positioning of people in GNSS-free environments, especially inside of buildings (indoors) poses a huge challenge. Indoors, satellite signals are attenuated, shielded or reflected by building components (e.g. walls or ceilings). For selected applications, the automatic indoor positioning is possible based on different technologies (e.g. WiFi, RFID, or UWB). However, a standard solution is still not available. Many indoor positioning systems are only suitable for specific applications or are deployed under certain conditions, e.g. additional infrastructures or sensor technologies. Smartphones, as popular cost-effective multi-sensor systems, is a promising indoor localization platform for the mass-market and is increasingly coming into focus. Today’s devices are equipped with a variety of sensors that can be used for indoor positioning. In this contribution, an approach to smartphone-based pedestrian indoor localization is presented. The novelty of this approach refers to a holistic, real-time pedestrian localization inside of buildings based on multi-sensor smartphones and easy-to-install local positioning systems. For this purpose, the barometric altitude is estimated in order to derive the floor on which the user is located. The 2D position is determined subsequently using the principle of pedestrian dead reckoning based on user's movements extracted from the smartphone sensors. In order to minimize the strong error accumulation in the localization caused by various sensor errors, additional information is integrated into the position estimation. The building model is used to identify permissible (e.g. rooms, passageways) and impermissible (e.g. walls) building areas for the pedestrian. Several technologies contributing to higher precision and robustness are also included. For the fusion of different linear and non-linear data, an advanced algorithm based on the Sequential Monte Carlo method is presented.
1. Introduction
The applications of indoor localization are manifold and range from the user guidance trough a building (visitor guidance or disaster management) up to the intelligent management of the building technology (inspection and maintenance) or the automatic positioning of unmanned vehicles (e.g. robots). The key factor in implementing a Location-based Service (LBS) is a sufficiently accurate real-time location of the user. Outdoors, the positioning is usually performed using Global Navigation Satellite Systems (GNSS) in a global reference frame. In the interior of buildings, however, even with special receivers (High Sensitivity GNSS, HSGNSS) an ongoing and reliable position determination is currently not possible because the satellite signals are reflected or attenuated by building components (e.g. walls or ceilings) (Schwieger Citation2008; Zhang et al. Citation2010). To fill this gap, countless approaches based on various technologies have been explored in recent years, including infrared, ultrasound or radio frequencies. In most cases, the location is estimated using signals based on wireless communication systems between the reference station and the mobile station. However, the approaches are limited in accuracy, economy and complexity for individual applications and coverage areas. A universal standard solution such as GNSS for outdoors does not exist for buildings. Among other things, the reason for this lies in the installation and maintenance of additionally required infrastructure. This can lead to considerable time, cost and manpower requirements in large buildings. In addition, signals are subject to various propagation effects (multipath, attenuation, etc.) inside of buildings that lead to erroneous results. An alternative approach, independent from external infrastructures, is the inertial navigation. Using widespread low-cost multi-sensor devices such as smartphones, the relative movement of the user can be detected in order to determine the location of a person in a building. Thus, smartphones seem to be a promising platform for mass-market indoor localization applications.
Table 1. Dividing the Bluetooth signal into categories.
Figure 2. Low variance resampling method (Thrun, Burgard, and Fox Citation2005).
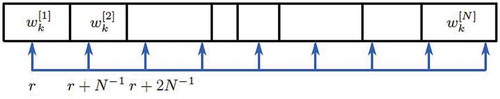
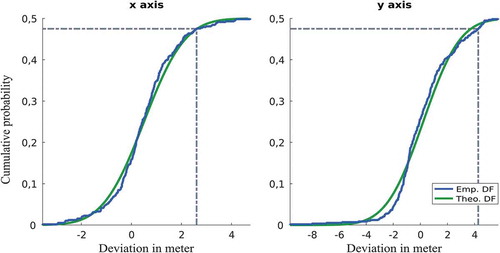
Figure 14. Cumulative distribution function (CDF) of the position deviations for the X and Y-axis on the 4th floor.
In this paper, a real-time indoor positioning system based on smartphone sensors is presented which, in its initial set up, is independent from any additional infrastructure (see ). Analogous to conventional inertial navigation, we use the smartphone-embedded sensors to detect the users’ movement activities (direction of movement and travelled distance) in order to determine the location of the smartphone user (see Chapter 3). The high drift and error susceptibility of the low-cost sensors, however, leads to a high uncertainty in the position estimation after a short time. By integrating a digital building model, which contains a lot of useful information, e.g. the structure of the building and therefore non-accessible areas, the position estimation can be improved. A sequential Monte Carlo method in the form of a particle filter is used for the fusion of motion data and other environmental information to estimate the position in a building (Chapter 4). The estimation with the particle filter is done floor by floor. Each height change or floor change is detected by the built-in air pressure sensor. The sensor data processing and the estimation of the position are completely computed on the smartphone and the result, the current position, is displayed in real time.
Figure 1. Concept for smartphone-based real-time indoor positioning for pedestrians.
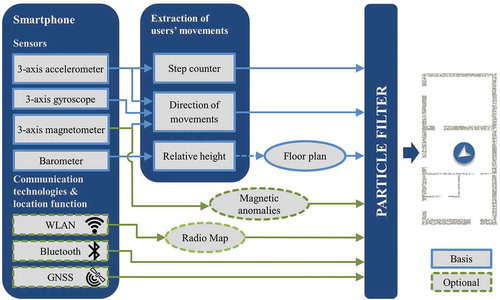
The particle filter allows the combination of different sensory and non-sensory data and leads to innovative strategies for indoor localization. Thus, it is possible to improve the position estimation by the inclusion of existing local indoor positioning systems. Here, the focus lies on the combination of the observation of magnetic anomalies or the measurements delivered by BLE Beacons and WLAN access points (Chapter 5) within the particle filter method. Finally, the results of our experimental real-time evaluations are presented in Chapter 7.
2. State of the art
Due to the progressive development in the field of communication and information technology, there are currently several options for localization and navigation inside of buildings. The indoor positioning systems are based on various signal technologies, for example Radio-frequency Identification (RFID), radio-based Wireless Local Area Networks (WLAN), Ultra-Wideband (UWB), Infrared (IR), ultrasound or images (vision-based systems). An overview of different systems is given amongst others in Blankenbach (Citation2017) or Sakpere, Adeyeye-Oshin, and Mlitwa (Citation2017). For example, RFID is used for the position determination of objects or pedestrians (Ni et al. Citation2003; Hightower, Want, and Borriello Citation2000; Xu et al. Citation2017). In contrast, Bahl and Padmanabhan (Citation2000), as well as Li et al. (Citation2006), present an indoor positioning system based on WLAN. Further systems can be found in Blankenbach (Citation2010), Michalson, Navalekar, and Parikh (Citation2009) or Zwirello et al. (Citation2012) using UWB, infrared (Want et al. Citation1992), or ultrasound (Priyantha, Chakraborty, and Balakrishnan Citation2000). Despite intensive research on Real-Time Location Systems (RTLS) for indoor areas, no technology or method has been established as a standard. Many indoor positioning systems usually are only suitable for concrete applications and can only be used under certain conditions (e.g. additional infrastructures, sensors or calibration tasks) or reach their limits, for instance due to multipath propagation or signal shading. Due to the progressive digitization of everyday life, almost all public and private buildings are equipped with dense, high-performance WLAN networks, therefore no additional infrastructure is required, however WLAN-based positioning typically only provides an accuracy of a few meters (Khalajmehrabadi, Gatsis, and Akopian Citation2017; Mautz Citation2012; Liu et al. Citation2007). Furthermore, the widespread fingerprinting approach requires a pre-mapping of the WLAN signal strength for the application environment and continuously updating it for localization. In addition to the wireless communication systems, inertial sensors are increasingly used to detect relative movements. These Inertial Measurement Units (IMU), a combination of accelerometer, gyroscope and sometimes magnetometer, are optimal for detecting the user’s step length and movement direction and, therefore, ideal for pedestrian tracking. According to the principle of dead reckoning the location of the smartphone user, can be estimated successively, starting from a known position (Harle Citation2013; Correa et al. Citation2017). The greatest drawbacks of inertial sensors are drift and error susceptibilities which lead to a considerable position error after a short period of time. Foxlin (Citation2005) or Godha and Lachapelle (Citation2008) developed a system for pedestrian tracking with foot-mounted inertial sensors. They use the Zero Velocity Updates (ZUPT) approach to reduce the accumulated errors. The ZUPT method exploits the stance phase of the foot – at this time the sensor is stationary with a velocity of zero – to detect and compensate the velocity error. There are also research projects and development activities in the field of hip-mounted or head-mounted inertial sensors for pedestrian navigation (e.g. Gädeke et al. Citation2011; Windau and Itti Citation2016).
To improve the robustness, accuracy and availability of indoor positioning, modern systems combine different technologies (hybrid systems) (Liu et al. Citation2012; Correa et al. Citation2017). For instance, a combination of relative motion detection from inertial sensor measurements with absolute reference points is performed to compensate the errors and to improve the performance of inertial navigation systems. For example, in addition to WLAN fingerprinting and inertial sensor measurements, the project Lobster (Hafner et al. Citation2013) also uses GNSS to locate first responders. Other real-time pedestrian indoor navigation systems include combinations of the dead reckoning principle and map matching algorithms (Jiang, Le, and Shie Citation2016), foot-mounted IMU and RFID measurements (Jiménez Ruiz et al. Citation2012), or visual markers and IMU for improved AR-based indoor navigation (Neges et al. Citation2015). Willemsen, Keller, and Sternberg (Citation2015) and Ebner et al. (Citation2015) use a graph-based approach for the indoor location with very small low-cost Micro-Electro-Mechanical Systems (MEMS). However, a practical solution for indoor positioning should be a system based on widespread already existing sensors or the infrastructure should easily be installable. The use of smartphones eliminates the need for additional wearable sensors, which foster the acceptance of indoor localization on the market.
3. Smartphone sensors
Modern smartphones are powerful mobile devices. They are small, portable computers with great computing power, enabling various functions and applications. These mobile devices provide a variety of possibilities for communication, information and entertainment. The significantly increased range of functions compared to previous mobile phones also results from the various low-cost sensors already built into today’s smartphones. A three axis accelerometer, a three axis magnetic field sensor, a three axis gyroscope, and a barometer are standard features of modern smartphones (Android Citation2018). By using these built-in sensors, the user’s movement activities can be extracted directly from the sensor data. The magnetic field sensor (magnetometer), for example, indicates the orientation of the device in the global system with respect to Magnetic North and is mostly used as a compass. The accelerometer detects the current state of the device in relation to the Earth’s gravitational field and can be used to detect translational movements (e.g. vibrations, rotations or inclinations of the smartphone). The embedded gyroscope provides data on rotational movements of the smartphone and the barometer can finally be used to register a change in height for a storey change.
In this work, all sensors are fused to estimate the movements of the smartphone user. The obtained motion information serves as input to the position estimation filter. See the next sections for more information about extracting motion activity from smartphone sensors.
3.1. Determination of the travelled distance
There exist different solutions to determine the movements of the user, especially the travelled distance, from MEMS sensors. One approach is to calculate the distance covered by integrating the acceleration values twice over time. The problem of this approach is that useful motion information cannot be isolated from noise and bias (sensor noise, offset drift or changes of inclinations caused by the device). These interferences have a major impact on the distance determination and the resulting error grows with every further measurement (Aggarwal et al. Citation2010). Another approach, specifically for pedestrians, follows the detection of steps in the acceleration signal (Gupta, Box, and Wilson Citation2014; Real Ehrlich and Blankenbach Citation2018). If the number of steps is known, the distance can be calculated by multiplying them with the step size. The automatic step detection is influenced by the user’s physical characteristics (e.g. gait, or body height), the mode of locomotion (walking, running, climbing stairs, traveling upwards with an elevator, etc), or different wearing situations of the smartphone (e.g. hand, handbag, or trouser pocket). If the sensor characteristics change after calibration, the determination of steps and step sizes may be incorrect and leads to a false distance estimate. Furthermore, it is difficult to model complex movements of humans. Alternatively, knowledge-based or machine learning methods may be used to estimate the travelled distance, for example by neural networks approaches (Toth, Grejner-Brzezinska, and Moafipoor Citation2007).
3.2. Determination of the moving direction
The accelerometer captures the gravity vector for all three axes (x, y and z). In combination with the magnetometer, the absolute orientation with reference to magnetic north can be determined. However, this computation is only valid in a stationary state in which the acceleration signal is affected exclusively by gravity. Another challenge is that the observations are influenced by drift and perturbations. Especially the magnetometer is affected by stationary and transient magnetic interferences of the surrounding area fields, such as elevators, radiators, or concrete reinforcements (Ayub, Bahraminisaab, and Honary Citation2012). The gyroscope records the angular velocity (also called rotational speed) which describes the change in the rotation angle (pitch, roll and yaw) over time, and can be used for the determination of the movement direction. The angular change results from the integration over time. The relative orientation can be calculated by summing up all angular changes and multiplying them by the time difference between the last and the current measurement (Evennou and Marx Citation2006; Lawitzki Citation2012). If the initial heading is known, the absolute orientation can also be determined. The advantage is that the relative orientation can be detected also during movement. But similar to the acceleration sensor, the gyroscope signal is distorted by disturbances, which in turn falsify the quality of the orientation.
To reduce the influence of errors, all three sensors (accelerometer, magnetometer, and gyroscope) are fused (sensor fusion). The absolute orientation is initially determined using the accelerometer and magnetometer (= initial heading). The orientation is updated with the angular changes observed by the gyroscope. For longer measurement periods, the direction is corrected by the absolute orientation from the accelerometer and magnetometer at predetermined time intervals which minimizes the gyroscope drift (Lawitzki Citation2012). Finally a transformation of the smartphone coordinate system into the world coordinate system has to be realized for which quaternions can be used (Ayub, Bahraminisaab, and Honary Citation2012; Lawitzki Citation2012; Real Ehrlich and Blankenbach Citation2018).
3.3. Determination of the height
Based on the air pressure it is possible to make an assumption of the mobile device’s height and, as a result of this, of the current floor in a multi-story building (Real Ehrlich, Blankenbach, and Sieprath Citation2016). The influence of height and temperature on the pressure in a standard atmosphere can be approximately described by the barometric formula (NASA Citation1976):
The formula contains the air pressure on reference height p(h0), the average molar mass M of atmospheric gases, the gravitational acceleration (g = 9.8062 m/s2), the universal gas constant R, the average temperature T in Kelvin, and the height h of the air column.
In order to consider the various influences on the atmospheric pressure measurements, for our approach a weather station is placed inside the building which is used as a reference for calibration tasks for the height calculation. In particular, the air pressure variations have approximately the same magnitude compared to the near surrounding, so that atmospheric corrections will not be needed. Under these circumstances, it is possible to achieve an accuracy of 1 to 2 m, which is sufficient for the floor determination (Real Ehrlich, Blankenbach, and Sieprath Citation2016).
4. Recursive Bayesian estimation
After the height and floor determination, the 2D position estimation can be started on the respective floor. If the starting position is known, the location of the user can be estimated based on the movement activities detected from the sensor data according to the principle of dead reckoning (Beauregard and Haas Citation2006). In general, the start position is assumed to be unknown. This situation is also called “global localization”. Furthermore, high measurement deviations, e.g. the susceptibility to drift and error of the MEMS sensors, cause additional uncertainty in the position estimation. Digital building models contain a lot of information, e.g. about the structure of the building (walls, passageways, etc.) and can be used for indoor positioning. By comparing the movements with the building information, the estimated position can be checked for plausibility and thus the uncertainty in the position determination can be reduced. However, the estimation of geometric parameters of an autonomous motion is usually a non-linear estimation problem. Complex non-linear and non-Gaussian systems are analytically unsolvable and can be approximated by a Bayesian filtering based on a Sequential Monte Carlo sampling, the so-called particle filter (Thrun, Burgard, and Fox Citation2005; Dellaert et al. Citation1999; Klingbeil et al. Citation2010). The particle filter is a stochastic method for the recursive estimation of the current state of dynamic systems using probability forecasts (Gordon, Salmon, and Smith Citation1993). The idea here is to approximate the Probability Density Function (pdf) of the system by a large number of weighted, independent samples (particles). The implementation of the particle filter for indoor position estimation is divided into four basic steps. During the initialization, in our approach the particles are randomly distributed over the entire building area. In the prediction sampling step, a new position for each individual particle is predicted by using the past measured observations according to the principle of dead reckoning. The distance is predicted from the last three observed steps and the orientation results from the gyroscope measurements (cf. Real Ehrlich and Blankenbach Citation2018). The prediction sampling phase occurs each time a step is detected. Every particle receives a weight wk (2) in the importance sampling (correction) step, which results from the difference between the predicted position (xk, yk) and the actual observed position (zxk, zyk). Taking the measurement noise σz (= standard deviation from empirical studies) into account, the weights are defined as follows (Fahrmeir and Tutz Citation2001):
The observed coordinates result from the actual observation (current change in distance and orientation) according to the principle of dead reckoning. For the heading determination, the sensor fusion of acceleration and magnetic field sensor is used. In the last step, the weights are normalized. Then in the resampling step the particles are selected according to their weights to receive a new estimation of the system state. The selection is performed in accordance to the Low Variance Resampling LVR method to counteract the accidental loss of diversity (Thrun, Burgard, and Fox Citation2005).
show the LVR principle, where, r is a random number between 0 and N−1, and N describes the number of particles. Particles with weights that are smaller than the random number corresponding to u = r + (n–1). N–1 are eliminated, where n = 1,…,N. Particles with a higher weight are duplicated and represent the new estimation whilst the number of particles remains unchanged. The results after several iterations are particle accumulations (point clouds) which represent the user’s position in the building with the highest probability.
The main benefit of the particle filter is that non-linear estimation problems can be solved so that a variety of linear and non-linear information can be fused. In our approach we integrate building models into the filter to evaluate every particle in relation to the building structure, similar to Wang et al. (Citation2007) or Davidson, Collin, and Takala (Citation2010). Particles which have an impermissible position in the building (e.g. inside walls), an impossible movement (e.g. through walls) or are too close to walls (e.g. < 30 cm) are deleted or reduced using the weights. Consequently, particles with very small weights have little to no chance to be considered in the following estimations. Checking the particle positions for plausibility is regulated with constraints as follows:
Unlike other solutions, as many states as possible are checked against the building geometry to filter out incorrect particle positions with each additional step. Also, the weighting of unusable particles is set to zero to minimize the influence of incorrect particle positions on the position estimation. In order to take the inaccuracies on the basis of the sensor errors into account, methods (e.g. the Kidnapped Robot Problem, see next section) for increasing the robustness are added.
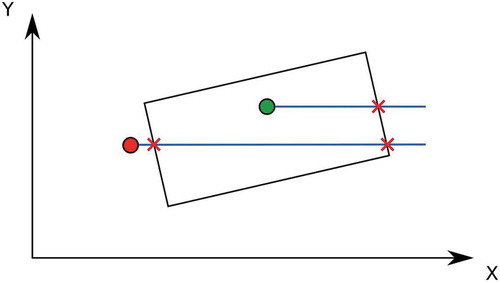
To detect particles that cross or are inside walls, methods of computational geometry are adapted (Preparata and Shamos Citation1988; Grinbergnir Citation2012) and implemented on the device. For example, the detection whether a point is within a polygon (e.g. building space, room area, or entrance area) is solved with an efficient algorithm according to Franklin (Citation2014). The algorithm is based on the Jordan Curve Theorem. The implementation is based on a semi-infinite ray that is cast horizontally from the test point which is then used to count intersections with edges (see ). Every intersection results in a switch between an inside and outside region. With an even number of detected intersections, the point is outside; with an odd number the point is inside the polygon.
Listings 1. Point-in-polygon algorithm (Franklin Citation2014).
int pnpoly (int nv, float [] vx, float [] vy, float pX, float pY) {
int i, j, c=0;
for (i =0, j=nv−1; i<nv ; j=i++) {
i f (((vy[i]>pY) != (vy[j]>pY)) &&
(pX < (vx[j]−vx[i]) * (pY−vy[i]) / (vy[j]−vy[i])+vx[i]))
c=! c ;
}
return c ;
}
with
nv – Number of polygon points,
vx, vy – Arrays with the x and y coordinates of the polygon points,
pX, pY – x and y coordinates of the point to be checked,
c – Save the state of whether the point is inside (true) or outside (false) of the polygon.
Figure 3. Example of Jordan point-in-polygon test.
For a more robust position estimation especially facing the problem of particle depletion, also referred as Kidnapped Robot Problem, the following strategy is pursued. The problem of repositioning (kidnapping) of a robot to an unknown location is a common problem in robotics (Thrun, Burgard, and Fox Citation2005). In this case the robot must realize autonomously that the position is invalid and restarts a new localization. For smartphone indoor positioning based on the particle filter the same problem may occur. Due to the sensor errors, the movement information may be wrongly interpreted which leads to an incorrect position estimation and does not correspond to the actual location anymore. In this case it is very difficult to find the real position again based on the used approach in (3), because the particles with small weights are deleted irretrievably. New interspersed particles solve the problem. If the particle distribution, represented by a kind of distribution ellipse, deteriorates during the position estimation or the estimated position changes considerably from step to step, then a number of particles receive a new randomly distributed position in the building to re-cover the state spaces.
5. External positioning systems
In addition to the integration of the building structure into the particle filter, measurements or observations of external positioning systems based on BLE beacons, magnetic anomalies, or WLAN access points are integrated to support and optimize the real-time position estimation.
5.1. WLAN fingerprinting
Due to the wide availability of WLAN access points in buildings, as well as the standard equipment of technical devices with the WiFi technology, WLAN-based systems are predestined for pedestrian indoor localization. The fingerprinting method, which is based on the comparison of empirical measurements (e.g. received signal strength), is preferred in WLAN systems (Li et al. Citation2006; Khalajmehrabadi, Gatsis, and Akopian Citation2017). The method is divided into two phases. In the first phase, the offline phase (also calibration phase), the building areas are scanned. Each position is assigned to a pattern of signals, the fingerprint, and stored in a database. The result is a so-called radio map. In the second phase, the online phase or localization phase, the position is determined. Here, the current measurements are compared with the fingerprints in the database, searching for the best match. The position can be estimated using deterministic or probabilistic algorithms (Davidson and Piche Citation2017). With regard to the very high fluctuations of WLAN signals due to shadowing or interference, the accuracy of the position determination is in the range of 2 to 10 m. A statistical analysis derived from own experiments on a floor of our university building showed that the position deviations on the coordinate axes (X and Y axes) approximately correspond to the normal distribution. The deviations between estimated and actual position are represented by an empirical density function (histogram) and an empirical distribution function (cumulative distribution function), see and . The frequency density illustrates the dispersion of position errors. The cumulative deviations from the reference points are evident from the empirical distribution function (Benning Citation2010). In addition, an interval estimate is given in which the position estimates lie within a certain probability. For the upcoming investigations, a confidence interval of 95% is assumed. Furthermore, the quantile-quantile diagram (QQ plot, see ) serves as an indication of the agreement of the empirical distribution with the given theoretical distribution, which in this case corresponds roughly to the Standard Normal Distribution (SND). In addition, the QQ plot and the histogram can be used to identify outliers or a possible skewness of the distribution. The – show the position deviations of a floor in a building of the university. However, in other building areas, the deviations might be greater due to signal fluctuations or movement of people.
Figure 4. Empirical density function of the position deviations for the X and Y-axis on the 4th floor.
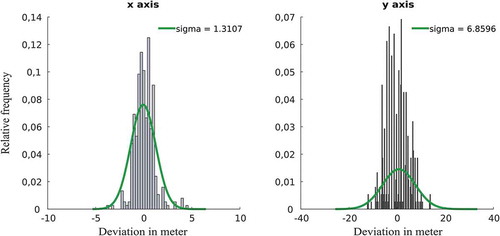
Figure 5. Cumulative distribution function (CDF) of the position deviations for the X and Y-axis on the 4th floor.
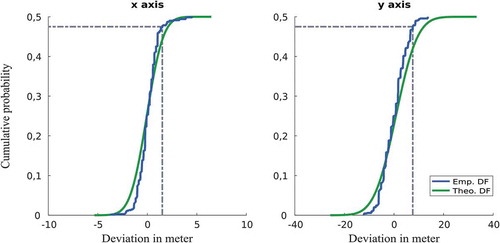
Figure 6. QQ plot of the position deviations for the X and Y axis on the 4th floor.
The WLAN fingerprinting system and the PDR principle are combined to improve the accuracy and reliability of the position estimation. For this purpose, a Gaussian Mixture Model (GMM) is used for the particle weighting. The GMM can be expressed as a weighted sum of M normal distributions (Härdle and Simar Citation2007):
The parameter λ is the weighting factor with the following condition and has been determined empirically:
5.2. RSS based bluetooth positioning
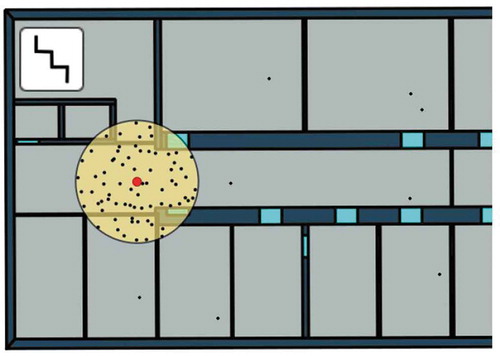
Bluetooth Low Energy (BLE) enables wireless communication with minimal power consumption. The Received Signal Strength (RSS) allows Bluetooth equipped smartphones to receive a rough estimate of the distance to the BLE transmitter (Zhuang et al. Citation2016). Therefore, the position in the transmission area can be corrected using the identification number of permanently installed BLE beacons whose positions are known. The Bluetooth signal is added to the particle filter according to the following constraint: Particles which are located in the observed range of the BLE beacons receive a higher weight. As a result, the particles concentrate at the true user location (see ). The transmission range depends on the transmission power and is set to 3 m for the following examinations.
Figure 7. Limitation of the particles in the transmission range of the BLE beacons.
For the determination of the particle weighting, also a mixture model of two probability distributions is used (6). In contrast to WLAN for RSS-based BLE positioning, an equal distribution in the signal range of the beacons is assumed.
5.3. Magnetic anomalies
The magnetometer, often used as a compass, can be utilized to detect strong Magnetic Anomalies (MA) in the building. Local Magnetic Anomalies are deviations of Earth’s magnetic field caused by ferromagnetic materials or artificial magnetic fields. These disturbances caused for example by radiators, elevators, or electrical systems can be used to narrow down the possible position in the building. The use of magnetic anomaly maps has been increasingly employed for position finding in the past decade (Le Grand and Thrun Citation2012; Storms, Shockley, and Raquet Citation2010). However, to create a magnetic anomaly map, a prior scan of the environment is required, similar to the fingerprinting process. Changes in the environment affect the magnetic field and the reference map must be re-determined. Alternatively, fixed building components that generate magnetic anomalies may be used for the position correction. The strength of Earth’s magnetic field in Germany is in a range of 45 to 50 μT according to the “GFZ German Research Centre for Geosciences” (https://www.gfz-potsdam.de/en/home/, 09.11.2018). By taking the sensor accuracy into account, the range of permissible magnetic field values is limited to 40 to 55 μT. If the specified range is undershot or exceeded, an anomaly can be assumed. Accordingly, particles in the area of ferromagnetic building components receive a higher weight to increase their influence in the particle estimation. The weight size is determined empirically.
6. Real-time capabilities
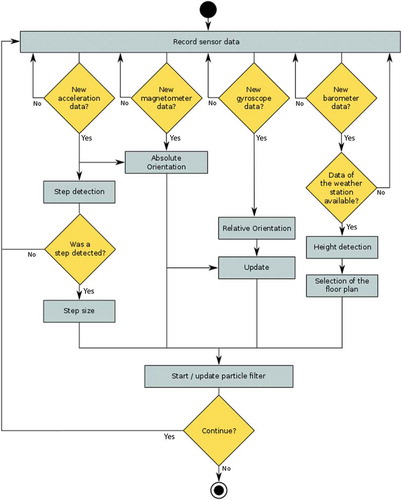
The implementation of the real-time indoor localization app is realized for the Android operating system. The Android API provides developers various functions, including the use of the built-in sensors. A service is implemented for the continuous recording of the sensor data in the background. Thus, the sensor measurement data can be retrieved via interfaces and forwarded to other modules of the application (e.g. for the evaluation or the view). By registering new sensor values, the data is analyzed in real-time for user activities. When a step is detected, the position estimation is activated and the current position is calculated using the particle filter. The process is shown schematically in the following flow chart ().
Figure 8. Schematic representation of the processes in the sensor service.
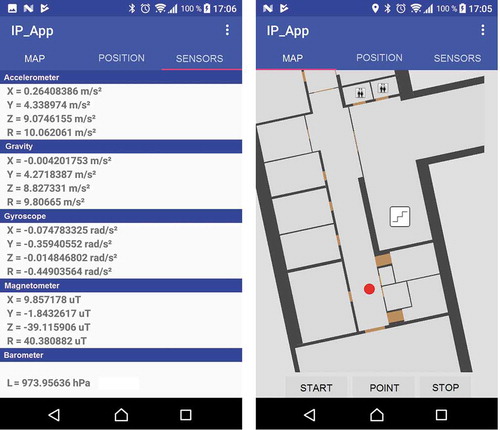
shows the indoor positioning application in real-time. For the evaluation of our indoor positioning approach based on smartphone sensors, we have implemented a graphical but also textual representation of the current sensor and position data.
Figure 9. Developed application for the real-time indoor positioning.
7. Experimental evaluation
A broad experimental validation was conducted for assessing the application of the suggested approach in practice. For a universal applicability of the proposed approach in any building, it is assumed that the starting point is unknown. The building floor determination with help of the barometer sensor is accomplished in the first step. Using this information, the position estimation based on the particle filter starts subsequently with the respective floor plan. illustrates the behavior of the particle filter in a trial run of around 60 m along a predefined route on a floor with an average walking speed of around 1 m/s, whereby the device is held in the hand during the measurement. The figures show the particle filter without the use of external IPS. The movements of the randomly, uniformly distributed particles are determined by the distance and heading resulting from the sensor measurements. The new particle positions are evaluated for plausibility against the building structure; therefore, particles colliding with the walls are removed.
Figure 10. Behavior of the particle filter in a trial run without the integration of external IPS.
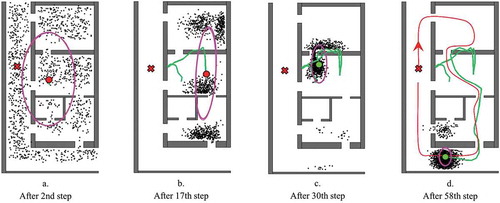
) shows the state of the particle filter after the second step, ) after 17 steps and so on, up until the 58th step in ). For a comparison, an approximation of the actually walked route is shown by a red line starting at the red cross in ). The centroid (center of mass) of all particles represents where the user is most likely located. The particle distribution, which represents the uncertainties in the position, is displayed with a distribution ellipse. The use of the distribution ellipse requires a two-dimensional normal distribution, however, our a-posteriori distribution is not normally distributed. The ellipse parameters, such as the direction angle, or the minor and major half-axis, are still calculated for analyzing the particle distribution.
Depending on size of the distribution ellipse, the centroid is colored red for bad solution and green for good solution. The distance travelled is shown as a green line. The estimated path crosses the wall in some cases. This results from the calculation of the location using the center of mass of all particles. In this regard, it is useful to match the estimated path to a valid walking graph (network) or alternatively, to use clustering-algorithms for the positioning. In order to save computing power, a clustering method is omitted in the smartphone App so far.
Without the use of an external IPS, the particles are distributed over the whole region. After 17 steps, three particle clusters are formed, which represent a possible position of the user. In this case, the particles converge, however, a consistency between the estimated and true position is discernible at a later point in time (see )). In order to eliminate false particle positions more efficiently and to achieve a faster convergence of the particles to the true position, measurements or observations of external positioning systems based on BLE Beacons, magnetic anomalies and WLAN fingerprinting are integrated into the particle filter.
7.1. Digital building model
A digital building model is used for the graphical representation of the position in the building as well as a supporting information source for the position determination with the particle filter. The floor plan is described in the Keyhole Markup Language (KML) format and contains the geometry of walls, doors and rooms as well as areas for changing floors (stairwell and elevators). KML is an eXtended Markup Language (XML) based format developed by Google for the geometric and visual description of geospatial data in web-based maps (Burggraf Citation2015). The building geometry was previously created using a CAD-BIM software (AECOsim Building Designer). Based on analogous floor plans, the geometry could be digitized and exported into the KML format using the software. In order to use the KML data in the particle filter, the geographical coordinates (longitude, latitude) are transformed into UTM coordinates (East, North). For this purpose, a coordinate transformation is used (Snyder Citation1987; Department of Army Citation1989).
7.2. Expenses for the WLAN fingerprinting
For the WLAN positioning we use the Weighted k-Nearest-Neighbor (WKNN) method. The WKNN method determines the position considering its k-nearest neighbors and its weight. The weighting results from the inverse of the Euclidian distance between observed and stored fingerprinting values (Berg Citation2016). For the fingerprint method, first off-line calibration measurements are performed, where RSS signals are observed at various points in the building and stored in a database along with the coordinates of the point. The raster width is set to 2 m. The database is used for the online phase to match the observed signals with the points stored in the database in order to be able to determine the user’s position.
7.3. Expenses for the RSS based bluetooth positioning
To keep the installation costs as low as possible, BLE beacons are distributed along the main traffic routes of the building. In particular, mounting the beacons in the main entrance areas allows the reduction of the particles directly at the beginning of the localization when the user enters the building. The particles therefore converge to the true position much faster than without a starting point.
The transmission range of the BLE beacons depends on the transmission power and is set to 3 m for the following evaluations. For further specification of the position determination, the signal strength is also divided into three categories (see ).
7.4. Expenses for magnetic anomalies
According to the building inspectorate regulations for large buildings, fire doors made of steel are prescribed. Due to the ferromagnetic properties of steel, a disturbance of the magnetometer signal is caused. shows a first recording of the absolute magnetic field strength including magnetic interferences caused by two fire doors.
Figure 11. Fire doors cause local disturbances of the Earth’s magnetic field.
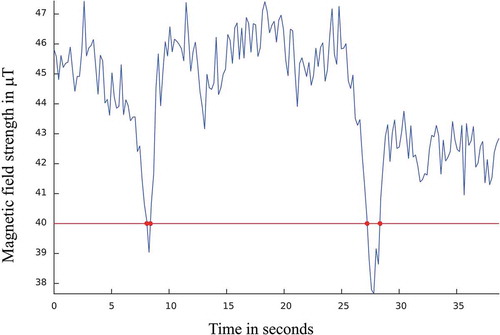
The idea is to detect these anomalies and correct the estimated position in the door areas. The advantage of this approach is that no previous recordings or installations are necessary. The position of the fire doors is taken from the digital building model.
7.5. Results
The localization with smartphones is evaluated on the most popular mobile platform Android. The devices, Google Pixel 2 XL and Sony Z5 Compact, are equipped with several MEMS sensors: gyroscope, accelerometer, barometer, magnetometer, Bluetooth, GNSS, WLAN, camera, etc. For a reliable and accurate position estimation a large number of particles is necessary. Due to the processor performance of the used smartphones, the position estimate with the Pixel 2 XL is limited to 1500 particles and the Sony Z5 to 600 particles.
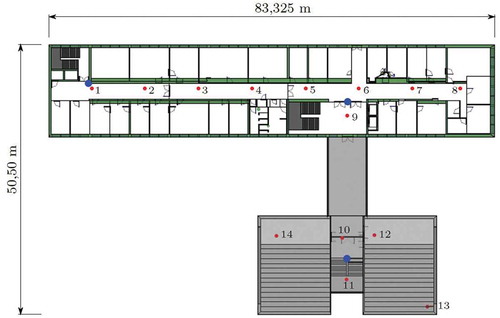
The tests are carried out in a university building with normal interior fittings of lecture rooms and offices (including chairs, tables, office furniture and workstations). To evaluate the positioning accuracy, a test field was created, consisting of 35 ground truth points (reference point, RP) distributed over two floors (see ). A deviation analysis between the estimated and the ground truth positions was carried out in the movement. However, it should be mentioned that an accurate centering of the foot on the ground point is difficult to achieve and because of this effect deviations of up to 30 cm may occur. A test run (145 – 260 m) took about five to ten minutes.
Figure 12. Visualization of the ground truth points on the fourth floor. The beacons are marked in blue.
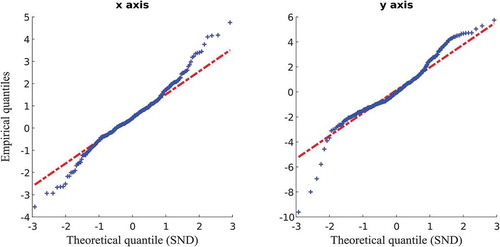
The position deviations based on the position estimation using the embedded smartphone sensors only, viz. without using any external localization system, are usually not normally distributed and therefore do not correspond to the normal distribution. If the position estimation is supported by further (external) local positioning systems, the position deviations roughly correspond to the standard normal distribution except the edges. The following – illustrate the statistical evaluation of the particle filter using three BLE beacons and the detection of magnetic anomalies.
Figure 13. Empirical density function of the position deviations for the X and Y-axis on the 4th floor.
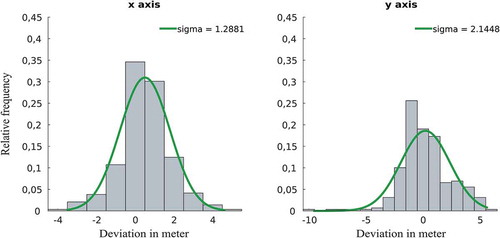
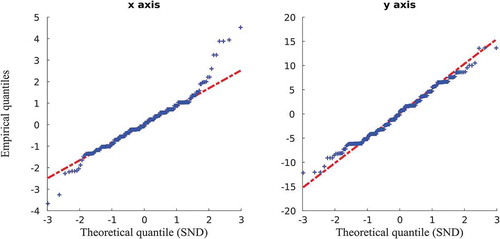
Figure 15. QQ plot of the position deviations for the X and Y axis on the 4th floor.
The following summarizes the results of multiple test runs performed in the test building’s fourth floor derived with two different smartphone types. More than six tests were conducted per method.
Figure 16. Total results of the position estimation with the smartphones Pixel 2 XL and Sony Z5 on the fourth floor.
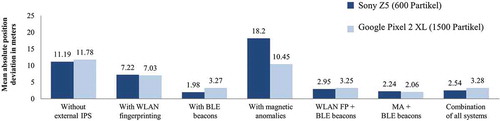
The positioning accuracies also depend on the building structure. The large position deviations in the results without external IPS are due to the fact that no congruence of the estimated position and the true position is achieved. Due to the uncertainties of the measurements – especially the heading determination deviates up to 45 degrees and partially even more – an incorrect position was determined. In addition, in this example the test building is symmetrical and has few differentiating characteristics. Accordingly, the risk increases that the particles follow a false hypothesis. Furthermore, it can be seen that the position accuracy increases with the number of particles. If the number of particles is limited due to the computing power (<1000 particles), other external indoor positioning systems can be used to assist. With the help of external indoor positioning systems, especially with the BLE beacons, a robust and precise position determination is possible. The accuracy of the WLAN fingerprinting is in the range of 2 to 35 m (depending on the currency of the radio map and the personal traffic in the building) and affects the value of hybrid position estimation. The localization using magnetic anomalies fails sometimes because there is no allocation between magnetic anomaly and the building components. When detecting an anomaly, therefore, it often comes to a concentration of the particle in the wrong position. In addition, other magnetic disturbances in the building caused by iron and steel components distort the position estimate. With the combined position estimation (especially the fusion of BLE beacons and MA on the fourth floor), a more robust and accurate position determination is possible.
8. Conclusions
Smartphones are an optimal instrument for user-friendly, cost-effective and easy-to-install mass-market positioning systems for location-based services due to their widespread use and the large number of built-in sensors. This paper presented a real-time smartphone-based pedestrian indoor navigation system. Based on the built-in sensors, the locomotion of the smartphone user are determined. In combination with a building model, false position estimates (e.g. inside walls) or movements (e.g. through walls) are filtered out to improve the position estimation with the particle filter. With external positioning systems, the formation of multiple particle clusters can be minimized to support the position estimation. In this work an optimization was achieved with the WLAN fingerprint method as well as with Bluetooth signals. In particular, the integration of BLE beacons leads to an increase of the accuracy of the system.
By using the particle filter for indoor positioning, an extension of the system is easily possible and thus offers further opportunities. By including additional technologies (e.g. Visible Light Communication)(Luo, Fan, and Li Citation2017) and calculation methods (rasterization), the quality and reliability of the positioning can be further optimized.
The utilization of digital three-dimensional computer models is becoming more and more important, e.g. planning and operation of buildings (Building Information Modelling, BIM). For the description and storing of digital building models, the CityGML data model, an OGC standard for the exchange of 3D city models in different levels of detail (LoD), can be used (CityGML Citation2012). A model at the highest level (LoD 4) contains, among other things, the 3D geometry of interiors as well as other building components (building installations and facilities) and attribute values (materials). This information can also be used for the particle evaluation. For example, it is conceivable to use ferrous components and pipes similar to the fire doors to perform additional location calibrations.
Additional information
Notes on contributors
Catia Real Ehrlich
Catia Real Ehrlich is a research assistant at the Geodetic Institute and Chair for Computing in Civil Engineering & Geo Information Systems at the RWTH Aachen University, Germany. Her research is focused on developing a pedestrian indoor positioning system using smartphone sensors and easy-to-install local positioning systems, such as WLAN fingerprinting and RSS based Bluetooth localization. The goal is to determine the position of the smartphone user in real-time.
Jörg Blankenbach
Jörg Blankenbach is full professor and director of the Geodetic Institute and Chair for Computing in Civil Engineering & Geo Information Systems at the RWTH Aachen University, Germany. He received his doctoral degree (Dr.-Ing.) from Technische Universität Darmstadt, Germany. His research interests are indoor positioning using multiple technologies, 3d data capturing and digital modelling (BIM) and distributed geospatial information systems.
References
- Aggarwal, P., Z. Syed, A. Noureldin, and N. El-Sheimy. 2010. MEMS-Based Integrated Navigation. Boston, London: Artech House.
- Android. 2018. “Sensors Overview.” Accessed 20 Nov 2018. https://developer.android.com/guide/topics/sensors/sensors_overview.html
- Ayub, S., A. Bahraminisaab, and B. Honary. 2012. “A Sensor Fusion Method for Smart Phone Orientation Estimation.” In 13th Annual Post Graduate Symposium on the Convergence of Telecommunications, Networking and Broadcasting. Liverpool, UK, June 25–26.
- Bahl, P., and V. N. Padmanabhan. 2000. “Radar: An In-Building RF Based User Location and Tracking System.” In Proceedings of IEEE INFOCOM. Tel Aviv, Israel, March 26–30.
- Beauregard, S., and H. Haas. 2006. “Pedestrian Dead Reckoning: A Basis for Personal Positioning.” In Proceedings of the 3rd Workshop on Positioning, Navigation and Communication. Hannover, Germany, March 16.
- Benning, W. 2010. Statistik in Geodäsie, Geoinformation und Bauwesen, 3. Auflage. Heidelberg: Wichmann Verlag.
- Berg, L. 2016. “Realisierung und Evaluation eines WLAN-basierten Indoor-Positionierungssystems für Android-Smartphones.” B.Sc. Thesis, RWTH Aachen
- Blankenbach, J. 2010. “Präzise Positions- und Orientierungsbestimmung mit UWB.” In Beiträge zum 16. Internationalen Ingenieurvermessungskurs, München, Germany, February 23–27.
- Blankenbach, J. 2017. “Indoor-Positionierung & Lokale Positionierungssysteme.” Leitfaden - Mobile GIS - Von der GNSS-basierten Datenerfassung bis zu Mobile Mapping. Version 3.0. Accessed July 2017. https://rundertischgis.de/publikationen/leitfaeden.html#a_mobilegis
- Burggraf, D. 2015. “OGC KML 2.3” Version 1.0.” Accessed 14 January 2018. http://docs.opengeospatial.org/is/12-007r2/12-007r2.html
- CityGML. 2012. “Exchange and Storage of Virtual 3D City Models.” Accessed 6 February 2018. http://www.citygml.org
- Correa, A., M. Barcelo, A. Morell, and J. L. Vicario. 2017. “A Review of Pedestrian Indoor Positioning Systems for Mass Market Applications.” Sensors 17 (8): 1–26. doi:10.3390/s17081927.
- Davidson, P., J. Collin, and J. Takala. 2010. “Application of Particle Filters for Indoor Positioning Using Floor Plans.” In Ubiquitous Positioning Indoor Navigation and Location Based Service. Kirkkonummi, Finland, October 14–15. doi:10.1109/UPINLBS.2010.5653830.
- Davidson, P., and R. Piche. 2017. “A Survey of Selected Indoor Positioning Methods for Smartphones.” IEEE Communications Surveys and Tutorials 19 (2): 1347–1370. doi:10.1109/COMST.2016.2637663.
- Dellaert, F., D. Fox, W. Burgard, and S. Thrun. 1999. “Monte Carlo Localization for Mobile Robots.” In Proceedings of 1999 International Conference on Robotics and Automation. Detroit, Michigan, USA, May 10–15. doi:10.1109/ROBOT.1999.772544.
- Department of Army. 1989. “The Universal Grids: Universal Transverse Mercator (UTM) and Universal Polar Stereographic (UPS).” DMA Technical Manual. Accessed 10 November 2017. http://earth-info.nga.mil/GandG/publications/tm8358.2/TM8358\_ 2.pdf
- Ebner, F., T. Fetzer, L. Köping, M. Grzegorzek, and F. Deinzer. 2015. “Multi Sensor 3D Indoor Localisation.” In Indoor Positioning and Indoor Navigation. Banff, Alberta, Canada, October 13–16.
- Evennou, F., and F. Marx. 2006. “Advanced Integration of WiFi and Inertial Navigation Systems for Indoor Mobile Positioning.” EURASIP Journal on Advances in Signal Processing 2006: 086706. doi:10.1155/ASP/2006/86706.
- Fahrmeir, L., and G. Tutz. 2001. Multivariate Statistical Modelling Based on Generalized Linear Models. New York, Berlin, Heidelberg: Springer.
- Foxlin, E. 2005. “Pedestrian Tracking with Shoe-Mounted Inertial Sensors.” IEEE Computer Graphics and Applications 25 (6): 38–46. doi:10.1109/MCG.2005.140.
- Franklin, W. R. 2014. “PNPOLY - Point Inclusion in Polygon Test.” Accessed 26 July 2016. https://www.ecse.rpi.edu/~wrf/Research/Short_ Notes/pnpoly.html
- Gädeke, T., J. Schmid, W. Stork, and K. D. Müller-Glaser. 2011. “Pedestrian Dead Reckoning for Person Localization.” In International Conference on Indoor Positioning and Indoor Navigation, Guimaraes, Portugal, September 21–23.
- Godha, S., and G. Lachapelle. 2008. “Foot Mounted Inertial System for Pedestrian Navigation.” Measurement Science and Technology 19 (7): 075202. doi:10.1088/0957-0233/19/7/075202.
- Gordon, N., D. Salmon, and A. Smith. 1993. “Novel Approach to Nonlinear/nonGaussian Bayesian State Estimation.” IEE Proceedings on Radar and Signal Processing 140 (2): 107–113. doi:10.1049/ip-f-2.1993.0015.
- Grinbergnir. 2012. “CodeProject - Is a Point inside a Polygon?” Accessed 26 July 2016. http://www.codeproject.com/Tips/84226/Is-a-Point- inside-a-Polygon
- Gupta, S. K., S. Box, and R. E. Wilson. 2014. “Low Cost Infrastructure Free Form of Indoor Positioning.” In International Conference on Indoor Positioning and Indoor Navigation. BEXCO. Busan, Korea, October 27–30. doi:10.1109/IPIN.2014.7275462.
- Hafner, P., T. Moder, T. Wieser, and T. Bernoulli. 2013. “Evaluation of Smartphone-Based Indoor Positioning Using Different Bayes Filters.” In International Conference on Indoor Positioning and Indoor Navigation. Montbeliard-Belfort, France, October 28–31. doi:10.1109/IPIN.2013.6817876.
- Härdle, W. K., and L. Simar. 2007. Applied Multivariate Statistical Analysis. Berlin, Heidelberg, New York: Springer.
- Harle, R. 2013. “A Survey of Indoor Inertial Positiong Systems for Pedestrians.” IEEE Communications Surveys & Tutorials 15 (3): 1281–1293. doi:10.1109/SURV.2012.121912.00075.
- Hightower, J., R. Want, and G. Borriello. 2000. “SpotON: An Indoor 3D Location Sensing Technology Based on RF Signal Strength.” UW CSE Technical Report, February 18.
- Jiang, J. H., H. L. Le, and S. C. Shie. 2016. “Lightweight Topological-Based Map Matching for Indoor Navigation.” In 30th International Conference on Advanced Information Networking and Applications. Crans-Montana, Switzerland, March 23–25. doi:10.1109/WAINA.2016.62.
- Jiménez Ruiz, A. R., F. Seco Granja, J. C. Prieto Honorato, and J. I. Guevara Rosas. 2012. “Accurate Pedestrian Indoor Navigation by Tightly Coupling Foot-Mounted IMU and RFID Measurements.” IEEE Transactions on Instrumentation and Measurement 61 (1): 178–189. doi:10.1109/TIM.2011.2159317.
- Khalajmehrabadi, A., N. Gatsis, and D. Akopian. 2017. “Modern WLAN Fingerprinting Indoor Positioning Methods and Deployment Challenges.” IEEE Communications Surveys & Tutorials 19 (3): 1974–2002. doi:10.1109/COMST.2017.2671454.
- Klingbeil, L., R. Reiner, M. Romanovas, M. Traechtler, and Y. Manoli. 2010. “Multi-Modal Sensor Data and Information Fusion for Localization in Indoor Environments.” In 7th Workshop on Positioning, Navigation and Communication. Dresden, Germany, March 11–12. doi:10.1109/WPNC.2010.5654128.
- Lawitzki, P. 2012. “Android Sensor Fusion Tutorial.” Accessed 15 November 2016. https://www.codeproject.com/Articles/729759/Android-Sensor-Fusion-Tutorial
- Le Grand, E., and S. Thrun. 2012. “3-Axis Magnetic Field Mapping and Fusion for Indoor Localization.” In IEEE International Conference on Multisensor Fusion Und Integration for Intelligent Systems. Hamburg, Germany, September 13–15. doi:10.1109/MFI.2012.6343024.
- Li, B., J. Salter, A. G. Dempster, and C. Rizos. 2006. “Indoor Positioning Techniques Based on Wireless LAN.” In Proceedings of the First IEEE International Conference on Wireless Broadband and Ultra Wideband Communications. Sydney, Australia, March 13–16.
- Liu, H., H. Darabi, P. Banerjee, and J. Liu. 2007. “Survey of Wireless Indoor Positioning Techniques and Systems.” IEEE Transactions on Systems, Man, and Cybernetics, Part C: Applications and Reviews 37 (6): 1067–1080. doi:10.1109/TSMCC.2007.905750.
- Liu, J., R. Chen, L. Pei, R. Guinness, and H. Kuusniemi. 2012. “A Hybrid Smart-Phone Indoor Positioning Solution for Mobile LBS.” Sensors 12 (12): 17208–17233. doi:10.3390/s121217208.
- Luo, J., L. Fan, and H. Li. 2017. “Indoor Positioning Systems Based on Visible Light Communication: State of the Art.” IEEE Communications Surveys & Tutorials 19 (4): 2871–2893. doi:10.1109/COMST.2017.2743228.
- Mautz, R. 2012. Indoor Positioning Technologies. Habilitation thesis, Institute of Geodesy and Photogrammetry, Department of Civil, Environmental and Geomatic Engineering, ETH Zurich.
- Michalson, W. R., A. Navalekar, and H. K. Parikh. 2009. “Error Mechanisms in Indoor Positioning Systems without Support from GNSS.” Journal of Navigation 62 (2): 239–249. doi:10.1017/S0373463308005201.
- NASA. 1976. Force U.A. Standard Atmosphere 1976. Washington, DC, USA: U.S. Government Printing Office.
- Neges, M., C. Koch, M. König, and M. Abramovici. 2015. “Combining Visual Natural Markers and IMU for Improved AR Based Indoor Navigation.” Advanced Engineering Informatics 31: 18–31. doi:10.1016/j.aei.2015.10.005.
- Ni, L. M., Y. Liu, Y. C. Lau, and A. P. Patil. 2003. “LANDMARC: Indoor Location Sensing Using Active RFID.” In Proceedings of the First IEEE International Conference on Pervasive Computing and Communications. Fort Worth, Texas, March 26–26. doi:10.1109/PERCOM.2003.1192765.
- Preparata, F. P., and M. Shamos. 1988. Computational Geometry – An Introduction. New York: Springer Verlag.
- Priyantha, N., A. Chakraborty, and H. Balakrishnan. 2000. “The Cricket Location-Support System.” In 6th ACM International Conference on Mobile Computing and Networking. Boston, USA, August 06–11. doi:10.1145/345910.345917.
- Real Ehrlich, C., and J. Blankenbach. 2018. “Pedestrian Localisation inside Buildings Based on Multi-Sensor Smartphones.” In 2018 Ubiquitous Positioning, Indoor Navigation and Location-Based Services. Wuhan, China, March 22–23. doi:10.1109/UPINLBS.2018.8559699.
- Real Ehrlich, C., J. Blankenbach, and A. Sieprath. 2016. “Towards a Robust Smartphone-Based 2,5D Pedestrian Localization.” In International Conference on Indoor Positioning and Indoor Navigation (IPIN). Alcalá De Henares, Madrid, Spain, October 4–7. doi:10.1109/IPIN.2016.7743597.
- Sakpere, W., M. Adeyeye-Oshin, and N. B. W. Mlitwa. 2017. “A State-Of-the-Art Survey of Indoor Positioning and Navigation Systems and Technologies.” South African Computer Journal 29 (3): 145–197. doi:10.18489/sacj.v29i3.452.
- Schwieger, V. 2008. “High-Sensitivity GPS - an Availability, Reliability and Accuracy Test.” In Proceedings on FIG Working Week. Stockholm, Schweden, June 14–19.
- Snyder, J. P. 1987. “Map Projections - A Working Manual.” U.S. Geological Survey Professional Paper 1395. Accessed 23 April 2019. https://pubs.usgs.gov/pp/1395/report.pdf
- Storms, W., J. Shockley, and J. Raquet. 2010. “Magnetic Field Navigation in an Indoor Environment.” In 2010 Ubiquitous Positioning Indoor Navigation and Location Based Service (UPINLBS). Kirkkonummi, Finland, October 14–15. doi:10.1109/UPINLBS.2010.5653681.
- Thrun, S., W. Burgard, and D. Fox. 2005. Probabilistic Robotics. Cambridge: MIT-Press.
- Toth, C., D. A. Grejner-Brzezinska, and S. Moafipoor. 2007. “Pedestrian Tracking and Navigation Using Neural Networks and Fuzzy Logic.” In IEEE International Symposium on Intelligent Signal Processing. Alcala De Henares, Spain, October 3–5. doi:10.1109/WISP.2007.4447525.
- Wang, H., H. Lenz, A. Szabo, J. Bamberger, and U. D. Hanebeck. 2007. “WLAN-Based Pedestrian Tracking Using Particle Filters and Low-Cost MEMS Sensors.” In 4th Workshop on Positioning, Navigation and Communication. Hannover, Germany, March 22.
- Want, R., A. Hopper, V. Falcao, and J. Gibbon. 1992. “The Active Badge Location System.” ACM Transactions on Information Systems (TOIS) 10 (1): 91–102. doi:10.1145/128756.128759.
- Willemsen, T., F. Keller, and H. Sternberg. 2015. “A Topological Approach with MEMS in Smartphones Based on Routing-Graph.” In International Conference on Indoor Positioning and Indoor Navigation (IPIN). Banff, Alberta, Canada, October 13–16.
- Windau, J., and L. Itti. 2016. “Walking Compass with Head-Mounted IMU Sensor.” In 2016 IEEE International Conference on Robotics and Automation (ICRA). Stockholm, Sweden, May 16–21. doi:10.1109/ICRA.2016.7487770.
- Xu, H., Y. Ding, P. Li, R. Wang, and Y. Li. 2017. “An RFID Indoor Positioning Algorithm Based on Bayesian Probability and K-Nearest Neighbor.” Sensors 17 (8): 1806. doi:10.3390/s17081806.
- Zhang, J., B. Li, A. G. Dempster, and C. Rizos. 2010. “Evaluation of High Sensitivity GPS Receivers.” In International Symposium on GPS/GNSS. Taipei, October 26–28.
- Zhuang, Y., J. Yang, Y. Li, L. Qi, and N. El-Sheimy. 2016. “Smartphone-Based Indoor Localization with Bluetooth Low Energy Beacons.” Sensors 16 (5): 596. doi:10.3390/s16050596.
- Zwirello, L., T. Schipper, M. Harter, and T. Zwick. 2012. “UWB Localization System for Indoor Applications: Concept, Realization and Analysis.” Journal of Electrical and Computer Engineering 2012: 849638. doi:10.1155/2012/849638.