
 ?Mathematical formulae have been encoded as MathML and are displayed in this HTML version using MathJax in order to improve their display. Uncheck the box to turn MathJax off. This feature requires Javascript. Click on a formula to zoom.
ABSTRACT
This paper presents an indoor floor positioning method with the smartphone’s barometer for the purpose of solving the problem of low availability and high environmental dependence of the traditional floor positioning technology. First, an initial floor position algorithm with the “entering” detection algorithm has been obtained. Second, the user’s going upstairs or downstairs activities are identified by the characteristics of the air pressure fluctuation. Third, the moving distance in the vertical direction and the floor change during going upstairs or downstairs are estimated to obtain the accurate floor position. In order to solve the problem of the floor misjudgment from different mobile phone’s barometers, this paper calculates the pressure data from the different cell phones, and effectively reduce the errors of the air pressure estimating the elevation which is caused by the heterogeneity of the mobile phones. The experiment results show that the average correct rate of the floor identification is more than 85% for three types of the cell phones while reducing environmental dependence and improving availability. Further, this paper compares and analyzes the three common floor location methods – the WLAN Floor Location (WFL) method based on the fingerprint, the Neural Network Floor Location (NFL) methods, and the Magnetic Floor Location (MFL) method with our method. The experiment results achieve 94.2% correct rate of the floor identification with Huawei mate10 Pro mobile phone.
1. Introduction
Location-based services for the products and applications, such as car navigator, the Baidu map and the Didi taxi, have become an indispensable part of the people’s life (Guo et al. Citation2019; Wang, Wu, and Wu Citation2016; Sadana et al. Citation2011). People’s demand for the indoor accurate location service is tremendous (Gao et al. Citation2019), such as firefighting and rescues to locate the accurate location of the trapped persons and the firefighters, navigation service in shopping malls, the intelligence of hospital care, and finding a room or facility’s location in a building (Joseph and Sergio Citation2013; Zhang, Zhan, and Dan Citation2013; Uradzinski et al. Citation2017). For those indoor positioning scenes, the information of the floor has played an important role (Liu and Zhang Citation2003; Yu Citation2015).
A lot of studies on the positioning of the floor have been done by the previous researchers (Chen, Li, and Pan Citation2015; Wu Citation2015). Ai (Citation2015) put forward a floor discriminant method based on the neural network, which can extract the WiFi signal characteristics from all reference points in each floor, put it into the neural network for training and learning, and obtain a series of the weights to improve the positioning accuracy. For judging the floors, one can put the real-time WiFi signal strength into the neural network and get the floor decision result (Ai et al. Citation2015). Ye (Citation2016) used the geomagnetic data to discriminate floors. In the offline phase, one can collect the geomagnetic fingerprints of the buildings to build the magnetic fingerprint database, and into online phase, one can obtain the floor positioning by matching the real-time magnetic data with fingerprint database (Ye Citation2016; Ye and Gu Citation2016). Sun and Dun (Citation2012) imitated the idea of the seamless switch between the indoors and the outdoors, and installed WSN nodes in the transition areas such as staircase. The switch between the floors has realized, and success rate of this method is greater than 75%. The SkyLoc system designed by Alex and others used GSM signal fingerprint to locate the floor, and for 73% of the cases, it can correctly locate the user’s floor (Alex et al. Citation2007). Du et al. (Citation2013) studied the differential air pressure altimetry method based on terrestrial mobile communication base station, and used the well-developed terrestrial mobile communication base station as the differential measurement reference point of the air pressure, and transmitted the relevant measurement data to user by using transmission link of the mobile communication base station (Massimo Citation2014). The user can utilize the mobile station to observe the elevation value, the air pressure value and the temperature value of the measuring point, then combine the air pressure value and the temperature value at the measuring point of the receiver, and use the relationship between the elevation and the air pressure value to obtain the absolute elevation value of user. These methods for the floor positioning can achieve a high accuracy, but the dependence on the signal environment is higher in terms of the specific implementation. Especially, the offline-database construction and the process of the signal acquisition need a lot of time and manual labor, the update or maintenance of the fingerprint signals is difficult, and all of these factors lead to low availability (Deng, Wang, and Xu Citation2012; Deng, Yu, and Xu Citation2013).
With the development of wireless communication technology become more comprehensive and intelligent use and the widespread use of portable smart devices, more and more high-precision micro-sensors have been pursued (Yu, Chen, and Li Citation2015). For example, Apple, Huawei, Xiaomi and other mainstream mobile phone manufacturers have equipped high-precision barometer on their high-end mobile phones. For example, Huawei mate8 mobile phone is equipped with Rohm’s BM1383 barometer. In terms of the relative elevation measurement, the precision can reach 1 m. The range can meet the accuracy requirements of the current indoor floor positioning, which provides a good hardware foundation for the indoor elevation measurement by using barometer of smartphone (Banerjee, Agarwals, and Sharma Citation2015).
The existing floor positioning methods have some limitations. For example, the deployment requirements of the WiFi signal source are high, and a certain number of signal sources need to be deployed on each floor, or need to establish WiFi fingerprint database (Yungeun et al. Citation2013), geomagnetic fingerprint database offline, etc., and high dependence on the signal environment (Joaquin et al. Citation2017). Once the support of the positioning hardware infrastructure is lost or the fingerprint database missing, the floor positioning cannot be effectively performed. In addition, the fingerprint database still has problems such as large workload of building database and difficulty in updating and maintaining (Tsui, Chuang, and Chu Citation2009). These factors have led to the present situation. Some floor positioning technologies are not highly usable and it is difficult to apply them to real-life scenarios.
In the study by Ye, Gu, and Tao (Citation2016) and others also rely on smart phones to achieve the positioning of floor with high positioning accuracy. However, the fingerprints (barometer fingerprint map) of each floor must be provided, and the method of crowdsourcing is used. Lacking the support of the barometer fingerprint map, one cannot locate on the floor, and the establishment process of the barometer fingerprint map is difficult to implement in the actual environment. The updating and maintenance are also the problems to be considered. To some extent, the application scenario of this positioning method is limited. The purpose of our paper is to reduce the reliance of the floor location method on the signal environment, fingerprint database, and decrease the additional hardware facilities to increase the usability. The method proposed by our paper only relies on smart phones and a small number of WiFi signal sources, without the needing of pre-establish an additional supporting database. Compared with the method proposed by others, our method is simpler and easier to implement, easier to extend, and the accuracy is satisfactory. Although the positioning accuracy of our method is slightly lower than that of Ye’s method, optimizing the algorithms in our paper will greatly improve the positioning accuracy.
Although many research results have been achieved in floor positioning, they may have more or less limitations such as high maintenance costs, poor positioning stability, and poor usability (Ruan et al. Citation2018). In order to solve the above problems, this paper puts forward an indoor floor positioning method based on smartphone height measurement. No hardware is required except for smartphones and very few APs. The initial floor can be determined by the “enter” detection algorithm. By analyzing the characteristics of the pressure fluctuations, it is possible to judge the user’s activities going upstairs or downstairs. According to the relationship between air pressure and altitude, the vertical movement distance and floor change when going up or down is possible to estimate, and the location of the floor where the user is located can be obtained. In addition, this paper also introduces a neighborhood-based pressure sensor relative error calibration method, which can be used to calibrate pressure data from different mobile phones, effectively reducing the air pressure error caused by the heterogeneity of mobile phone hardware and software. The floor positioning method proposed in this paper improves the accuracy of floor recognition, effectively reduces the dependence of environmental signals, and achieves high precision and high availability of floor positioning.
2. Detailed scheme
2.1. Pressure and relative height conversion
According to meteorology, the formula for calculating the relative approximate distances of two different heights is as follows:
where h and h0 are, respectively, the altitudes of the pressure and
,
is the gas constant (
= 287.05287m2/(s2K)),
is the thermodynamic temperature of the air, and
is the acceleration of the gravity (
= 9.80665m/s2). According to (Yu Citation2015), the influence of the temperature on the change of height can be ignored when the pressure is calculated in the indoor environment. As
,so
is the relative height which represents the air pressure difference from the
evel P to the horizontal plane for
. Converting the temperature
to the centigrade temperature
, substituting the related parameters, and expressing in the common logarithm, then one can get the formula (2):
where . According to the above formula, the relative height of the two horizontal planes can be estimated with the known pressures.
Here, it should be noted that most of the current smart phones are not equipped with temperature sensors. The weather temperature on the smart phones is obtained from the weather website, and cannot truly reflect the real-time temperature of the floor to be tested. When the model calculates the vertical movement distance of the user space, the ambient temperature value is needed. To solve this problem, this paper takes the online weather temperature as the predicted temperature of the unknown temperature.
On the 2nd to 7th floors of the Comprehensive Building of Qingshanhu Campus of Jiangxi Normal University (Note: the height of each floor is 3.52 m), using Huawei Mate8 and Samsung Note2 mobile phones to measure the air pressure using the above indoor air pressure altimetry model for relative height estimation, cumulative error distribution over 240 tests. is the cumulative error distribution of relative height estimates by Huawei Mate8 and Samsung Note2. shows the error distribution of the height measurement with the two kinds of mobile phones at the different precision limit values.
Table 1. Error Distribution Data.
Figure 1. The cumulative error distribution of relative height estimates by Huawei Mate8 and Samsung Note2.
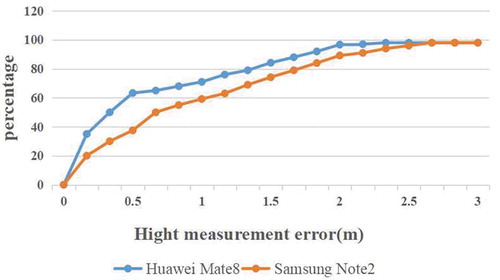
There are a total of 240 times tests in , in which 96.7% of the height estimation errors of the two mobile phones are below 2.0 m. The test results show that maximum error value is 2.13 m for Huawei Mate8, is 2.63 m for Samsung Note2, and both of them are lower than a floor height (3.52 m) of the experimental building. This proves that the precision of the smart phone relative height estimation by the formula (2) can meet the requirement of the floor positioning accuracy.
2.2. Going-upstairs and going-downstairs activity detection
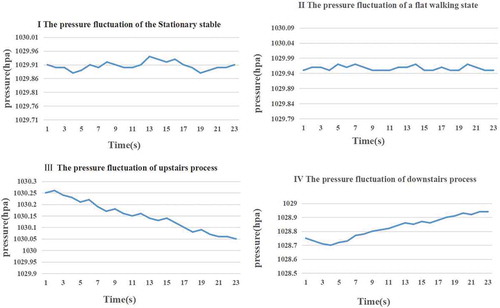
Although the pressure moment is changing, there is a certain law: when moving in the horizontal direction, the altitude changes very little, and thus the air pressure fluctuation is small. When going upstairs or downstairs, there will be a significant change in altitude, and the pressure changes significantly, showing an increasing or decreasing trend. shows the change of the air pressure over time (the pressure sampling frequency is 5 Hz) in the four behavioral states including the stationary, the horizontal walking, going upstairs and downstairs.
Figure 2. Pressure changes over time in four states.
Taking 10 s as an observation period to collect the air pressures, 120 times tests with Huawei Mate8 mobile phone were conducted in the above four states. shows the average pressure differences every two seconds in each state. represents the pressure at time
, and the average
represents the average difference between the pressures at
and
in the 30 statistics.
Table 2. Average pressure differences of four states at the intervals of 2 s (Air pressure units: hpa).
Walking in horizontally or static for 2 s, the air pressure remains approximately the same, and the pressure difference between walking for 2 s is close to zero. For the process going upstairs or downstairs, the pedestrian elevation changes are about 0.5 m to 1.5 m in 2 s. According to the experience value, the pressure difference is about 0.06–0.18 hpa, there is a clear distinction of the pressure fluctuations between the previous two states and going up or down, and the resolution of the smart phone pressure sensor can reach 0.01 hpa, which can effectively recognize this pressure difference.
If the air pressure difference exceeds a certain threshold in a short period of time, it can be judged that the user is going upstairs or downstairs. In addition, when the final pressure value is lower than the initial pressure value, it can be judged that there is an upstairs behavior; when the final pressure value is higher than the initial pressure value, it can be judged that the downstairs behavior occurs. According to this, the paper proposes to use the smart phone barometers for detecting the pedestrian’s upstairs or downstairs. The process is shown below in .
Figure 3. Flow chart of going-upstairs and going-downstairs behavior detection.
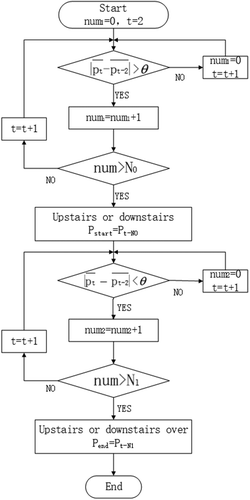
The counting variables are num1 and num2 in the process of going upstairs or downstairs, when the current air pressure difference between the last two moments is less than the air pressure threshold of the upper and lower building activities, count once, otherwise clear and re-count. is time variable,
is a threshold which distinguishes the state of walking on the stairs from the stationary state,
is the pressure value at time t, only in a short period of time, the difference between the pressure values of the last two moments exceeds a certain threshold for several consecutive times; then, we determine that the behavior of going up and down is happened,
and
are the number of times that can avoid “ping-pong effect”.
is the air pressure at the beginning of going-upstairs or going-downstairs, and
means the pressure at the end of going-upstairs or going-downstairs. In the paper, Pt is 5 Hz data,
is the average value of Pt for one second at time t in the following chart and the calculation process.
The followings are the steps of the going-upstairs and going-downstairs behavior detection algorithm:
loop1:
if(The difference between average air pressure at time t and average air pressure at time t–2 is less than the threshold ){
time plus one and continue to cycle;
}
else{
count plus one
}
if(num1 is less than the threshold N0){
time plus one and continue to cycle;
}
else{
goto loop2;
}
loop2:
if(The difference between average air pressure at time t and average air pressure at time t–2 is greater than the threshold){
time plus one and continue to cycle;
}
else{
count plus one
}
if(num2 less than the threshold N1)){
time plus one and continue to cycle;
}
else{
jump out of the loop
}
2.3. “entering” detection
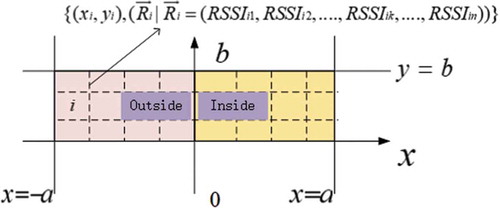
The primary role of the “entry” detection is to perceive where the user is, whether indoors or outdoors. If users are inside the building, they will be given the initial floor position: the first floor. Other scholars generally judge the indoor and outdoor space based on the number of GPS satellites and the signal-to-noise ratio data received by the mobile phone, but it is difficult to deal with only by relying on the mobile phone. In this paper, we use the fingerprint location algorithms to detect the activity of pedestrians entering the building based on the matching results of the pedestrians near the building entrances, and the specific methods are as follows.
2.3.1. Monitoring the area layout
The indoor and outdoor entrance and exit attachment areas are designated as detection areas, and then at least 3 APs are arranged in the detection area, and there is no requirement for the topology of these APs. The virtual coordinate system is divided into grids, and each grid vertex is set as a reference point. The RSS data is collected at each reference point and the coordinate system position coordinates of the point are collected, and the most fingerprint is uploaded into the location fingerprint data. shows the detection area schematic diagram:
Figure 4. Monitoring area schematic diagram.
2.3.2. Target location matching
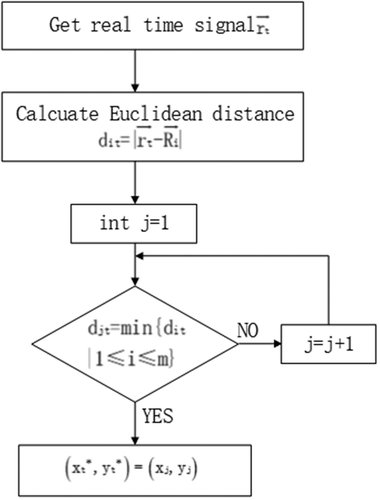
In order to obtain the real-time signal strength indicator vector of moving target in certain period , the Euclidean distance between the vectors in fingerprint database and the real-time signal strength indicator vector is calculated. Then, select the minimum vector of Euclidean distance, one can take its corresponding position as the real-time positioning result as shown in .
Figure 5. Monitoring area flow-process diagram.
2.3.3. “entering” detection algorithm
Although the target movement route is different (), there are still some features as follows:
Figure 6. Different movement route schematic diagram.
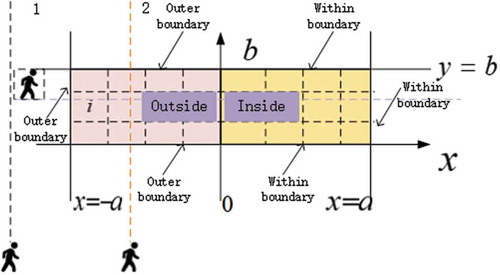
(1) The target approaches the detection area from the outside, passing (but not enter the building) the detection area and moving towards the outside; The position matching result always appears on the outer boundary of the detection region (see the two people logos at the bottom of ).
(2) The target is to be close to the detection area from the outside, pass through the detection area, and walk towards the outside the building (but not enter the building, see the people logo at the middle of );
The location matching results first appear in the outer boundary of the detection region, then appear within the detection area, and finally appear on the outer boundary of the detection region.
(3) The target approaches the detection area from the outside and enters the building through the detection area.
The location matching results first appear in the outer boundary of the detection region, then continuously appear within the detection area, and finally appear inside the inner boundary of the detection region. Therefore, the process of “entering” detection algorithm is shown in .
Figure 7. The flow chart of “entering” detection algorithm.
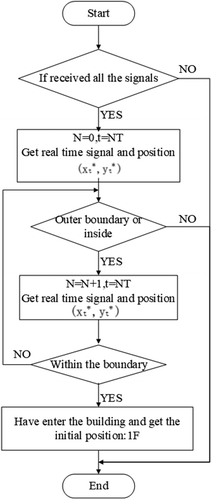
2.4. Floor estimation
Through the “entering” detection algorithm above, one can detect a pedestrian entering the building, and give him an initial floor location: the first floor. Through the going-upstairs and downstairs behavior detection algorithm, one can perceive pedestrian taking stairs, record the air pressure values of the start and the end, estimate the relative height of the pedestrian moved by the formula (2), and then we can obtain the current floor number as the following formula (3):
where F and F0 are the current floor number and the initial floor number of the pedestrian, respectively, h0 is the height of each layer of the building, and the function of round (x, 0) is to realize the rounding of the parameter x after rounding. The current floor number can be used as a new initial position, whenever the floor changes again, and the new floor number can be calculated according to the above formula (3).
2.5. Pressure sensor calibration
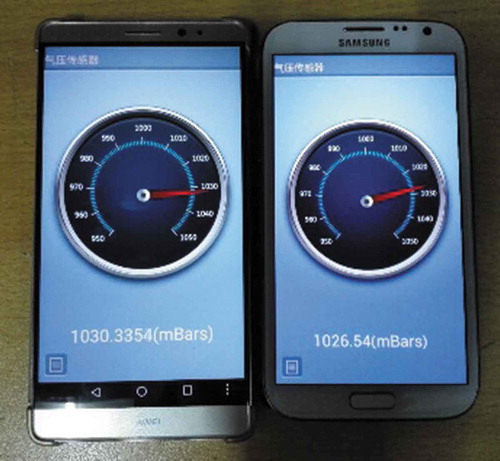
According to the above method, the location of the floors can be detected by the smartphones. However, it should be noted that the detection accuracy of Huawei Mate8 is significantly higher than Samsung Note2 in the above section II. This is because the two phones have different models of the air pressure sensors. illustrates the problem more visually. Due to the heterogeneity of hardware and software of various types of mobile phones, the observations of the two smart phones using the air pressure sensor are different in the same environment, which affects the error in the elevation estimation. In order to reduce the impact of hardware and software on floor positioning accuracy, it is necessary to calibrate various models of smartphone barometers.
Figure 8. Barometric difference between Huawei Mate8 (right) and Samsung (left).
In this paper, we briefly introduce the calibration method of the pressure sensor based on the nearest neighbor, which is divided into the following two parts.
Based on the WiFi RSSI received by the multiple smart phones, the calibration is triggered, and one can calculate the similarity of WiFi signal strength indicator vectors in the locations of these phones. The closer the phones’ locations are, the similar they are. If the similarity of those phones is higher than the nearest neighbor threshold, it can be determined that they are in similar position and trigger the calibration, otherwise the calibration will not be triggered.
Then we take the calibration process, i.e. after defining one kind of the cell phone in a similar location as a standard device, the air pressure data are measured as the standard value. We compare the air pressure data measured by other kinds of mobile phones with the standard pressure value, and calculate the error value. As a relative error of this kind of the phone barometer, it is recorded to the calibration information database of the standard equipment, and in the next measurement, the error value will be compensated according to the measured values to obtain the correct pressures.
3. Experimental results and analysis
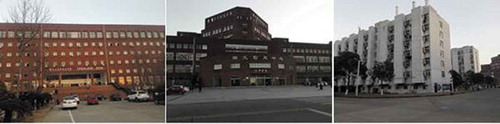
In order to verify the effectiveness and test positioning accuracy of the proposed floor location method, the floor positioning experiment was carried out in the three buildings of Xiansulou, Library and Student Dormitory in Yaohu Campus of Jiangxi Normal University (). The three buildings are seven, six and six floors. A rectangular detection area is delineated at the front entrance of each building. The entrance has been divided into the outdoor part and the indoor part by the lines around, each occupies half of the detection area. A number of WiFi signal sources have been deployed in the building in advance, and the WiFi signal receivers used in the experiment are Huawei Mate8, Xiaomi (Millet) 5S, and Samsung Note2.
Figure 9. Experimental buildings.
The delimited rectangular detection area is divided into a plurality of square grids by a specification of 1 m × 1 m further. The grid fixed points are used as reference points for offline acquisition, are sequentially marked and numbered, and a plane coordinate system is established to determine each reference the spatial coordinates of the point. During the acquisition process, the handheld person collects each reference point for 20 times. The average value of the sampled data is taken as the observation value of the reference point, and the spatial position coordinates are recorded, and the location fingerprint database is established. It is worth noting that the collector must be stationary for about 30 s when he/she arrives at the next reference point to ensure the stability of the signal, reducing the dramatic changes in the signal caused by the sudden movement (e.g. hopping) of the collector.
3.1. Test of going-upstairs and going-downstairs activity detection
It designed that the pedestrians go upstairs and downstairs. We have carried out 20 experiments in each experimental building by each mobile phone. In these experiments, the three threshold values involved in algorithm are . In total 180 tests, the correct detection was taken by 165 times, and the floor positioning correct rate was 91.6%. Among them, Huawei Mate8, with the highest recognition accuracy, has a 95.0% floor positioning rate accuracy, and the lowest recognition accuracy is Samsung Note2 mobile phone. The floor positioning rate accuracy is 86.6%. shows the floor positioning correct rate of the behavior recognition of going upstairs and downstairs.
Figure 10. Precision of going upstairs and going-downstairs detection.
3.2. Test of “entering” detection algorithm
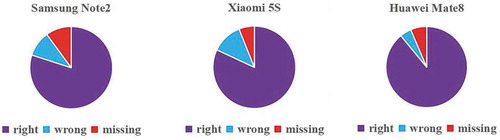
It is designed that pedestrians passing through or through the test area on the different routes. Although the routes are different, they can be attributed to the three basic types in this article, and one can perform the “entering” detection algorithm to verify the accurate identification of pedestrians entering the building. During the total 180 tests, 164 were correctly detected, nine errors were judged and seven missed, and the accuracy was 91.1%. shows the precision of “entering” detection.
Figure 11. Precision of “entering” detection.
3.3. Test of the floor position
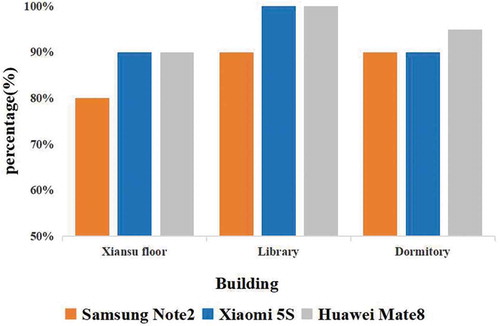
In combination with Sections 2.1 and 2.2, the pedestrians hold the smartphones in the experiment buildings, and each mobile phone carried out 20 experiments in three buildings. shows the number of the floor correct identification at the different buildings on campus. The average correct rate of the floor identification is 85.6% for three types of the cell phones, in which the correct rates for 80.0%, 85.0%, and 91.7% for Samsung Note2, Xiaomi 5S, and for Huawei Mate8, respectively.
Table 3. Correct number of the floor identification.
In addition, this paper compares and analyzes three common floor location methods from the view of availability and accuracy, namely the WLAN Floor Location (WFL) method based on the fingerprint, the Neural Network Floor Location (NFL) methods, and the magnetic Floor Location (MFL) method.
The experimental environment is deployed in the XianSu Building (seven floors) of Jiangxi Normal University. Huawei mate10Pro mobile phone, which has relatively good air pressure sensor performance, is used as the positioning equipment. Select an area of 80 m2 in the same location on each floor as the experimental area.
WFL is divided into two stages: offline database construction and online positioning. In the offline construction stage, a certain number of WiFi signal source APs and several sampling points are required on each floor of the building to construct a floor location fingerprint database. In the online positioning stage, the WiFi signal strength of the point to be measured is compared with each signal strength vector in the floor location fingerprint database pre-established in the offline phase, and the floor number corresponding to the signal strength vector with the highest similarity in the fingerprint database is selected. As a result of floor positioning, the routers are deployed at intervals of 10 m in this experiment, and the fingerprint sampling points are set every 2 m to ensure the positioning accuracy. According to the number of floors and the building area, a total of 28 WiFi APs and 210 sampling points can be calculated.
The principle of NFL is to extract the WiFi signal characteristics of all reference points on each floor offline, put them into neural network for training and learning, and obtain a series of weights. When determining the floor, the real-time WiFi signal strength is put into the trained neural network to obtain the floor determination result. Its deployment requirements and the number of samples are the same as the WFL method.
The principle of MFL is that the geomagnetic signal is unique in spatial distribution, especially in the narrow space such as the corridor, the geomagnetic signals of different corridors are clearly distinguished. It is also divided into two stages: offline database construction and online positioning: offline stage, collecting geomagnetic signal data of corridors between floors, and establishing a geomagnetic fingerprint mapping table. If the total number of building floors is n, including m corridors, geomagnetism, the fingerprint mapping table needs to contain mn(n–1) fingerprint data. In the online positioning stage, the geomagnetic fingerprint sequence collected during the upper and lower floors (up and down stairs) is matched with the geomagnetic fingerprint mapping table pre-established in the offline phase to find the geomagnetic fingerprint of the corridor with the highest degree of similarity, and it is possible to determine which section of the corridor the user is moving during the up and down stairs to determine the floor location. It does not need to deploy any AP, the experimental building has 7 floors, there are 2 left and right corridors, and it can be calculated that 84 geomagnetic fingerprint data are needed to construct the geomagnetic fingerprint data mapping table.
The method proposed in this paper only needs to deploy 3 APs in the building entrance detection area. The detection area specification is 2 m × 8 m, and the number of sampling points needs to be 27.
The above four floor positioning methods were used to perform 35 localization experiments, respectively. They are compared and analyzed from three aspects: the quantity requirement of AP deployment, the workload of fingerprint database (the number of sampling points or fingerprints) and the correct rate of floor location. The results are as follows:
The two numbers “28 APs” and “210 sampling points” in the second row of are in accordance with the hardware deployment requirement of the WFL positioning method in this experiment. According to the experience, a router is usually deployed at an interval of 10 m. A fingerprint sampling point is set at the interval of 2 m to ensure the positioning accuracy. The building in this experimental environment has 7 floors, and the experimental area of each floor is about 80 m2. A total of 28 APs and 210 sampling points are required for the calculation.
Table 4. Accuracy comparison of four floor positioning methods.
The floor location method based on smartphone behavior awareness proposed in this paper is referred to as “MBFL” in . It has less WiFi APs, less number of sampling points or fingerprints, and higher correct rate of floor location.
It can be concluded that in practical applications, WFL and NFL methods require more WiFi APs and other hardware. WFL, MFL, and NFL need to collect more fingerprint points. While the MBFL method needs less the number of WiFi APs and the number of sampling points, which is a significant advantage in floor positioning. In this experiment, WFL, MFL, and NFL methods can have better positioning accuracy, but at the same time, it is necessary to deploy more signal source APs and set more sampling points. In the case of the large indoor environment, it will greatly increase the cost of installation and labor.
Based on the analysis above, the floor location method proposed in this paper only relies on the smart phone barometer and the deployment of a very small number of AP signal sources in the detection area, which greatly reduces the dependence of the location method on the signal environment. It greatly decreases WiFi AP deployment quantity, reduces the workload of off-line fingerprint collection, increases the availability of location method, saves the cost of location hardware to a certain extent, and has higher correct rate for floor positioning at the same time. The correct rate of floor positioning is above 90%, which meet the needs of the floor location in real life better.
4. Conclusions
This paper presented the method of indoor floor positioning, which is only based on the smartphone barometer measurement and a small number of WiFi signal sources. The purpose of our paper is to reduce the reliance of the floor location method on the signal environment, and decrease the number of fingerprints and additional hardware facilities to increase the usability. It also has the advantages in using smartphone for indoor positioning in people life, and does not need any other hardware.
In a total of 240 times tests, 89.2% of the height estimation errors of the two mobile phones are below 2.0 m, the maximum error value is 2.13 m for Huawei Mate8, and 2.63 m for Samsung Note2, and both of them are lower than one-floor height (3.52 m) of the experimental building. Furthermore, it has had high availability, and the average correct rate of the floor location is 85.6%.
The paper compared three other methods (WFL, MFL, NFL) with our method (MBFL), conducted the experiments with the mobile phone Huawei mate10 Pro, and achieved 94.2% correct rate of the floor identification. And compared with the method proposed by others, our method is simpler and easier to implement, easier to extend, and the accuracy is obviously improved.
5. Perspectives
This paper has achieved certain research results in the field of floor positioning. The floor positioning method proposed in this paper improves the low availability of traditional positioning methods. However, there are still some problems to be solved, mainly as follows:
The accuracy of the air pressure at the beginning and end of the activity is the main factor that determines the accuracy of the floor positioning method. How to accurately identify the air pressure values at the start and end of the upper and lower buildings (up and down stairs) remains the main problem. In order to further improve the accuracy of the floor positioning method of this paper, it needs to be solved in the future.
Since the current smart phone does not have a temperature sensor, this paper takes the online weather temperature as the predicted temperature of the unknown temperature. The analysis shows that the influence of high accuracy on the air pressure measurement is small within a certain temperature range. If the function relationship between the temperature and the air pressure measurement can be established accurately, the height error caused by the temperature offset is supplemented accordingly, this will help improving the overall accuracy of the floor positioning further.
Acknowledgments
We would like to thank the reviewers for helpful comments, and the editors for English editing of our paper.
Additional information
Funding
Notes on contributors
Min Yu
Min Yu obtained her Master degree in 1988 and B. Eng. degree in 1985 from Department of Electronics and Information Engineering, Huazhong University of Science and Technology, China, majoring in Communication and Electronics Engineering, now is a professor of Communication, Electronic Engineering, and Computer Science at Jiangxi Normal University, was a visiting scholar at the University of California, Irvine, and interested in navigation and positioning, wireless sensor network, and indoor positioning.
Feng Xue
Feng Xue is a PhD candidate of Jiangxi Normal University, and interested in navigation and positioning, wireless sensor network, and indoor positioning.
Chao Ruan
Chao Ruan is a PhD candidate of Jiangxi Normal University, and interested in navigation and positioning, wireless sensor network, and indoor positioning.
Hang Guo
Hang Guo got his PhD in Geomatics and Geodesy with emphasis on navigation from Wuhan University in 2003, now is a professor of Academy of Space Technology at Nanchang University, and was a visiting scholar at the Ohio State University, Louisiana State University, USA, University of FAF, Munich, Germany, University of New Brunswick, and University of Calgary, Canada. His interests include multi-sensor integrated navigation system, indoor positioning, and GNSS MET.
References
- Ai, H. 2015. “Method to Identify Floor in WiFi Fingerprinting Location System.” Journal of WUT (Information & Management Engineering) 37 (3): 269–286.
- Alex, V., L. M. Anthony, and H. Jeffrey. 2007. “The Skyloc Floor Localization System.” Paper presented at the Fifth Annual IEEE International Conference on Pervasive Computing and Communications, New York, March 19-23 2007, 125–134. doi:10.1094/PDIS-11-11-0999-PDN.
- Banerjee, D., K. Agarwals, and P. Sharma. 2015. “Improving Floor Localization Accuracy in 3D Spaces Using Barometer.” Proceedings of the 2015 ACM International Symposium on Wearable Computers. New York: ACM, 171–178.
- Chen, L., S. Li, and G. Pan. 2015. “Smartphone: Pervasive Sensing and Applications.” Chinese Journal of Computer 38 (2): 423–438.
- Deng, Z., W. Wang, and L. Xu. 2012. “A K-Means Based Method to Identify Floor in WLAN Indoor Position System.” Software 33 (12): 114–117.
- Deng, Z., Y. Yu, and L. Xu. 2013. Indoor and Outdoor Wireless Positioning and Navigation. Beijing: Beijing University of Post and Telecommunication. pp. 1–8.
- Du, X., J. Yan, L. Zhang, and C. Liu. 2013. “Differential Air Pressure Altimetry Method Based on Ground Mobile Communication Base Station.” Journal of Beijing University of Aeronautics and Astronautics 39 (1): 83–88.
- Gao, M. J., M. Yu, H. Guo, and Y. Xu. 2019. “Mobile Robot Indoor Positioning Based on a Combination of Visual and Inertial Sensors.” Sensors 19 (8): 1773. doi:10.3390/s19081773.
- Guo, H., H. Li, J. Xiong, and M. Yu. 2019. “Indoor Positioning System Based on Particle Swarm Optimization Algorithm.” Measurement 134: 908–913. doi:10.1016/j.measurement.2018.12.038.
- Joaquin, T. S., B. F. Oscar, M. Raul, T. Sergio, and C. Andrea. 2017. “In-Home Monitoring System Based on WiFi Fingerprints for Ambient Assisted Living.” Journal of Ambient Intelligence and Smart Environments 9 (5): 543–560. doi:10.3233/AIS-170450.
- Joseph, N. P., and C. L. Sergio. 2013. Introduction to Satellite Navigation Systems, 6–15. New York: Springer.
- Liu, J., and X. Zhang. 2003. “Progress of Airborne Laser Scanning Altimetry.” Journal of Wuhan University (Information Science Edition) 28(2): 132–137. (in Chinese).
- Massimo, F. 2014. “Calibration-Less Indoor Location Systems Based on Wireless Sensors.” Journal of Ambient Intelligence and Humanized Computing 5 (2): 249–261. doi:10.1007/s12652-013-0192-9.
- Ruan, C., M. Yu, X. He, and B. Song. 2018. “An Indoor Floor Positioning Method Based on Smartphone’s Barometer.” Paper presented at the Proceedings of the UPINLBS 2018: Ubiquitous Positioning, Indoor Navigation and Location-Based Services, Wuhan, China, 22–23 March.
- Sadana, S., S. Yadav, N. Jha, V. Gupta, R. Agarwal, A. Bandyopadhyay, and T. Saxena. 2011. “A Computer Controlled Precision High Pressure Measuring System.” Measurement Science Review 11 (6): 198–202. doi:10.2478/v10048-011-0037-7.
- Sun, Z., and Z. Dun. 2012. “WSN Assisted Indoor Seamless Switching System.” Beijing: Science Paper Online. [2012-0222]. http://www.paper.edu.cn/releasepaper/content/201202-846. 10.1094/PDIS-11-11-0999-PDN
- Tsui, A. W., Y. H. Chuang, and H. H. Chu. 2009. “Unsupervised Learning for Solving RSS Hardware Variance Problem in WiFi Localization.” Mobile Networks &Applications 14 (5): 677–691. doi:10.1007/s11036-008-0139-0.
- Uradzinski, M., H. Guo, X. K. Liu, and M. Yu. 2017. “Advanced Indoor Positioning Using Zigbee Wireless Technology.” Wireless Pers Commun 97: 6509–6518. doi:10.1007/s11277-017-4852-5.
- Wang, L., F. Wu, and L. Wu. 2016. “Total Least Squares Fitting Estimation Model for GPS Height Transformation.” Journal of Wuhan University (Information Science Edition) 41(9): 1259–1264. (in Chinese).
- Wu, C. 2015. Wireless Indoor Positioning Based on Group Intelligence Perception. PhD Dissertation, Tsinghua University. 10.1128/AEM.03322-14
- Ye, H. 2016. Research on Indoor Label Positioning Technology Based on Smartphone. Nanjing: Nanjing University.
- Ye, H., T. Gu, and X. Tao. 2016. “B-Loc: Scalable Floor Localization Using Barometer on Smartphone.” Wireless Communications & Mobile Computing 16 (16): 2557–2571. doi:10.1002/wcm.2706.
- Yu, Q. 2015. Algorithms and it’s Realization of Indoor 3D Localization with Multi-Sensor Information Fusion. PhD Dissertation, China University of Mining and Technology.
- Yu, W. B., P. Li, Z. Chen, and C. Li. 2015. “PDR-Aided Algorithm with WiFi Fingerprint Matching for Indoor Localization.” Applied Mechanics and Materials 3682: 701.
- Yungeun, K., S. Hyojeong, C. Yohan, and C. Hojung. 2013. “Smartphone-Based Wi-Fi Tracking System Exploiting the RSS Peak to Overcome the RSS Variance Problem.” Pervasive and Mobile Computing 2013 (9): 406–420.
- Zhang, G., W., . X. Zhan, and L. Dan. 2013. “Research and Improvement on Indoor Localization Based on RSSI Fingerprint Database and K-Nearest Neighbor Points.” Paper presented at the International Conference on Communications Circuits and Systems (ICCCAS). Chengdu, China, November 15 –17.