
 ?Mathematical formulae have been encoded as MathML and are displayed in this HTML version using MathJax in order to improve their display. Uncheck the box to turn MathJax off. This feature requires Javascript. Click on a formula to zoom.
ABSTRACT
With rising population, decline in soil productivity and land-based conflicts, the per-capita land availability for cultivation is rapidly decreasing within Benue State, a largely agrarian and small-holder setting. This study attempts a local-level support for the actualisation of Sustainable Development Goal Number 2 (“end hunger, achieve food security and improved nutrition, and promote sustainable agriculture”) by 2030. Using Multi-Criteria Decision Making (MCDM) method, remote sensing data from Climate Research Unit (CRU) and in-situ data from Nigeria Meteorological Agency (NIMET) were analyzed by GIS techniques to map the suitability of rice cultivation in the study area, with the integration of Normalized Difference Vegetation Index (NDVI), land cover, slope, temperature, precipitation and soil parameters (cation exchange capacity, pH, bulk density, organic carbon). We apply the various statistical parameters that include mean spatial NDVI; correlation coefficient, standard deviation and Root Mean Square (RMS) between CRU and NIMET data. Spatial regression trend analysis is conducted between CRU precipitation and NDVI and between CRU temperature and NDVI from 1985 to 2015. The results reveal that NDVI in highly suitable rice planting regions is higher than marginally suitable regions except in the months of October and November, which shows that the highly suitable regions will yield better than the marginally suitable regions during the dry season. Additionally, NDVI is seasonally bimodal in response to precipitation, meaning that vegetation vigor is more dependent on precipitation than temperature. Finally, the correlation coefficient, standard deviation and RMS between CRU and NIMET precipitation data shows 0.42, 108, and 110, respectively, while these three factors between CRU and NIMET temperature data shows 0.88, 1.60, and 0.86, respectively. In conclusion, the MCDM approach reveals that upland is more suitable for rice cultivation in Benue State when comparing with the area provided by the Global Land Cover and National Mappings Organization (GLCNMO) data.
1. Introduction
Generally, food production in the global south has not kept pace with population increase as reflected in the increasing levels of food (especially rice) importation and under-nourishment in countries such as Nigeria (Federal Office of Statistics Citation2009), Ethiopia (Ayehu and Besufekad Citation2015), Papua New Guinea (Samanta, Pal, and Pal Citation2011), Pakistan (Naz and Rasheed Citation2017), and Kenya (Kihoro, Bosco, and Murage Citation2013). In Nigeria, rice is both a key staple food and also a major source of livelihood for a significant proportion of the farming population but its production is still unable to meet the demand for local consumption, hence the importation of rice is a major factor in depleting Nigeria’s foreign reserve. Currently, the Federal Government of Nigeria (FGN) through the Central Bank of Nigeria (CBN) is seeking to boost agricultural production with rice highly prioritized. Several studies (Adejuwon Citation2006; Mahmood et al. Citation2012; Adamgbe and Ujoh Citation2012, Citation2013; Ujoh Citation2013) have suggested that the declining yield of crops particularly rice in Nigeria is attributable to several factors such as fluctuating climatic parameters, pressure on land due to population growth and attendant declining size of farm holdings, instability, and migrations resulting from ethnic conflicts and farmer-herdsman crises, and inability of the peasant farmers to access fertilizers. These are in addition to conservative attitudes towards extension services, and market forces that are disincentives, soil quality and terrain/relief, low capital base of farmers, pests and diseases, field operations, timing of planting, and superimposed on these is a fluctuating climate regime and weather elements.
Optimizing rice production can be achieved primarily through farming practices that are environmentally friendly and economically efficient. As population continues to increase with consequent per capita land allocation decrease, the critical need to optimally utilize available land resources for efficient agricultural production is becoming increasingly prominent and indeed unavoidable. Additionally, countries in sub-Saharan Africa which are parties to the UN Sustainable Development Goals (SDGs) are making deliberate efforts to achieve the goals. Of interest to this study is the SDG Number 2 which generally aims to “end hunger, achieve food security and improved nutrition, and promote sustainable agriculture”, via the following specific target:
Target 2.4: “By 2030 ensure sustainable food production systems and implement resilient agricultural practices that increase productivity and production, that help maintain ecosystems, that strengthen capacity for adaptation to climate change, extreme weather, drought, flooding and other disasters, and that progressively improve land and soil quality”.
Generally, the efforts towards improving rice cultivation begin with a suitability study which has been severally conducted in different parts of Africa (Ayehu and Besufekad Citation2015; Samanta, Pal, and Pal Citation2011; Kihoro, Bosco, and Murage Citation2013) and the rest of the world (Naz and Rasheed Citation2017; Maddahi et al. Citation2014; Dengiz Citation2013). In spite of the usefulness of these studies, a prominent knowledge gap lies in the validation of remote sensing data using in situ data on key weather and soil parameters that collectively support a suitability modelling for rice cultivation, especially in a setting where weather continues to record high fluctuation levels and variation in the quality of soil parameters.
Currently, the size of area under rice cultivation within the study area cannot be accurately ascertained due to poor statistics and record-keeping from local farmers. Basically, rice cultivation in Benue State is by and large far less than the total cultivable land in the study area. This shows that there is a yield-gap in rice production in Benue State. In addition to identifying suitable areas for rice cultivation, this study also seeks to conduct a validation of the Climate Research Unit (CRU) gridded observation data using the Nigeria Meteorological Agency (NIMET) data of key weather elements such as temperature and precipitation, and soil parameters such as Cation Exchange Capacity (CEC), soil pH, bulk density, and Soil Organic Carbon (SOC) to ascertain the accuracy level and reliability of remote sensing data for developing an index model to assess the areas suitable for rice cultivation in Benue State, Nigeria.
2. Materials and methods
2.1. Study area
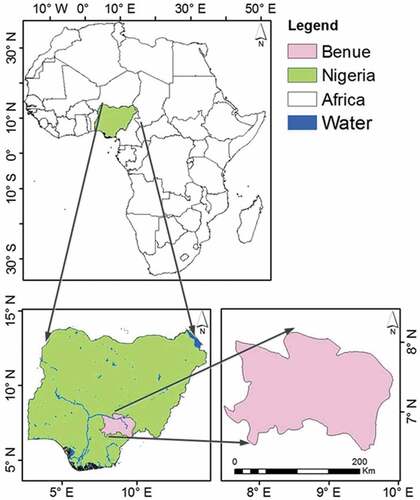
Benue State, the Food Basket of Nigeria, is a predominantly lowland area (averaging 100–300 m above mean sea level) within the lower river Benue trough in the Middle Belt region of Central Nigeria. The location is between E and
E longitude, and between
N and
N latitude with an area of 34,059 km2 (). The area has two distinct growing seasons of rice (but also applies to other crops): Dry season rice (February–July) and wet season rice (June–December). With the annual rainfall totaling over 2000 mm, the wet season rice cultivation is more preferred by farmers than the dry season type because of the sufficient rainfall and favorable temperature conditions during the Wet Summer of the West African Monsoon months. Wet season rice is basically cultivated near the river channels and the streams to take advantage of the retained water of the West African Monsoon rain. During the dry season rice farming, irrigation practices are the basic mechanisms used to distribute water over the rice farms. The study covers these two seasonal modes of rice cultivation within the study area which comprises a number of ethnic groups including Tiv, Idoma, Igede, Nyifon, Etulo, etc., who are predominantly small-holder farmers. Over the last 36 months, the study area has been under sustained conflicts/attacks from pastoralists and herdsmen over grazing land. An understanding of the actual land resources suitable and available for rice (and other crops) cultivation could also serve as useful information towards planning to end the farmers-herdsmen conflicts over land resources.
Figure 1. The study area of Benue State.
2.2 Data sets
2.2.1 Climate data sets
The climate factors used in this work are temperature and rainfall which present favorable conditions and in some situations unfavorable conditions for cultivation, development, and production of rice (Samanta, Pal, and Pal Citation2011). The study used gridded rainfall and temperature data obtained from the CRU of University of East Anglia (UEA) from 1985 to 2015 (30 years). The CRU data set is a gridded observation which has been widely applied in many studies over West Africa. These data sets were also compared with local observation data sets obtained from Nigeria Meteorological Agency (NIMET), Makurdi station. The data sources for temperature, rainfall (precipitation) and other soil parameters are shown in .
Table 1. Data sets and their suitability classification.
2.2.2 Soil properties
Soil is a vital component of our agro-ecosystem (Ayehu and Besufekad Citation2015) and plants survival in any particular area depends on the nutrient content of the soil. Thus, understanding soil physical and chemical properties is essential for suitability analysis and mapping of rice. The soil pH, bulk density, CEC, and SOC were the parameters selected in this study. These soil parameters, the remote sensing data sets, and their data sources are also shown in .
2.2.3 Land cover and topographical data sets
The physical surface material that covers the land surface, referred to as the land cover, used in this work is the Global Land Cover and National Mapping Organizations (GLCNMO) data. The data sets are one of the eight main global data sets developed from Moderate Resolution Imaging Spectra Radiometer (MODIS) by cooperation of GLCNMO (Tateishi et al. Citation2008). The GLCNMO was most preferred in this work because it has Paddy fields already mapped as one of the land cover classes. So in a way, the validation using NIMET data (on the one hand) and the re-mapping of rice paddies in Benue State (on the second hand) are to collectively serve as a somewhat verification study of the earlier GLCNMO mapping of rice paddies in Benue State.
Digital Elevation Model (DEM) is described as a spatially geo-referenced raster-based data set that is popularly used for environmental modeling purposes (Toz and Erdogan Citation2008). DEM has become a widely used tool to better assess, visualize and examine topographic features. Each cell of the DEM contains a representative value of the elevation related to the areal limit of the cell (Moglen and Maidment Citation2005). In this work, the National Aeronautics and Space Administration (NASA) Shuttle Radar Topographic Mission (SRTM) digital elevation data were used to extract the slope. The NASA SRTM has provided DEMs for more than 80% of the globe. The data source is given in , available at 3 arc second (approximately 90 m resolution) DEMs. The data sets have vertical error of less than 16 m, distributed by NASA/USGS as a finished product (contains “No-data” holes) where elevation measurement was impeded by water or heavy shadow.
The SRTM DEM was used to extract slope (in % rise) for the study area using ArcMap 10.3.1. The Slope Tool computes the maximum rate of change between each pixel and its neighbors, so that every pixel in the output raster has a slope value. Basically, lower (or higher) slope values indicate a level (or steeper) terrain. Generally, level and flat surfaces are highly favored for rice farming as it facilitates even and equal distribution of water (Samanta, Pal, and Pal Citation2011).
2.2.4 Vegetation data sets
The National Oceanic and Atmospheric Administration (NOAA) Advanced Very High Resolution Radiometer (AVHRR) Normalized Difference Vegetation Index (NDVI) data sets used in this study were obtained from the NASA Global Inventory Modeling and Mapping Studies (GIMMS) group stretching from 1985 to 2015 (30-year period). AVHRR GIMMS was selected because it is the only global updated records and also the most widely used AVHRR dataset (Yin et al. Citation2012). AVHRR GIMMS NDVI datasets are 15-day maximum value composites (MVC) at 0.083° × 0.083° spatial resolution. The GIMMS NDVI records undergo careful data post-processing, as well as corrections of residual differences between sensors, viewing geometry caused by orbit drift, volcanic aerosols effects, and low signal-to-noise ratios due to sub-pixel cloud contamination (Tucker et al. Citation2005). For these accuracy reasons, the GIMMS NDVI is considered most suitable for the NDVI analysis of this study.
2.3 Study approach
The approach adopted in this work is the Analytical Hierarchy Process (AHP). The AHP is one of the extensive methods widely employed to resolve Multi-Criteria Decision-Making (MCDM) (Giri and Nejadhashemi Citation2014) because it is widely accepted and considered by numerous researchers as the most reliable multi-MCDM method (Ayehu and Besufekad Citation2015). As a result of the huge number of parameters involved in decision-making, land suitability analysis can be identified as a multi-criteria evaluation approach (Maddahi et al. Citation2014). All literature on AHP and MCDM have been properly documented by numerous researchers (Giri and Nejadhashemi Citation2014; Ayehu and Besufekad Citation2015; Maddahi et al. Citation2014; Masoud et al. Citation2013; Abach and Ngigi Citation2016; Kihoro, Bosco, and Murage Citation2013; Naz and Rasheed Citation2017).
MCDM was applied in the 1960s to assist decision-making by accommodating several criteria/options, while also incorporating the opinions/focus of the population involved, into a potential or retrospective framework (Singha and Swain Citation2016). In essence, the MCDA approach generally allows for the analysis of alternatives on the basis of conflicting and incommensurable factors which may be quantitative and/or qualitative (Elaalem Citation2010), relying of GIS tools which accurately evaluates and assign weights to each variable according to their relative importance on the optimal growth conditions for crops (Perveen et al. Citation2008). The relevance and strength of this approach are in its capacity present a synoptic perspective by handling a wide range of criteria data at multi-spatial, multi-temporal and multi-scale levels, and from different sources for a time-efficient and cost-effective analysis.
In addition, the adoption of the MSDM approach is based on its simplicity and applicability in terms of identification and selection of parameters required for locating best sites, for collection of data, for preparation and processing of data, for development of AHP and coupling MCDM with GIS. The outcome/output of this process are maps that show appropriate areas suitable for rice cultivation, over a wide area where access may be impeded due to security concerns and other challenges. On the whole, the parameters selected for examination in this study include temperature, precipitation, soil pH, land cover map, SOC, CEC, soil bulk density and slope of the study area. In this method, land suitability is determined by using different GIS analytical techniques, including overlay based on multi-criteria analysis and AHP.
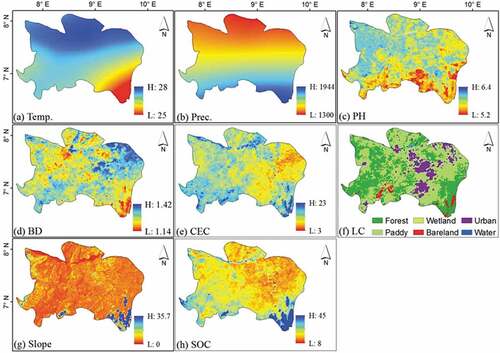
In terms of temporal coverage of this study, the averages of climate data sets (temperature and precipitation) from 1985 to 2015 were used to develop the climate maps. The SRTM DEM map (90 m × 90 m) was also used to create slope. The details concerning springs, streams, and rivers were obtained from Diva-GIS (http://www.diva-gis.org/Data) and were mapped in a GIS domain. Locations of urban areas, bare lands, and open fields were obtained from GLCNMO and mapped by GIS software. Criteria maps were developed and extracted within the boundary shape files. Rasters indicating entire classes in a particular layer were developed as shown in . All the maps were resampled to the same resolution (0.0083° × 0.0083°).
Figure 2. Maps of (a) mean temperature (oC) of 1985– 2015, (b) mean precipitation (mm) of 1985-2015, (c) soil pH, (d) bulk density (g/cm3), (e) CEC (cmol/kg), (f) land cover, (g) slope (% rise), (h) SOC (g/kg).
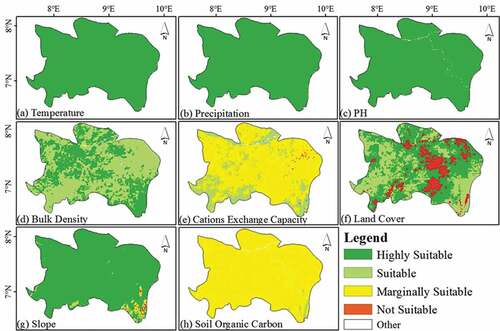
Finally, the criteria maps of land suitability are shown in ordinal classes and presented as S1 (Highly Suitable), S2 (Suitable), S3 (Marginally Suitable) and NS (Not Suitable). The unconcerned category is classified as “other”. This reveals the degree of suitability of one attribute class from another according to the needs of rice cultivation. shows the rasterized S1, S2, S3 and NS suitability classes of standardized criteria maps for this work.
Figure 3. Rasterized suitability criteria for rice cultivation over Benue State, constraint (a) mean temperature, (b) mean precipitation, (c) soil pH, (d) bulk density, (e) CEC, (f) land cover, (g) slope, (h) SOC.
3. Results and discussions
3.1. Analysis of temperature and soil parameters
shows the analyzed maps of (a) mean air temperature with a high of 28°C and a low of 25°C from 1985 to 2015; (b) mean precipitation from 1985 to 2015 ranging from a high of 1944 mm to a low of 1300 mm; (c) soil pH from a high of 6.4 to a low of 5.2; (d) high bulk density of 1.4g/cm3 to a low of 1.1g/cm3; (e) a high CEC of 23 cmol/kg to a low of 3 cmol/kg; and (f) land cover map showing six main land cover types (mixed forest, wetland, urban, paddy field, bareland, and water). Other maps include (g) a high slope rise of 35.7%, and a low slope rise of 0; and (h) a high concentration of SOC of 45g/kg and a low concentration of 1g/kg.
The eight parameters analyzed in are independently applied for suitability analysis of rice cultivation in . Each of the parameters shows varying extent of suitability results for rice cultivation in the State. For instance, while mean temperature, slope rise, and SOC reflect a higher suitability for rice cultivation across the State, soil pH and CEC show the least suitability for rice cultivation across the State. The land cover classification map ()) reveals the largest area considered unsuitable (NS) for rice cultivation.
The soil pH describes the level of acidity or alkalinity in the soil which ranges from 0 to 14 and pH lower (higher) than 7 indicates acidity (alkalinity). Neutral soils have a pH of 7. Soil pH affects crop development, yields, suitability, nutrient availability, and soil micro-organism activity, thereby influencing crucial soil processes (USDA-NRCS, Citation1998). All plants are affected by excessive levels of pH but there is wide variation in their tolerance of acidity and alkalinity in the soil. The range of pH between 4 and 8 is most favorable for rice cultivation (Ambarwulan et al. Citation2016).
Given that the CEC is a soil parameter that shows its ability to supply nutrient cations to the soil solution for plant uptake (Sonon, Kissel, and Saha Citation2014), it is considered appropriate for rice cultivation because the topography in the study area is vulnerable to high surface run-off during the wet season. However, it is important to note that many soil parameters (especially soil pH, texture, and organic matter content) affect the CEC to a certain extent (Tomasic et al. Citation2013). Their spatial distributions are discernible in –e) and .
SOC is the basic component of organic matter content, which is a vital source of carbon for soil processes, and a sink for carbon sequestration (Arunrat, Pumijumnong, and Hatano Citation2017; Qin, Huang, and Zhuang Citation2013), and is found to be helpful in mitigating climate change and food security (Sun et al. Citation2013). Application of fertilizers to soil causes an initial increase in nutrient concentration in the soil which results in soil nutrients shifting toward clay particles (Sonon, Kissel, and Saha Citation2014). For long-term double rice farming without application of fertilizers, there is a significant increase in SOC concentration which suggests that double rice farming expedites the accumulation and storage of SOC (Sun et al. Citation2013). According to Foth (Citation1990), soil pH is positively correlated with CEC which implies that high pH may increase the number of exchangeable cations in the soil. All of these combine to determine the suitability of rice cultivation within the study area.
The bulk density of a soil sample is referred to as the ratio of the mass (or weight) of that sample to the bulk volume (Chaudhari et al. Citation2013). It is commonly used as a standard of measurement for assessing soil compaction resulting from land management activities (Starr and Geist Citation1988). Bulk density is also considered as a dynamic property that changes with the structural condition of the soil which can be altered by farming, agricultural machinery and animal movement and weather (Arshad, Lowery, and Grossman Citation1996). According to Aşkın and Özdemir. (Citation2003), bulk density shows a positive relationship with sand and very fine sand content, a negative relationship with silt, clay and organic matter content. In general, bulk density increases with soil profile depth, due to changes in organic matter content, porosity, and compaction (Chaudhari et al. Citation2013). Again, these are considered in this study as the final suitability map was developed.
3.2. Analysis of land cover, NDVI, and topographic parameters
3.2.1. Normalized Vegetation Difference Index (NDVI)
The NDVI is computed from satellite reflectance measurements in the red and Near Infrared (NIR) portion of the spectrum (Kriegler et al. Citation1969; Rouse et al. Citation1973; Verhulst and Govaerts Citation2010) given as:
where is reflectance of near-infrared radiation and
is reflectance of visible red radiation.
Assessment of vegetation cover of the study area is very crucial in order to compare the vegetation greenness in the highly and Marginally Suitable maps of the study area. Basically, Highly Suitable regions tend to show high NDVI during the dry season cultivation of rice. Therefore, we need to see the relationships between the suitability map and current vegetation coverage of the study area. Extraction of NDVI pixels for our Region of Interest (ROI) gives values that range from -1 to +1. However, values equal or close to -1 are always considered as water bodies. According to Ayehu and Besufekad (Citation2015), NDVI values of +1 (0.8–0.9) indicate dense forests, >0.5 represents dense vegetation, 0.3–0.5 represents medium vegetation and 0.1–0.3 represents low vegetation. In this work, pixel values with annual mean were considered as non-vegetated and extracted from the data sets.
3.2.2. Spatial regression trend analysis between NDVI and climate parameters
The spatial regression slope equation a is given as:
where is predictor variables (temperature and precipitation) and x is response variable (NDVI).
3.3. Statistical analysis
Specifically, determination of weights for the selected map criteria is a basic requirement for employing the AHP method (Maddahi et al. Citation2014). Using Pairwise Comparison Matrix (PCM), criterion weights were calculated by comparing and contrasting two parameters together at a time. In determining weights (wi), first of all, every probable pairing was compared by rating relative importance of parameters on a 9-point rating scale and represented in a PCM according to Saaty’s method (Citation1980) described in . Further, the weighting for each criterion parameter (wi) was obtained by taking the eigen vector corresponding to the highest eigen value of the matrix with n criteria, and then normalizing the sum of the components to 1 as given in Equation (3) (Ayehu and Besufekad Citation2015) below:
Table 2. Scales for pair-wise AHP comparisons (Maddahi et al. Citation2014).
PCM and weights of all the parameters are given in . Furthermore, weights for all parameters computed by principal eigen vector sum to one (1) are also shown in . More so, in the use of the AHP method, the weights produced from the pairwise comparison matrix must be consistent. The Consistency Ratio (CR) is used to show the likelihood that the matrix decisions were generated randomly (Ayehu and Besufekad Citation2015) without bias.
Table 3. PCM of all the parameters relevant to rice crop land suitability for Benue State, Nigeria.
where CI is the Consistency Index and RI is the Random Index. RI is the average of the resulting consistency index depending on the number of criteria given by Saaty (Citation1977) (see ).
Table 4. Random index.
MCDM was achieved by Weighted Linear Combination in ArcMap 10.3.1, with additive weighting plan based on weighted average of the criteria. By multiplying weights to the proportion of each criteria and then adding the products over all attributes, the total score is obtained. In the final step, the constraint adjusts the procedure by multiplying the suitability calculated from the parameters by the product of the constraints (Naz and Rasheed Citation2017). In this way, the overlay capability of GIS permits determination of criterion maps into a final composite map based on the expert knowledge of the software according to Equation 6 (Masoud et al. Citation2013; Naz and Rasheed Citation2017) below:
Where: is the composite suitability score,
is the weight of each parameter
,
is the criterion score of parameter
, and
is the criterion score of constraint
.
3.4. Results validation and suitability map
The correlation coefficient, standard deviation and RMS between CRU gridded precipitation and NIMET Observation (in situ) precipitation data show 0.42, 108 and 110, respectively, while these three factors between CRU gridded temperature and NIMET Observation (in situ) temperature data show 0.88, 1.6 and 0.86, respectively, as reflected in ), ). The CRU data is interpolated at 0.5° × 0.5° grid using spline interpolation. The data sets have been validated and compared with other climatologies (New, Hulme, and Jones Citation1999).
Figure 4. Comparison between CRU gridded and NIMET Observation data for (a) Precipitation and (b) Temperature, (c) Seasonal relationship between CRU and Observation.
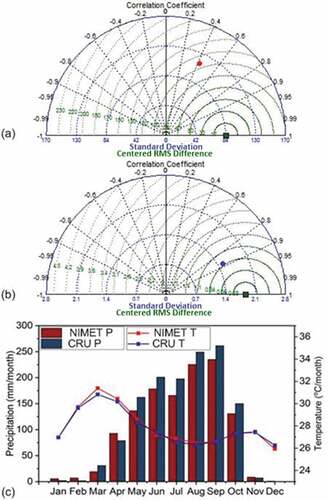
In terms of seasonal analysis, the CRU gridded temperature data agree better with the NIMET Observation temperature data than those of precipitation ()). Generally, both seasonal variations in CRU gridded temperature and precipitation data have agreed better with NIMET Observation (in situ) data sets than the yearly variation. Both CRU gridded data and NIMET Observation Precipitation are bimodal which is in agreement with previous studies (Nnamchi, Li., and Anyadike. Citation2011). However, there is a slight overestimation of CRU precipitation in wet months compared to dry months, while temperature drops abruptly during the start of season and July precipitation break, but rises during the end of season.
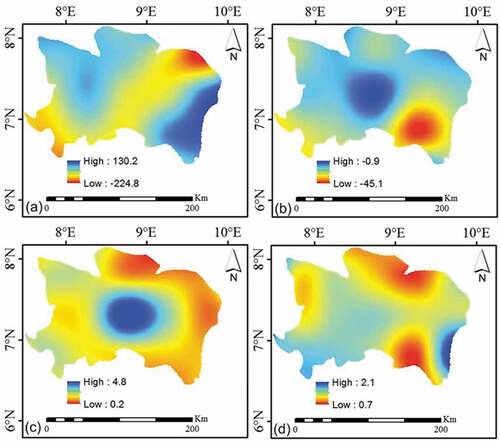
Results of the seasonal NDVI (1985 to 2015) are presented in showing that NDVI in Highly Suitable (S1) rice planting regions is higher than Suitable (S2) regions except for the months of October and November. Although the difference is not much owing to the location of the study area between 100–300 m elevation above sea level such that irrigation farming nourishes vegetation even after the rainy season. Also, NDVI shows bimodal seasonally in response to precipitation, meaning vegetation vigor is more dependent on precipitation than temperature. Additional analysis is provided for NDVI mean distribution across Benue State ()), and spatial regression trend between CRU temperature data and NDVI ()), and spatial regression trend between CRU precipitation data and NDVI ()). contains detailed results of the spatial regression between temperature and NDVI and between Precipitation and NDVI at Highly Suitable and Suitable regions across the study area with varying results between the regions and the parameters (positive, zero or negative trend). From , results show that the spatiotemporal changes in vegetation across Benue State in rice cultivation areas are substantially explained by precipitation variability than temperature. In the dry season (DJFMA), the regression between NDVI versus precipitation (Equation (2)) showed only negative trends in pixels over S1 and S2 regions while NDVI versus temperature trends showed only positive trends over S1 and S2 regions. Also, during the rainy season (MJJASON), the regression between NDVI versus precipitation trends showed 55.7% and 43.3% negative and positive pixels, respectively, over the S1 region. Only 1.0% pixels showed non-trend changes. Similarly, NDVI versus temperature trends indicated about 98.0% positive pixels, no pixel showed negative trend while 2.0% pixels showed no-trend changes over S1 regions. For S2 regions, NDVI versus precipitation trends showed 41.1% and 58.1% negative and positive pixels, respectively, during the rainy season. Only 0.8% pixels showed non-trend changes. Similarly, NDVI versus temperature trends indicated about 99.5% positive pixels, no pixel showed negative trend while 0.5% pixels showed non-trend changes during the rainy season. This is because precipitation is highly variable in space and time compared to air temperature over the study area. Thus, during dry season, there is decreased soil moisture due to the absence of rains. Both precipitation and temperature are sufficient over S1, S2 and S3 regions, and the only limiting factors are the soil physical and chemical properties.
Table 5. Summary of spatial regression results (change in pixels over study area).
Figure 5. Seasonal NDVI from 1985 to 2015.
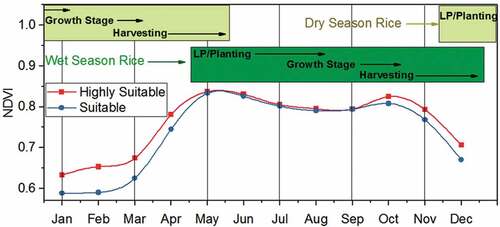
Figure 6. Spatial regression trend between (a) growing season NDVI and precipitation (mm/NDVI unit), (b) dry season NDVI and precipitation (mm/NDVI unit), (c) growing season NDVI and temperature (oC/NDVI unit), and (d) dry season NDVI and temperature (oC/NDVI unit) from 1985 to 2015.
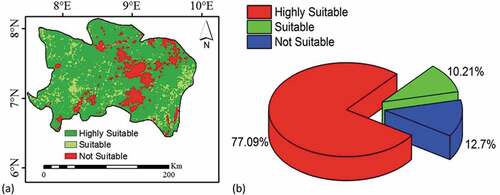
Therefore, from the study’s assessment, S1, S2, and NS areas indicated 77.1%, 10.2%, and 12.7% pixels representing about 24,264 km2, 3214 km2, and 3997 km2, respectively. The remaining percentage is covered by other bodies (rivers, streams, built-up areas, bareland, etc.). The Marginally Suitable S3 class is not visible in the final step because the area of land occupied by it was minimal compared to others, thus the resultant weight was negligible in other parameters, while for some it was completely absent as shown in . ) and ) reveals that there is actually a vast area of land across Benue State with high suitability for paddy cultivation of rice when the multiple criteria (temperature, precipitation, NDVI, landcover, slope, as well as the soil parameters studied) are applied. This is not the case when a paddy rice cultivation classification is done on the basis of the GLCNMO satellite data only as shown in ). In addition to the MCDM applied in this study, it is also possible that the changing land cover from forest to paddy (due to degradation by series of anthropogenic activities especially grazing and massive land clearance for cultivation) may have also accounted for some level of increase in paddy field land cover across the State.
Figure 7. Land suitability analysis for paddy field cultivation based on multi-criterion method, (b) percentage composition of the suitability classes.
Essentially, the critical contribution drawn from this study is in the ability to adapt in situ data in successfully de-validating the CRU data (mapped as ) using multiple physical environmental criteria (climate parameters, soil parameters, and vegetation status and land cover status) of the study area.
4. Conclusions
Rice, arguably one of the main staple crops of the region, is cultivated all year round during the very wet seasons, but in very few areas during the dry seasons. The general belief among farmers within the study area is that rice can largely be cultivated only during the rainy season. Generally, studies show that rainfall in Highly Suitable areas is usually >1000 mm, whereas in less suitable areas, the rainfall is <1000 mm (Samanta, Pal, and Pal Citation2011). Nonetheless, the study shows that even in the areas mapped as Highly Suitable within the study area, rice cultivation is not maximized. The same applies to areas considered with the suitable temperature conditions, from 20°C to 40°C according to Ayehu and Besufekad (Citation2015), given that rice is a tropical and sub-tropical crop.
The practical relevance of this study is hinged on four critical realities: The first one is the declining per capita land ownership due to land fragmentation as a result of increasing population. The second one is the unabated degradation of cultivable land due to poor farming practices. The third one is the rising farmers-farmers and herdsmen-farmers conflicts within the region as a result of competition for crop land and grazing land, respectively. And the fourth one is the need to improve food security, especially rice given that rice importation accounts for billions of dollars of Nigeria’s already insufficient foreign reserves. Collectively, these challenges have placed tremendous pressure on existing cultivable land within the study area. It is becoming increasingly imperative for a better assessment of land resources and maximal utilization in the face of the rising demand-led conflicts over land. Addressing these four listed challenges would significantly move the study area towards achieving the SDG Number 2 by 2030. This study is one of the several steps required to begin the process of implementing the SDGs at the local level.
It is however important to observe that the study did not include socio-economic criteria (population size and density, land tenure/ownership data, etc.) in the analysis. Going forward, this is a gap that can be filled by further studies seeking additional accuracy in the MCDM suitability assessment of rice mapping within the study area.
Additional information
Notes on contributors
Fanan Ujoh
Fanan Ujoh holds a PhD in Environmental Resources Planning from the University of Abuja, Nigeria. He is currently an Affiliate Member at the Center for Sustainability and Resilient Infrastructure and Communities (SaRIC), London South Bank University, London, UK. His research interest is in the application of geospatial analysis in resolving practical environmental problems in sub-saharan Africa.
Tertsea Igbawua
Tertsea Igbawua received his PhD at Insitute of Remote Sensing & Digital Earth, University of Chinese Academy of Sciences, Beijing, China. His research interests are in remote sensing image analysis, climate change, GIS, biogeography, spatial modelling & environmental hazards.
Moses Ogidi Paul
Moses Ogidi Paul is finalizing his PhD research at the Department of Geography and Environmental Management, University of Abuja. His research interest is in the area of geospatial applications to environmental degradation studies.
References
- Abach, R. O., and M. N. Ngigi. 2016. “Land Suitability Study for Rice Growing in Kisomu County.” International Journal of Geomatics and Geosciences 7 (1): 33–42.
- Adamgbe, E. M., and F. Ujoh. 2012. “Variations in Climatic Parameters and Food Crop Yields: Implications on Food Security in Benue State, Nigeria.” Confluence Journal of Environmental Studies 7: 59–67. http://www.journalhome.com/cjes/
- Adamgbe, E. M., and F. Ujoh. 2013. “Effect of Variability in Rainfall Characteristics on Maize Yield in Gboko, Nigeria.” Journal of Environmental Protection 4 (9): 881–887. doi:10.4236/jep.2013.49103.
- Adejuwon, J. 2006. "Food Security, Climate Variability and Climate Change in Sub Saharan West Africa: Assessments of Impacts and Adaptations to Climate Change (AIACC)" Washington D.C.: International START Secretariat.
- Ambarwulan, W., P. B. K. Santoso, S. Sabiham, and M. Hikmat. 2016. “Remote Sensing and Land Suitability Analysis to Establish Local Specific Inputs for Paddy Fields in Subang, West Java.” Environmental Sciences 33: 94–107.
- Arshad, M. A., B. Lowery, and B. Grossman. 1996. “Physical Tests for Monitoring Soil Quality.” In Methods for Assessing Soil Quality, edited by J. W. Doran and A. J. Jones, Soil Sci. Soc. Am. Spec. Publ. Vol. 49: 123–142.
- Arunrat, N., N. Pumijumnong, and R. Hatano. 2017. “Practices Sustaining Soil Organic Matter and Rice Yield in a Tropical Monsoon Region.” Soil Science and Plant Nutrition 63 (3): 274–287. doi:10.1080/00380768.2017.1323546.
- Aşkın, T., and N. Özdemir. 2003. “Soil Bulk Density as Related to Soil Particle Size Distribution and Organic Matter Content.” Agriculture 9 (2): 52–55.
- Ayehu, G. T., and S. A. Besufekad. 2015. “Land SuitabilityAnalysis for Rice Production: A GIS Based Multi-criteria Decision Approach.” American Journal of Geography Information System 4 (3): 95–104.
- Chaudhari, P. R., D. V. Ahire, V. D. Ahire, M. Chravarty, and S. Maity. 2013. “Soil Bulk Density as Related to Soil Texture, Organic Matter Content and Available Total Nutrients of Combative Soil.” International Journal of Scientific and Research Publications 3 (2): 1–8.
- Dengiz, O. 2013. “Land Suitability Assessment for Rice Cultivation Based on GIS Modeling.” Turkish Journal of Agriculture and Forestry 37 (3): 326–334. doi:10.3906/tar-1206-51.
- Elaalem, M. 2010. “The Application of Land Evaluation Techniques in Jeffara Plain in Libya Using Fuzzy Methods.” PhD diss., University of Leicester. 1–248.
- Federal Office of Statistics. 2009. Review of the Nigerian Economy 2009. Abuja: Federal Office of Statistics.
- Foth, H. D. 1990. Fundamentals of Soil Sciences. Toronto: John Wiley & Sons.
- Giri, S., and A. P. Nejadhashemi. 2014. “Application of Analytical Hierarchy Process for Effective Selection of Agricultural Best Management Practices.” Journal of Environmental Management 132: 165–177. doi:10.1016/j.jenvman.2013.10.021.
- Kihoro, J., N. J. Bosco, and H. Murage. 2013. “Suitability Analysis for Rice Growing Sites Using a Multicriteria Evaluation and GIS Approach in Great Mwea Region, Kenya.” Springerplus 2 (265): 1–9. doi:10.1186/2193-1801-2-265.
- Kriegler, F. J., W. A. Malila, R. F. Nalepka, and W. Richardson. 1969. “Preprocessing Transformations and Their Effects on Multispectral Recognition.” In: Proceedings of the Sixth International Symposium on Remote Sensing of Environment. Ann Arbor, MI: University of Michigan. October 13–16. 97–131
- Maddahi, Z., A. Jalalian, M. M. Kheirkhan Zarkesh, and N. Honarjo. 2014. “Land Suitability Analysis for Rice Cultivation Using Multi-Criteria Evaluation Approach and GIS.” European Journal of Experimental Biology 4 (3): 639–648.
- Mahmood, N., B. Ahmad, S. Hassan, and B. Khuda. 2012. “Impact of Temperature ADN Precipitation on Rice Productivity in Rice-wheat Cropping System of Punjab Province.” Journal of Animal and Plant Sciences 22 (4): 993–997.
- Masoud, J., W. A. Agyare, G. Forkuor, R. Namara, and E. Ofori. 2013. “Modelling Inland Valley Suitability for Rice Cultivation.”.” ARPN Journal of Engineering and Applied Sciences 8 (1): 9–19.
- Moglen, G. E., and D. R. Maidment. 2005. Digital Elevation Model Analysis and Geography Information Systems. Anderson, M.G. (ed). New York: John Wiley & Sons.
- Naz, A., and H. Rasheed. 2017. “Modeling the Rice Land Suitability Using GIS and Multi-CriteriaDecision Analysis in Sindh, Pakistan.” Journal of Applied Sciences 13: 26–33.
- New, M., M. Hulme, and P. D. Jones. 1999. “Representing Twentieth Century Space-time Climate Variability. Part 1: Development of a 1961–1990 Mean Monthly Terrestrial Climatology.” Journal of Climate 12: 829–856. doi:10.1175/1520-0442(1999)012<0829:RTCSTC>2.0.CO;2.
- Nnamchi, H. C., J. Li., and R. N. C. Anyadike. 2011. “Does a Dipole Mode Really Exist in the South Atlantic Ocean?” Journal of Geophysical Research Atmospheres 116: 1–15. doi:10.1029/2010JD015579.
- Olaleye, A. O., G. E. Akinbola, V. M. Marake, S. F. Molete, and B. Mapheshoane. 2008. “Soil in Suitability Evaluation for Irrigated Lowland Rice Culture in Southwestern Nigeria: Management Implications for Sustainability.” Communications in Soil Science and Plant Analysis 39 (19–20): 2920–2938. doi:10.1080/00103620802432824.
- Perveen, M. F., R. Nagasawa, A. O. C. Ahmed, M. I. Uddin., and R. Kimura. 2008. “Integrating Biophysical and Socioeconomic Data Using GIS for Land Evaluation of Wheat Cultivation: A Case Study in North-west Bangladesh.” Journal of Food, Agriculture & Environment 6: 432–437.
- Qin, Z., Y. Huang, and Q. Zhuang. 2013. “Soil Organic Carbon Sequestration Potential of Cropland in China.” Global Biogeochem. Cycles 27: 711–722. doi:10.1002/gbc.20068.
- Rouse, J. W., R. H. Haas, J. A. Schell, and D. W. Deering. 1973. “Monitoring Vegetation Systems in the Great Plains with ERTS”. In: Third ERTS Symposium, December 10–14, Washington DC: NASA SP-351 I.
- Saaty, T. L. 1977. “A Scaling Method for Priorities in Hierarchical Structure.” Journal of Mathematical Psychology 15 (3): 34–39. doi:10.1016/0022-2496(77)90033-5.
- Saaty, T. L. 1980. The Analytical Hierarchy Process. New York: McGraw Hill.
- Samanta, S., B. Pal, and D. K. Pal. 2011. “Land Suitability Analysis for Rice Cultivation Based on Multi-criteria Decision Approach through GIS.” International Journal of Science & Emerging Technologies 2 (1): 12–20.
- Singha, C., and K. C. Swain. 2016. “Land Suitability Evaluation Criteria for Agricultural Crop Selection: A Review.” Agricultural Reviews 37 (2): 125–132. doi:10.18805/ar.v37i2.10737.
- Sonon, L. S., D. E. Kissel, and U. Saha. 2014. Cations Exchange Capacity and Base Saturation. Extension Circular 1040: 1–4. Athens: University of Georgia. https://secure.caes.uga.edu/extension/publications/files/pdf/C%201040_1.PDF.
- Starr, G. L., and J. M. Geist 1988. “Soil Bulk Density and Soil Moisture Calculated with a FORTRAN 77 Program”. Gen. Tech. Rep. PNW-GTR-211. Portland, OR: U.S. Department of Agriculture, Forest Service, Pacific Northwest Forest and Range Experiment Station.
- Sun, Y., S. Huang, X. Yu, and W. Zhang. 2013. “Stability and Saturation of Soil Organic Carbon in Rice Fields: Evidence from a Long Term Fertilization Experiment in Subtropical China.” Journal of Soils and Sediments 13: 1327–1334. doi:10.1017/s11368-013-0741-z.
- Tateishi, R., M. A. Bayaer, H. Ghar, H. Al-Bilbisi, J. Tsendayush, A. Shalaby, A. Kasimu, et al. 2008. “A New Global Land Cover Map, GLCNMO.” The International Archives of the Photogrammetry, Remote Sensing and Spatial Information Sciences 37 (Part B7): 1369–1372.
- Tomasic, M., Z. Zgopelec, A. Jurisic, and I. Kisic. 2013. “Cation Exchange Capacity of Dormant Soil Types in the Republic of Croatia.” Journal of Central European Agriculture 14 (3): 937–951. doi:10.5513/JCEA01/14.3.1286.
- Toz, G., and M. Erdogan. 2008. “DEM (digital Elevation Model) Production and Accuracy Modeling of DEMs from 1:35:000 Scale Aerial Photographs.” International Archives of Photogrammetry, Remote Sensing & Spatial Information Sciences 37 (part B1): 775–780.
- Tucker, C. J., J. E. Pinzon, M. E. Brown, D. A. Slayback, E. W. Pak, R. Mahoney, E. F. Vermote, and N. El Saleous. 2005. “An Extended AVHRR 8-km NDVI Dataset Compatible with MODIS and SPOT Vegetation NDVI Data.” International Journal of Remote Sensing 26: 4485–4498. doi:10.1080/01431160500168686.
- Ujoh, F. 2013. “Assessment of Environmental Impact of Limestone Mining and Cement Production at Yandev, Central Nigeria.” Ph.D Thesis, University of Abuja, Nigeria.
- Umweni, A. S., and A. O. Ogunkunle. 2014. “Comparison of the Suitability of a 200 Ha Land for Rice Cultivation by Three ‘native’ Techniques in Southern Nigeria.” IOSR Journal of Agriculture & Veterinary Science 7 (2): 91–101. doi:10.9790/2380-072191101.
- USDA (United State Department of Agriculture). 2014. “Natural Resources Conservation Service: Soil.” https://www.nrcs.usda.gov/wps/portal/nrcs/detail/soils/survey/tools/?cid=nrcs142p2_053550
- USDA (United States Department of Agriculture)-NRCS (National Resources Conservation Service). 1998. “Soil Quality Information Sheet”. Soil Quality Institute, NRCS, USDA, and the National Soil Tilth Laboratory, Agricultural Research Service, USDA. https://www.nrcs.usda.gov/Internet/FSE_DOCUMENTS/nrcs142p2_052208.pdf
- Verhulst, N., and B. Govaerts. 2010. “The Normalized Difference Vegetation Index (NDVI) GreenSeekerTM Handheld Sensor: Toward the Integrated Evaluation of Crop Management.” Part A: Concepts and case studies. Mexico, D.F.: CIMMYT.
- Yin, H., T. Udelhoven, R. Fensholt, D. Pflugmacher, and P. C. Hostert. 2012. “How Normalized Difference Vegetation Index (NDVI) Trends from Advanced Very High Resolution Radiometer (AVHRR) and Systeme Probatoire D’ Observaion De La Terre Vegetation (SPOT VGT) Time Series Differ in Agricultural Areas: An Inner Mongolian Case Study.” Remote Sensing 4: 3364–3389. doi:10.3390/rs4113364.