
ABSTRACT
Geoportals have been the primary source of spatial information to researchers in diverse fields. Recent years have seen a growing trend to integrate spatial analysis and geovisual analytics inside Geoportals. Researchers could use the Geoportal to conduct basic analysis without offline processing. In practice, domain-specific analysis often requires researchers to integrate heterogeneous data sources, leverage new statistical models, or build their own customized models. These tasks are increasingly being tackled with open source tools in programming languages such as Python or R. However, it is unrealistic to incorporate the numerous open source tools in a Geoportal platform for data processing and analysis. This work provides an exploratory effort to bridge Geoportals and open source tools through Python scripting. The Geoportal demonstrated in this work is the Urban and Regional Explorer for China studies. A python package is provided to manipulate this platform in the local programming environment. The server side of the Geoportal implements a set of service endpoints that allows the package to upload, transform, and process user data and seamlessly integrate them into the existing datasets. A case study is provided that illustrated the use of this package to conduct integrated analyses of search engine data and baseline census data. This work attempts a new direction in Geoportal development, which could further promote the transformation of Geoportals into online analytical workbenches.
1. Introduction
Spatial data analysis has become increasingly popular in a wide array of social science disciplines, including public health, economics, crime, population, etc. Geoportals are the standardized ways for researchers to retrieve spatial datasets. Typically, these Geoportals also provide various functions for users to explore and analyze the data online. The past decade has seen growing interests and many successful applications in leveraging the spatial dimension in big data sources such as social media (Adam, Shafiq, and Staffin Citation2012; Shelton, Poorthuis, and Zook Citation2015), Wikipedia (Geiß et al. Citation2015; Hoffart et al. Citation2013), and mobile data (Gao et al. Citation2013; Hawelka et al. Citation2014; Louail et al. Citation2014). The availability of new data sources has greatly stimulated the development and implementation of spatial analysis packages in the open source world (Anselin Citation2010, Citation2012; Rey et al. Citation2015). However, how to better harness the power of open source tools that handles heterogeneous big data sources remains a major challenge for the developers in building Geoportal applications. Faced with such challenges, researchers are beginning to focus more on how to integrate other tools into existing platforms.
Geoportals are successful in linking multisource data, but it is unrealistic to integrate the growing list of open source tools in one place. A Geoportal has to be flexible in integrating user’s data and third-party analytical functions in order to become a workbench, where users could process and model the data simultaneously. Compared with desktop GIS software which is often prepared for professional GIS users, Geoportals that links with open source tools could provide a very useful and lightweight workspace for researchers that don’t have adequate knowledge in GIS, especially in the area of spatial social science.
The integration of open source tools allows easier integration of big data sources. Geoportals normally include baseline data such as censuses and surveys. For example, census data, such as population census, have always been the primary sources for spatial studies. These data are designed to be comprehensive and standardized, and also have good quality control. However, census data are often outdated, but timely information is critical for decision support in many applications. While census data provide the baseline information, big data sources such as internet data, social media provide more timely and diverse information. The integration of census data and big data could give researchers the ability to explore data from different perspectives and generate new and interesting research questions. (Husain et al. Citation2015; Luo et al. Citation2016; Steiger et al. Citation2015). Unlike census data, most big data sources are not designed for later use, especially in the research contexts. These data are usually unstructured, non-spatial, and non-numerical data. For example, internet data do not follow a unified standard during the collection phase and can contain noise (Fan, Han, and Liu Citation2014; Gandomi and Haider Citation2015). This makes it difficult to integrate these heterogeneous datasets directly into an existing Geoportal. There have been some efforts in this direction, but this typically relies on developers to add special functions to process and link the data. However, it is not possible and unrealistic for a platform developer to integrate all these big data sources. Oftentimes, these big data sources need to be preprocessed tailored to specific research needs. Researchers have increasingly relied on open source tools to process these data, and it is also unrealistic to integrate these diverse tools into a Geoportal.
It could be more flexible and decoupled if researchers could leverage open source tools to process the data, and seamlessly interact with the Geoportal to integrate, visualize, analyze the data. This work tries to provide an early attempt in this direction. We aim to bridge open source tools and Geoportals through a set of services that supports data manipulation and a client-side library that allows users to operate the Geoportal from the programming environment. A case study is illustrated in detail that generates new datasets from search engine results for the integrated analysis of internet data and baseline census data. The next section gives a literature review of related works. Section 3 discusses the architecture and workflow of the PyGeoexplorer library and the service specification implemented by the Geoportal. Section 4 presents a case study based on the proposed methods and tools. Section 5 summarized the work and outlines future trends.
2. Literature
Early versions of online spatial systems focus mostly on publishing individual maps (Frew and Bose Citation2001). With the rapid growth of spatial datasets released through open APIs in recent years, the demand for online spatial data services has also significantly increased. Geoportals have emerged in both academic communities and commercial applications. However, due to considerations in privacy and system performance, most systems still use their own ways of integrating and managing spatial data (Sinnott, Galang, Tomko and Stimson Citation2011). A Geoportal generally consists of a series of services, such as generating reports, thematic mapping, and exploratory spatial data analysis. Underlying the services, Geoportals provide unified integration of multi-source heterogeneous data. In addition, Geovisual analytics have become an essential part of Geoportals (Andrienko et al. Citation2010), where researchers could interactively explore and analyze spatial data online. The past decade has seen such Geoportals developed in diverse fields including urban planning, public health, and ecology (Anselin, Kim, and Syabri Citation2004; MacEachren et al. Citation2008; Maguire and Longley Citation2005; Yang et al. Citation2010). The popularization of commercial platforms such as Mapbox and Carto in recent years have also proved the growing importance of map-based services in business applications.
The popularization and application of spatial analysis are largely accredited to the rapid development of open source software in spatial analysis (Steiniger and Hunter Citation2013). The software are written in different languages over the last several decades as standalone programs (Bivand Citation2011). These include SpaceStat (Anselin Citation1991), GeoDa (Anselin, Syabri, and Kho Citation2006), GeoVista (Takatsuka and Gahegan Citation2002), etc. In recent years, the rise of scripting languages such as R and Python has made the developments of data analysis methods more straightforward. The development of open source spatial packages have also proliferated (Rey Citation2009; Shao et al. Citation2012). There are also diverse open source packages for processing big data sources such as bs4 for pulling data from the web, and Tweepy for accessing Twitter data. These open source packages have become the basis for spatial applications and the driving forces for developments of new spatial models and algorithms. Researchers in WebGIS and Geoportal developers, in general, have realized the importance of online spatial analysis. A lot of efforts have been put in providing integrated data and analytical functions within the Geoportal environment, which essentially transform the Geoportal into an online workbench. For example, the AURIN spatial cyber infrastructure provides a set of online analytical tools (Tomko et al. Citation2019). GeoDa-web is a web-based platform that allows users to invoke GeoDa functions in an online environment (Li, Anselin, and Koschinsky Citation2015). The Urban and Regional Explorer (She, Zhu, and Bao Citation2011; Zhu et al. Citation2015) provides a set of functions that integrate functions in C++, R, and PySAL for integrated spatial analysis. The tools available in the open source community are growing at an unprecedented rate, and oftentimes researchers have to leverage other tools to process data into the spatial format, such as unstructured, non-spatial, and non-numerical data. On the other hand, researchers often need to write some customized routines extending open source packages to process and analyze the data. However, there lacks a way for researchers to integrate the data into a Geoportal and leverage the analysis functions in a Geoportal for integrated analysis. This work allows the researchers to leverage the tools in the open source world while taking advantage of the baseline data and services provided by a Geoportal at the same time.
3. Architecture
The Geoportal used in this work is built on top of the Urban and Regional Explorer (URE) for China studies. This platform integrates baseline census and statistical data at different administrative levels, including population censuses, economic censuses, enterprise data, night-light remote sensing data, and land use data. These data are from official sources including the National Bureau of Statistics of China and the National Geomatics Center of China. The data have been adjusted to the base maps to be comparable across time and space. The platform integrates data from databases, WFS layers, and user-uploaded datasets in the form of virtual layers (Zhu et al. Citation2015). A virtual layer provides a unified and standardized service for client applications and other services in the Geoportal, allowing end-users to explore and analyze multi-source data as if operating a single table. shows the architecture of URE consisting of three layers: the service layer, the processing layer, and the data integration layer. The service layer includes a set of services for both the Geoportal client application and third-party applications, such as requesting data, transforming data, uploading user data, and data analytics, etc. The processing layer is responsible for various Geoportal modules such as reporting and thematic mapping. The data integration layer is responsible for managing multi-source data from spatial databases, OGC-compliant mapping services, and user-uploaded datasets.
Figure 1. Urban and regional explorer architecture.
The URE system is an integrated system for spatial data and services. Different from spatial data analysis software such as GeoDA and GeoVISTA, the URE aims to provide an online environment where users could browse and analyze data at the same time. The processing layer of URE includes a set of modules for integrated spatial analytics that take advantage of both open source tools and customized spatial functions. This includes Exploratory Data Analysis (EDA), Exploratory Spatiotemporal Data Analysis (ESDA), spatial regression analysis, etc. Though these functions are not as powerful as specialized spatial analysis software, we hope they provide a convenient way for users to conduct preliminary data analysis without downloading the data. Specifically, The ESDA module is built on top of PySAL (Sergio J Rey and Anselin Citation2010), which include a set of spatial autocorrelation measures such as LISA, Geary’s C, etc. The spatial regression models, including the spatial lag model, spatial error model, and geographically weighted model, are built on top of spatial packages in R. Other customized models include geographical gravity model, MicroMap, etc. Each analytic module has also a visualization component in the Geoportal client side, which provides the interactive visualization of the analytical results through dynamic maps and statistical charts.
The Python package PyGeoExplorer is a small wrapper library that allows end-users to interact with URE through Python programs. A series of endpoints are defined in the service layer of the URE side which allows users to upload data after local processing. Currently, areal and point data are supported. The areal data could be directly uploaded and stored in a database of user data, while the point data are first uploaded to Geoportal and then aggregated into a designated administrative level. The URE integrates the user-uploaded data into the virtual layers. This design allows the client application to operate on multiple attributes from a virtual layer, irrespective of whether the attributes are from the same sources or not. For example, after researchers upload a dataset, they could conduct regression analyses that use both the baseline data and the dataset just uploaded.
The PyGeoExplorer relies on several external libraries for browser interaction. The selenium and selenium-requests packages are used to automate the process of starting GeoExplorer in the browser and establish the session. The GeoJSON package is used for reading and parsing GeoJSON data. The required Python version is 2.7.9 or higher. displays the basic structure of the PyGeoExplorer package. The login, start, and exit functions are the control functions to establish connections to the Geoportal. The upload, and download_user_data_template, spatial_join, download_data functions connect to the service endpoints of the Geoportal for the data analysis process.
Figure 2. PyGeoExplorer architecture.
4. Case study
This section presents a case study that demonstrates the integration of search engine data and baseline census data. It demonstrates how new attributes could be generated from the Python programming and uploaded into the Geoportal for integrated analysis. Researchers could use it as templates for building more complex case studies such as web crawling or retrieving data from open government data.
Measuring the relatedness between spaces is an important task in geographical information retrieval and geospatial semantics. Internet data that are related to locations are mostly stored in unstructured, unclassified, non-spatial, and non-numeric forms. Recent years have seen a growing trend to infer the relationships from big data sources such as web pages (Liu et al. Citation2014). For search engine data, a straightforward approach is to compare the number of pages for a given place name (Lin and Li Citation2015). It is also referred to as focused crawling (Ahlers and Boll Citation2008).
The approach to measure relatedness between place names could be extended to measure the relatedness between an arbitrary search term with a place name. For example, we could use the search term “金融”(finance), and combine it with province names such as “上海 金融”(Shanghai finance), or “浙江 金融”(Zhejiang finance). These query combinations are then sent to search engines such as Baidu. The search engines will return the results as HTML pages. The information regarding the number of pages is embedded in the webpage, typically within a < DIV> tag. Pseudocode 1 shows the python script which corresponds to the following steps:
Initialize the PyGeoexplorer object and a driver object from the seleniumrequests library (e.g. Chrome or Firefox);
Download the user data template as XLS format from PyGeoexplorer at a particular administrative level (e.g. province)
Read the template file, iterate through the province names
Construct the query for a combination of the province name and the search term. For example, for the combination of Shanghai and finance, the query would be http://www.baidu.com/s?wd=上海%20金融
Use the get method in the driver to launch a request to the search engine
Locate and extract the HTML element using the find_element_by_class_name method
Using regular expression to extract the actual number from the element. Step 5 and 6 requires careful analysis about the structure of the HTML page returned by the search engine
Write the number to the xls file
Start the GeoExplorer platform
Upload the xls file to the platform
Pseudocode 1. Example of the Python script for search engine data integration.
After the data is uploaded, a browser will be opened in the researcher’s desktop and the uploaded data will be available for integrated analysis. shows the snapshots of users doing thematic mapping using the search term “金融”(finance) of the Baidu search engine for all provinces in mainland China. This map could potentially reflect the popularity of the search term in each province. We can generate reports in URE as shown in , and run spatial analysis such as the gravity model in .
Figure 3. Thematic maps of the search term “金融”(finance) in the Baidu search engine.
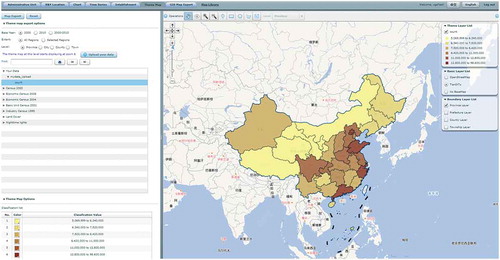
Figure 4. Integrated reporting using search engine data and baseline data in URE.
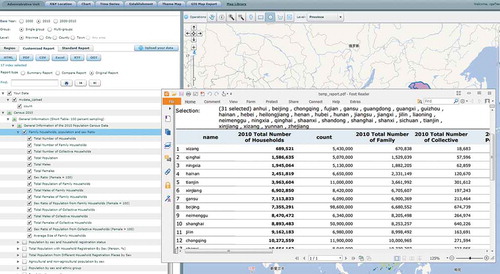
Figure 5. Gravity model analysis of search engine data in URE.
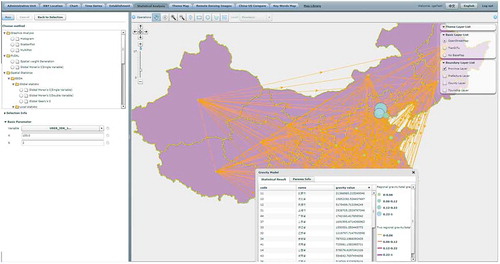
The spatial patterns shown in the maps raise more questions worthy of further investigations. For example, why the value in Beijing is nearly twice as large as the value in Shanghai, and why Qinghai has the lowest value? These unexpected questions reflect the value of the proposed approach: big data sources are inherently noisy. Researchers need to compare data from different search engines, together with the baseline census data at different scales. Furthermore, the search pages returned by the search engine could be categorized and modeled. Open source environments such as Python, combined with existing Geoportal functions, provides a more complete toolset for such iterative process of scientific investigations.
5. Conclusion
This work demonstrates a flexible way to bridge the Geoportal and the open source tools in the Python environment. The PyGeoExplorer package, together with the service endpoints in the platform, provide researchers the ability to write their own scripts to process and integrate data with the baseline data in the Geoportal. The case study illustrates a simple yet flexible way to leverage open source packages to process data locally and then conduct integrated analysis in the Geoportal. Extending Geoportals are usually done by exposing services as APIs to researchers and developers. This work takes this direction one step further, which make the Geoportal as a workbench that could be manipulated from the Python environment, thus making it more straightforward to integrate and analyze data. Future work will investigate the design of an RGeoExplorer package, which would bridge the Geoportal to a diverse array of statistical packages in R. Furthermore, despite sharing the data, case studies written by the researchers could also be shared and executed in the Geoportal. This could be implemented through a standardized mechanism such as Jupyter notebooks that bundles documentation and code. The sharing of case studies together with the relevant data could promote more repeatable and reproducible research in the spatial communities.
Additional information
Notes on contributors
Bing She
Bing She receeived PhD in cartography and geographic information engineering from Wuhan Unviersity. His research interests include spatial data integration and CyberGIS.
Tao Hu
Tao Hu receeived PhD in cartography and geographic information engineering from Wuhan Unviersity. His research interests include spatial data anlaysis and innovation studies.
Xinyan Zhu
Xinyan Zhu receeived PhD in photogrammetry and remote sensing from Wuhan Unviersity. His research interests are spatiotemporal data analysis and spatial databases.
Shuming Bao
Shuming Bao receeived PhD in applied economics from Clemson University, United States. His research interests are regional economics and spatial statistics.
References
- Adam, N. R., B. Shafiq, and R. Staffin. 2012. “Spatial Computing and Social Media in the Context of Disaster Management.” IEEE Intelligent Systems 27 (6): 90–96. doi:10.1109/MIS.2012.113.
- Ahlers, D., and S. Boll. 2008. “Urban Web Crawling.” Proceedings of the first international workshop on Location and the web, Beijing, China, April 22.
- Andrienko, G., N. Andrienko, U. Demsar, D. Dransch, J. Dykes, S. I. Fabrikant, M. Jern, M. J. Kraak, H. Schumann, and C. Tominski. 2010. “Space, Time and Visual Analytics.” International Journal of Geographical Information Science 24 (10): 1577–1600. doi:10.1080/13658816.2010.508043.
- Anselin, L. 1991. “SpaceStat, a software program for analysis of spatial data.” Technical report. Santa Barbara: National Center for Geographic Information and Analysis (NCGIA), University of California.
- Anselin, L. 2010. “Thirty Years of Spatial Econometrics.” Papers in Regional Science 89 (1): 3–25. doi:10.1111/pirs.2010.89.issue-1.
- Anselin, L. 2012. “From SpaceStat to CyberGIS: Twenty Years of Spatial Data Analysis Software.” International Regional Science Review 35 (2): 131–157. doi:10.1177/0160017612438615.
- Anselin, L., I. Syabri, and Y. Kho. 2006. “GeoDa: An Introduction to Spatial Data Analysis.” Geographical Analysis 38 (1): 5–22. doi:10.1111/gean.2006.38.issue-1.
- Anselin, L., Y. W. Kim, and I. Syabri. 2004. “Web-based Analytical Tools for the Exploration of Spatial Data.” Journal of Geographical Systems 6 (2): 197–218. doi:10.1007/s10109-004-0132-5.
- Bivand, R. 2011. “Geocomputation and Open Source Software: Components and Software Stacks.” NHH Dept. Of Economics Discussion Paper 23.
- Fan, J., F. Han, and H. Liu. 2014. “Challenges of Big Data Analysis.” National Science Review 1 (2): 293–314. doi:10.1093/nsr/nwt032.
- Frew, J., and R. Bose. 2001. “Earth System Science Workbench: A Data Management Infrastructure for Earth Science Products.” Proceedings Thirteenth International Conference on Scientific and Statistical Database Management. SSDBM 2001, 180–189. Fairfax, VA, USA, August.
- Gandomi, A., and M. Haider. 2015. “Beyond the Hype: Big Data Concepts, Methods, and Analytics.” International Journal of Information Management 35 (2): 137–144. doi:10.1016/j.ijinfomgt.2014.10.007.
- Gao, S., Y. Liu, Y. Wang, and X. Ma. 2013. “Discovering Spatial Interaction Communities from Mobile Phone Data.” Transactions in GIS 17 (3): 463–481. doi:10.1111/tgis.12042.
- Geiß, J., A. Spitz, J. Strötgen, and M. Gertz. 2015. “The Wikipedia Location Network: Overcoming Borders and Oceans.” Proceedings of the 9th workshop on geographic information retrieval, Paris, France, November 26–27.
- Hawelka, B., I. Sitko, E. Beinat, S. Sobolevsky, P. Kazakopoulos, and C. Ratti. 2014. “Geo-located Twitter as Proxy for Global Mobility Patterns.” Cartography and Geographic Information Science 41 (3): 260–271. doi:10.1080/15230406.2014.890072.
- Hoffart, J., F. M. Suchanek, K. Berberich, and G. Weikum. 2013. “YAGO2: A Spatially and Temporally Enhanced Knowledge Base from Wikipedia.” Artificial Intelligence 194: 28–61. doi:10.1016/j.artint.2012.06.001.
- Husain, S. S., A. Kalinin, A. Truong, and I. D. Dinov. 2015. “SOCR Data Dashboard: An Integrated Big Data Archive Mashing Medicare, Labor, Census and Econometric Information.” Journal of Big Data 2 (1): 13. doi:10.1186/s40537-015-0018-z.
- Li, X., L. Anselin, and J. Koschinsky. 2015. “GeoDa Web: Enhancing Web-based Mapping with Spatial Analytics.” In Proceedings of the 23rd SIGSPATIAL International Conference on Advances in Geographic Information Systems, 94. Seattle, Washington, November 3–6.
- Lin, J., and X. Li. 2015. “Simulating Urban Growth in a Metropolitan Area Based on Weighted Urban Flows by Using Web Search Engine.” International Journal of Geographical Information Science 29 (10): 1721–1736. doi:10.1080/13658816.2015.1034721.
- Liu, Y., F. Wang, C. Kang, Y. Gao, and Y. Lu. 2014. “Analyzing Relatedness by Toponym Co-Occurrences on Web Pages.” Transactions in GIS 18: 89–107. doi:10.1111/tgis.2014.18.issue-1.
- Louail, T., M. Lenormand, O. G. C. Ros, M. Picornell, R. Herranz, E. Frias-Martinez, J. J. Ramasco, and M. Barthelemy. 2014. “From Mobile Phone Data to the Spatial Structure of Cities.” Scientific Reports 4: 5276. doi:10.1038/srep05276.
- Luo, F., G. Cao, K. Mulligan, and X. Li. 2016. “Explore Spatiotemporal and Demographic Characteristics of Human Mobility via Twitter: A Case Study of Chicago.” Applied Geography 70: 11–25. doi:10.1016/j.apgeog.2016.03.001.
- MacEachren, A. M., S. Crawford, M. Akella, and G. Lengerich. 2008. “Design and Implementation of a Model, Web-based, GIS-Enabled Cancer Atlas.” The Cartographic Journal 45: 246–260. doi:10.1179/174327708X347755.
- Maguire, D. J., and P. A. Longley. 2005. “The Emergence of Geoportals and Their Role in Spatial Data Infrastructures.” Computers, Environment and Urban Systems 29: 3–14. doi:10.1016/S0198-9715(04)00045-6.
- Rey, S. J. 2009. “Show Me the Code: Spatial Analysis and Open Source.” Journal of Geographical Systems 11: 191–207. doi:10.1007/s10109-009-0086-8.
- Rey, S. J., and L. Anselin. 2010. “PySAL: A Python Library of Spatial Analytical Methods.” In Handbook of Applied Spatial Analysis, edited by M. M. Fischer and A. Getis. 175–193. Berlin, Heidelberg: Springer.
- Rey, S. J., L. Anselin, X. Li, R. Pahle, J. Laura, W. Li, and J. Koschinsky. 2015. “Open Geospatial Analytics with PySAL.” ISPRS International Journal of Geo-Information 4: 815–836. doi:10.3390/ijgi4020815.
- Shao, J., G. Kuk, S. Anand, J. G. Morley, M. J. Jackson, and T. Mitchell. 2012. “Mapping Collaboration in Open Source Geospatial Ecosystem.” Transactions in GIS 16: 581–597. doi:10.1111/j.1467-9671.2012.01305.x.
- She, B., X. Zhu, and S. Bao. 2011. “June. Urban and Regional Explorer with Spatial Intelligence.” 2011 19th International Conference on Geoinformatics, Shanghai, China, June 24–26.
- Shelton, T., A. Poorthuis, and M. Zook. 2015. “Social Media and the City: Rethinking Urban Socio-spatial Inequality Using User-generated Geographic Information.” Landscape and Urban Planning 142: 198–211. doi:10.1016/j.landurbplan.2015.02.020.
- Sinnott, R. O., G. Galang, M. Tomko, and R. Stimson 2011. "Towards an e-infrastructure for urban research across Australia." 2011 IEEE Seventh International Conference on eScience, 295–302. Stockholm, Sweden. doi:10.1109/eScience.2011.48
- Steiger, E., R. Westerholt, B. Resch, and A. Zipf. 2015. “Twitter as an Indicator for Whereabouts of People? Correlating Twitter with UK Census Data.” Computers, Environment and Urban Systems 54: 255–265. doi:10.1016/j.compenvurbsys.2015.09.007.
- Steiniger, S., and A. J. Hunter. 2013. “The 2012 Free and Open Source GIS Software map–A Guide to Facilitate Research, Development, and Adoption.” Computers, Environment and Urban Systems 39: 136–150. doi:10.1016/j.compenvurbsys.2012.10.003.
- Takatsuka, M., and M. Gahegan. 2002. “GeoVISTA Studio: A Codeless Visual Programming Environment for Geoscientific Data Analysis and Visualization.” Computers & Geosciences 28: 1131–1144. doi:10.1016/S0098-3004(02)00031-6.
- Tomko, M., G. Galang, C. Bayliss, J. Koetsier, P. Greenwood, W. Voorsluys, D. Mannix, et al. 2019. “Designing Adaptable Spatial Cyberinfrastructure for Urban eResearch.” In CyberGIS for Geospatial Discovery and Innovation, edited by S. Wang and M. F. Goodchild. 53–69. Dordrecht: Springer.
- Yang, C., R. Raskin, M. Goodchild, and M. Gahegan. 2010. “Geospatial Cyberinfrastructure: Past, Present and Future.” Computers, Environment and Urban Systems 34: 264–277. doi:10.1016/j.compenvurbsys.2010.04.001.
- Zhu, X., B. She, W. Guo, S. Bao, and D. Chen. 2015. “Integrating Spatial Data Linkage and Analysis Services in a Geoportal for C Hina Urban Research.” Transactions in GIS 19: 107–128. doi:10.1111/tgis.2015.19.issue-1.