
ABSTRACT
Ensuring healthy lives and promoting well-being for all ages is the 3rd Sustainable Development Goal (SDG). Inequality in access to health care remains one of the primary challenges in achieving the goal. With the ever-increasing expansion of urban areas and population growth, there is a need to regularly examine the pattern of accessibility of basic amenities across regions, States and urban areas. This study examined geographic access to Primary Health Care Facilities (PHCF) in Nigeria using the combination of open data and geospatial analysis techniques. Thus, showcasing an approach can be replicated across different regions in Sub-Saharan Africa due to issues of information gap. Data on elevation, location of health care facilities, population and network data were utilised. The result shows that PHCF aggregate at certain locations, e.g. major urban agglomerations, and transit route leading to these places. High concentrations are found in the capital city. The average travel time to the nearest PHCF is about 14 min (Standard Deviation ±13.30 min) while the maximum is about 2 hours. Pockets of low accessibility areas exist across the Akwa Ibom State in the Niger Delta region of Nigeria. There is an indication that most places have good geographic access. Across the 1787 settlements identified in our dataset, 98.3% are with good access (<30 min), 27 settlements are located in the poor access class (31–60 min), while two settlements are within the very poor access class (>60 min). Geographic access is not the main limiting factor to health care access in the region. Therefore, computation of access to health care should take into consideration other dimensions of accessibility, to create a robust measure which will support effective and efficient health care planning and delivery.
1. Introduction
Ensuring healthy lives and promoting well-being for all at all ages is the 3rd Sustainable Development Goal (SDG), one of the 17 global goals set by the United Nations for transforming our world (United Nations Department of Economic and Social Affairs Citation2015). And inequalities in geographic access to health care is one of the primary challenges in achieving the 3rd SDG, thereby resulting in unmet targets towards reducing maternal and neonatal mortality, epidemics of HIV/AIDS, Malaria, Hepatitis B and Tuberculosis (Norheim et al. Citation2015; Stenberg et al. Citation2017).
Adequate access to health is one of the defining characteristics of a developed society because health is a very important aspect of human life (Evans and Stoddart Citation1990). Availability is often prioritised over accessibility by many politicians and other decision-makers in Sub-Saharan Africa (Wiseman et al. Citation2016), and especially in Nigeria (Iyioha and Nwabueze Citation2016). The health sector in the country is categorised into public and private and the public facilities are further divided into primary, secondary and tertiary health care service facilities (Uzochukwu et al. Citation2016). In measuring geographic access, it is important to consider distance to facilities, ease of travel, cost and travel time (Pyrialakou, Gkritza, and Fricker Citation2016). With the ever-increasing expansion of urban areas and population growth, it is necessary to regularly examine the pattern of accessibility of basic amenities across regions, States and urban areas. This becomes much more important for a region with huge population because the inadequate access to facilities may cause an epidemic outbreak – inadequate care of one infected person living in close contact with many people. A good example is the outbreak of Ebola (Heymann et al. Citation2015; Alexander et al. Citation2015). Thus, it is an accepted understanding that everyone should have access to appropriate quality health care in a timely, acceptable and affordable fashion, not just for the individual’s sake but for everyone’s benefit. However, the reality is often far different (Tangcharoensathien, Mills, and Palu Citation2015).
The healthcare industry for many years has been generating large pools of data and especially in the book record keeping formats stored in hard copies (Bollier and Firestone Citation2010). With the recent drive and trend towards digitalization, it is necessary to make these data available and open online in order to enhance the potential to improve the quality of healthcare delivery. Furthermore, analysis of such data can reveal patterns and trends which has the potential to improve care, save lives and lower healthcare service cost (Raghupathi and Raghupathi Citation2014).
Geographical or spatial accessibility refers to physical access a user possesses to a location (McGrail and Humphreys Citation2014). It captures the connection between the location where the supply is and where the demand is, taking into cognisance existing transportation infrastructure and travel impedance (Wang et al. Citation2016). There are many dimensions to access, and some of the concepts are complex to define and are dependent on the population and the health care systems itself (Aday and Andersen Citation1974). These dimensions could be spatial or non-spatial (Cressie Citation2015). Thus, factors such as affordability, quality, and acceptability are non-spatial in nature while accessibility and availability are spatial attributes (Khan Citation1992).
In characterising the spatial dimension, vehicular travel time/distance and Euclidean distance offers a prospect for measuring spatial accessibility (Khan Citation1992). Geurs and Van Wee (Citation2004) highlighted seven different approaches to measuring spatial accessibility. Spatial-separation-based model for operationalising accessibility is based on the infrastructure and uses the physical distance between infrastructure, e.g. Health Care Facilities (HCF) as input (Geurs and Van Wee Citation2004). This approach is more suitable when data on the network of transportation is not available or incomplete since it only requires the location of the facilities of interest.
Cumulative opportunity approach (isochrones) uses the element of travel time as well as a definition of the maximum desirable travel time. This approach captures the land use patterns and infrastructural constraints across the landscape (Geurs and Van Wee Citation2004). Gravity model approach seeks to overcome the rigidity or arbitrariness of the Isochrone approach, it treats opportunity differently along a time and distance continuum. However, this approach is sensitive to the size of the zone of interest, the configuration of this zone, choice of attractor variables and the values of travel impedance time. While being more accurate, this measure is often less legible. Competition measure approach is based on the separation-based approach but it considers the presence of a competing facility (Van Wee, Hagoort, and Annema Citation2001). For example, the accessibility to a health care facility is not only governed by the distance to travel to such facility but also by the amount of competition for such facility in the area – there is a certain number of bed spaces or range of services that the facility can provide. Time-space approach considers the space-time constraints (Hägerstraand Citation1970) namely, authority constraints (laws, rules, norms, time of operation, etc.), coupling constraints (social interaction), and capability constraints (physical/biological limit). This approach is an improvement on the contour measure approach with its consideration of additional constraint to accessibility other than just physical limitations. Utility-based approach measures accessibility based on the derived benefit from using the facility accessed. Thus, a facility may be considered accessible if it offers a higher level of benefit for the users. The last approach discussed by Geurs and Van Wee (Citation2004), is the network measure. For this, accessibility to a facility is based on the movement or access via the network and this is influenced by the topology and structure of the network.
Geographic Information System (GIS) provides a platform for which an assessment of the distribution of health care facilities (any other public amenities) can be carried out as well as the evaluation of the effectiveness coverage in relation to the population (Delamater et al. Citation2012). Mansour (Citation2016) examined the accessibility of health care facilities in the Riyadh Governorate. The study focused on public health care facilities across the study area. The results showed that the facilities are clustered in distribution, with central regions having a high density of facilities and marginal regions having lower densities. Less than half the population are within 1-km distance of Primary Health Care Facilities (PHCF), which provides valuable understanding for improving and planning for health care delivery in the study area. Combining data from attitude survey and road distance computation within GIS, Comber, Brunsdon, and Radburn (Citation2011) examined the difficulty of access to General Practitioners (GPs) and hospitals using a logistic regression model. From the results, long term illness, bad health and non-car ownership were found to be a significant predictor of difficulty of access to GPs and hospitals. Furthermore, the distance to a facility was found to be an insignificant predictor of difficulty of access to hospitals, but it was a significant predictor for the difficulty in access to GPs. From this, there is a clear indication that depending on the area, the distance to a facility may not even be the most important factor in determining accessibility, and the concept of accessibility needs to be treated as a multi-dimensional construct. Dos Anjos Luis and Cabral (Citation2016) examined geographic accessibility of primary health care centres in Mozambique using GIS to facilitate health care delivery planning. The result revealed that slightly over 90% of the country is underserved (>60 min walking distance to HCF) while 30% are in an underserved zone in the case of driving. However, when the population is considered, 67% of the population are in underserved areas (walking scenario) while for driving only 6% are in underserved areas. Yerramilli and Fonseca (Citation2014) examined the disparity in geographic accessibility to various critical HCF (paediatrics, obstetrician/gynaecologist, trauma/burn centres) in Mississippi (USA). The study was designed to capture the accessibility to these facilities for the specific population in need of these services, using a GIS-based network data. Optimal travel time of between 20 min and 30 min (Obstetrician, Paediatrics and Trauma centre) were used to model service areas for the facilities under consideration. Contrary to the findings of Comber, Brunsdon, and Radburn (Citation2011), Yerramilli and Fonseca (Citation2014) found that distance and travel time were the most significant factors affecting the health status and outcomes of the population. Taking into consideration the age and gender of the population in relation to cancer risk, Zhang et al. (Citation2018), evaluated access to HCFs and concluded that based on ratio and shortest road distance the distribution and location of HCF in Hong Kong are reasonable. However, they reported that cancer patient in rural/isolated or islands have low accessibility, but this population represents a small percentage of the total population. In the same view, Loo and Lam (Citation2012) examined the access to HCF by the elderly across Hong Kong. The study examined accessibility from major transit stops by walking for the elderly population of the Metropolis (walkability assessment for accessibility) and concluded that there is a need for improvement in the walkability of the built environment surrounding the HCFs in Hong Kong. In their comparison of three accessibility measures for HCFs in Austin, Texas, LaMondia, Blackmar, and Bhat (Citation2010) reported that individual access to HCF via the Paratransit (on-demand transit) differ according to each of the three measures of accessibility (cumulative, gravity and utility-based). Each approach provides a different interpretation from the others, and so there is a need for careful selection of measure by planners or policymakers in supporting their decision for health care delivery. In addition, they showed that while simple measures are easier to compute, they often provide an extreme or skewed picture of accessibility. Therefore, accessibility measures that are more closely related to individuals’ perception and true access to activity opportunity are adequate for representing accessibility.
It is therefore important that a definite effort is made at tracking inequalities in geographic access to health care towards the achievement of the 3rd SDG, through the collection and analysis of relevant open data and GIS. To this end, it is important that accessibility to health care facilities is measured thereby identifying deprived areas and people. This study, therefore, explored the geographic accessibility of health care facilities across Akwa Ibom State, Nigeria. This is intended to highlight the pattern of health care access across the State, thereby supporting the identification of areas with needs for such services. This endeavour is also geared toward showcasing the use of open data in carrying out a rapid assessment, an aspect of health care delivery that will support planning and decision making towards universal health coverage.
2. Methodology
2.1. Study area
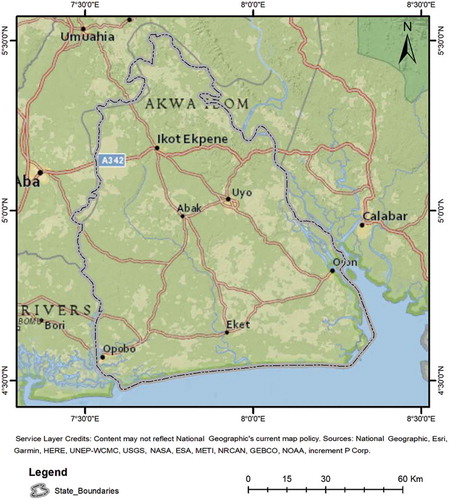
Akwa Ibom State is in the Niger Delta region of Nigeria (), bordered by Rivers State and Abia State on the west, Cross River State on the east and the Atlantic Ocean on the south. It has four ecological zones namely: mangrove forest/coastal vegetation, freshwater swamp forest, lowland rainforest, and derived savanna (Niger Delta Development Commission Citation2006). The State is projected to have approximately 4.5 million people in 2015 and 6.2 million people by 2020(UNDP Citation2006). The State is divided into thirty-one Local Government Areas (LGAs) with Uyo as the capital city. Akwa Ibom State Ministry of Health is responsible for the planning and implementation of health policies as well as the management of HCF of the State.
Figure 1. Location of the study area.
It is estimated that about 51.5% of the population in Akwa Ibom State are females (UNDP Citation2006). Niger Delta Environmental Survey of 2000, which was cited in UNDP (Citation2006), reported that between 20% and 24% of rural communities have access to safe drinking water while across urban settlement about 45%–50% have access (the only exception is Cross River State) in the Niger Delta Region. In addition to this, the Demographic and Baselines Studies Sectoral Report by the Niger Delta Development Commission, showed that when the respondents from Akwa Ibom State were asked which facilities should be provided or improved in their community, 89.8%, 9.6%, 0.1% and 0.5% identified school, health facilities, road/waterways and pipe-borne water, respectively (UNDP Citation2006). The sectoral report of the distribution of Small and Medium Enterprises (SMEs) showed that majority of the SMEs were in the tertiary services/mining/construction, manufacturing, and agriculture (41.3%, 35.7% and 22.2%, respectively) in Akwa Ibom State (Niger Delta Development Commission Citation2006; UNDP Citation2006).
According to the Nigeria Demographic and Health Survey (NDHS) of 2003 (National Population Commission and ORC Macro Citation2004), the Niger Delta region has the highest incidence of risky sexual behaviour, thus resulting in the region having the highest prevalence of HIV and AIDS in the country (UNDP Citation2006). Other factors responsible for this prevalence include most sexually active people in the country, limited use of condom and the largest number in the country to affirm to have had sex with prostitutes in the previous 12 months (UNDP Citation2006).
Centre for Population and Environmental Development of 2004, which was cited in UNDP (Citation2006), estimated that 71.2% of sickness in the region can be traced to malaria. The NDHS of 2003 showed reported that 30% of children sampled in the region had fever/convulsion compared to 18% in the south-west, 23.6% in the south-east and 24.2% in the north central region.
The Niger Delta region has the largest proportion of birth attended by traditional attendants (32.2%) across the nation and the high maternal mortality could be attributed to limited health facilities and cost of services (UNDP Citation2006). The report also cited Nigeria Demographic and Health Survey (NDHS) of 2003, reporting that birth attended by unskilled medical personnel are higher in the urban area than that in the rural area for the Niger Delta. They also reported that 13.8% affirmed that they did not know where to go for treatment (compared to the National average of 13.7%). Furthermore, 34.8% of people from the Niger Delta region (the largest in the country) identified the distance to HCF as a major impediment to access to health care (National average of 24.4%). Among women, 47.1% identified the cost of services/poverty as the most limiting factor for their access to health care (National average of 30.4%).
Combining these characteristics, UNDP (Citation2006) computed the Human Development Index (HDI) for the region and the results show that compared to the data of 1992, Akwa Ibom State recorded slight improvement in HDI compared to Edo, Delta and Bayelsa States (retrogressive trend). Among the nine States, Akwa Ibom State was ranked the 3rd for the Human Poverty Index (HPI), just behind Ondo and Bayelsa State. For Gender-related Development Index (GDI), the State was ranked the last at 0.391, well below the Niger Delta average of 0.444. For Gender Empowerment Measure (GEM), the State was ranked the 3rd at 0.385, below the regional value of 0.399.
2.2. Data and methods
The elevation data was extracted from the Shuttle Radar Topographic Mission (SRTM) 30m resolution dataset from the U.S. Geological Survey (USGS Citation2015). The data for the study area was downloaded from the Earth Explorer website (http://earthexplorer.usgs.gov/). Prior to the computation of the slope, sinks within the Digital Elevation Model (DEM) were filled using the Wang and Liu (Citation2006) method. The dataset was also projected to the Universal Transverse Mercator (Zone 32N) before the computation of the percent slope.
Population data for 2015 were sourced from Worldpop Datasets (www.worldpop.org.uk) using UN estimates and recent census data. This was computed using the method described by Stevens et al. (Citation2015).
Network data depicting the access by road across the study area was captured from the OpenStreet Map (OSM) (OpenStreetMap contributors Citation2018). The dataset contains spatial information and attributes, such as road network, water features (and waterways), building, point of interests, natural features, etc. The water feature, building and natural features constitute obstacles which prevent direct access to facilities in the computation of time to HCF.
Data on the location of HCF was collated from the Vaccination Tracking System (VTS), supporting Polio Eradication in Nigeria (http://vts.eocng.org/). This dataset is made up of all HCF (public and private). However, all analyses were carried out using only a portion of the dataset on PHCF. This was done to capture the access to the most affordable health facility to most of the populace in both urban and rural areas.
Using the population data, the total population per LGA were computed and compared against the total number of PHCF in each LGA. This was done to give a general view of the level of demand per PHCF.
Distance to the road was calculated using the OSM dataset taking into consideration obstacles (water or building/facilities or solid structures). This operation was carried out within ArcGIS (ESRI Citation2017) using the analytical tool – Predictive Analysis Tool (PAT). PAT supports the building of models to predict the location of a moving or stationary object/events based on conditions specified by the analyst. The Speed Model Builder (within PAT) works like the raster-based proximity analysis. But constraints to movement can be specified and travel time to a destination can be computed in addition to distance. The speed model creates a condition (constraint) surface which specifies speed achievable on different surface and terrain across the area. The result is essentially a surface showing travel time (from all locations across the study area) to a specified destination (in this case the PHCF). A speed model was created for the study area based on the local understanding of the region. The constraints to movement across the study area are captured in . Thus, depending on the characteristics on the location, the achievable speed across the study area for access to PHCF ranges from 2 km/hr to 20 km/hr. For places farther from roads or with high slopes, the speed would be slower accordingly. This is a broad assumption adopted for a rapid assessment and simplification of indicators. However, many more scenarios could be accommodated within this framework to capture the speed of movement across the environment. This approach was adopted since the network data is incomplete, and the analysis would not capture access to all the identified PHCF.
Table 1. Speed model scenarios and conditions.
Time from the nearest PHCF was calculated by PAT using the speed model generated from the scenarios in . The output was reclassified into three classes to summarize the level of access across the study area. In addition, the population across each of the zone was computed. The mean and Standard Deviation (SD) of travel time from PHCFs were also calculated for each LGA, to capture the level of access at this level of administration.
3. Results and discussion
3.1. Distribution, pattern and population
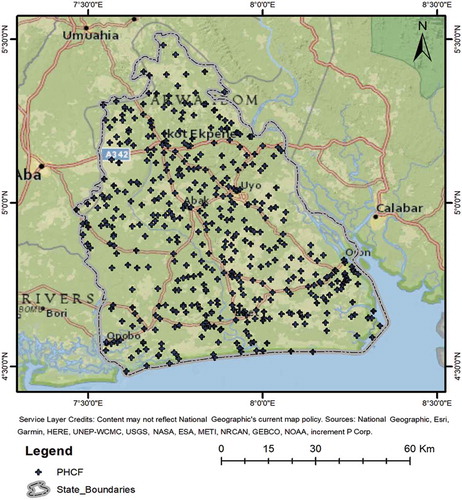
From the total of 724 HCF identified from the VTS database, only 458 (63%) can be recognized as PHCF. Therefore, most of the HCF across the State are in this category and shows that they are mostly concentrated around major intersections. These intersections also coincide either major urban agglomerations (Uyo, Abak, Eket, Oron Opobo, and Ikot Ekpene) or transit route leading to these places. Highest concentration can be seen around Uyo (the capital city) followed by Eket, Ikot Ekpene and Abak. As expected, Uyo as the capital city is the most populated city and thus has a higher concentration of the PHCF.
Figure 2. Location and distribution of HCF across Akwa Ibom State.
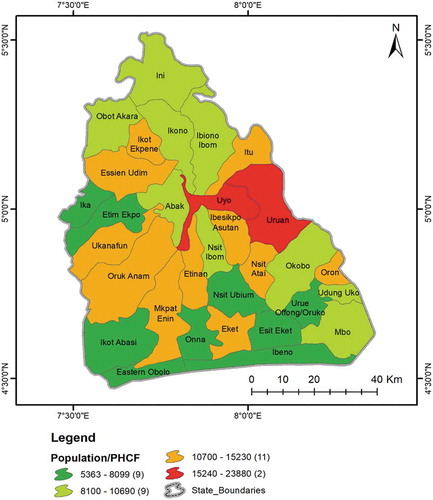
However, the ratio of the population to HCF revealed a different picture (as shown in ). Using the population estimates in 2015, the lowest ratio (5363–8099 persons per PHCF) was recorded for 9 LGAs spread across different parts of the State. About 11 LGAs have between 10,700 and 15,230 persons depending on one PHCF. Uyo and Uruan LGAs are exceptionally high demand, with between 15,240–23,880 persons potentially demanding services from each PHCF. The high demand for services across Uruan LGAs could be attributed to the increasing extent of Uyo as the capital city spreading toward this LGA (eastward growth). With the attendant population growth, higher demand could be expected as recorded in this analysis.
Figure 3. Distribution of population (at LGA level) per PHCF.
With the level of facilities and capacities of many of these PHCFs, it is highly debatable they are going to be able to cater for as many people as recorded from this analysis. It must also be noted that many of the populace may also not access these facilities due to beliefs, culture and traditions, perception (past experiences or perceived benefit), and other socio-economic conditions. However, there is a need to determine how many people are likely to require the services of PHCF to support planning for adequate health care delivery.
3.2. Accessibility analysis
The combination of the attributes of the terrain and the distance from the road network combined with the known location of PHCF led to the creation of the results in . This result was obtained by combining the speed model created using conditions in for calculating the travel time from each PHCF. From this analysis, the maximum travel time to the nearest PHCF is slightly over 2 hours, while the average is around 14 min (SD ±13.30 min). There are pockets of low accessibility areas across the State, with large tracks around the eastern border with Cross River State, coastline, around Opobo and along the border with Rivers State.
Figure 4. Drive time to nearest PHCF across the study area.
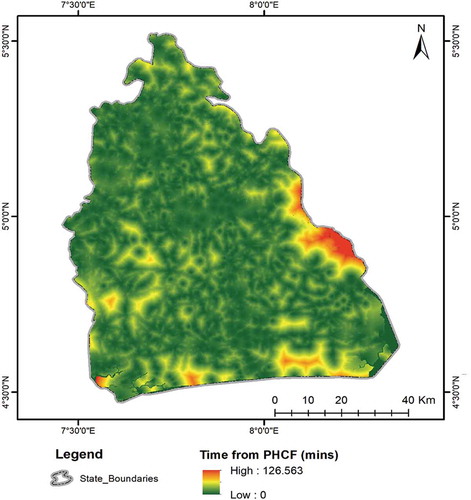
The analysis gave an indication that most of the locations across the study area have good spatial access (in terms of travel time) to PHCFs as captured in the dataset.
At the LGA level (), the average travel time across Eastern Obolo, Ibeno, Uruan and Okobo LGAs is between 20.5 min (Eastern Obolo) and 28.8 min (Okobo) with SD ranging between 17.6 min and 28.6 min. Eastern Obolo and Ibeno are coastal LGAs while Okobo and Uruan are punctuated along the eastern border by a network of water bodies. This attribute (remoteness) could further inhibit access to HCF for these LGAs (may likely be worse than captured by this analysis). However, with characteristics of the terrain, it is well with a reason to characterise these LGAs as having the worst access to PHCF.
Figure 5. Mean and SD bars of travel time to PHCF per LGA.
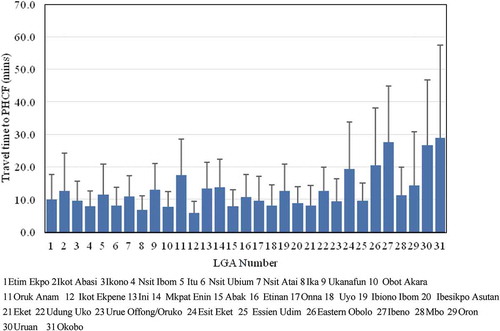
Fourteen LGAs have an average travel time ranging between 10 min and 14.2 min, while thirteen LGA have an average travel time of less than 10 min. As shown in , it is evident that there are wide variations across each LGA, the lowest variation was recorded for Ikot Ekpene (one of the major metropolitan LGA) and the highest was recorded in Okobo. This can be expected based on the variation in the terrain characteristics as well as the density of road (per unit area) across these areas.
To summarize the level of accessibility across the State, a cut-off point of 30 min to travel was selected based on the works of Nicholl et al. (Citation2007) and Ravelli et al. (Citation2011). There is an increased risk of mortality associated with the travel time of 20–30 min (trauma/emergencies care and obstetrician/gynaecologist).
The classification is presented in , and from the results, there is a clear indication that many places across the State fall within the 30 min cut-off of good access. Across the 1,787 settlements identified in our dataset, 98.3% are with good access (). 27 settlements are in the poor access class, while 2 settlements (Akpamfri Ukim and Ine Moses) located in Uruan LGA are in the very poor access class.
Table 2. Classes of the travel time to the PHCF.
Figure 6. Access class and settlement point across the study area.
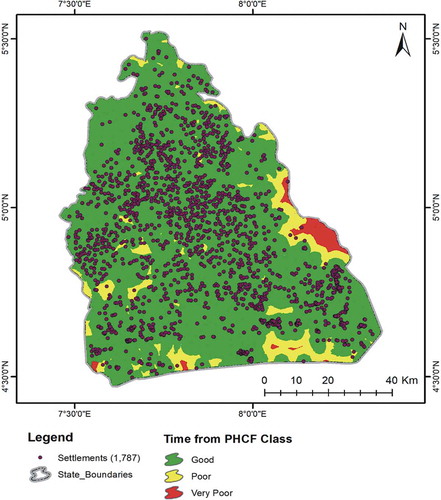
Computation of the population in each class shows that about 96% of the population lives in the good access class areas and 4% in the poor and very poor access regions of the State.
From the foregoing, we can get a clear indication that there is good geographical access to PHCF in Akwa Ibom State, at least for most of the populated areas of the State. And there are more PHCF located in the highly populated urban area compared with rural areas, which is not different from what has been reported in other countries across the world (Mansour Citation2016). This disproportionate distribution is also evident from the LGA level aggregation where the urban LGAs have a higher proportion of the total PHCF. However, despite this, it is highly unlikely that these PHCF can meet the demand, with most of the urban LGAs having a very high population to HCF ratio. Because the population is projected to increase in the future and most of the increase is likely to occur in the urban areas, there is a clear and pressing need to increase the number of HCF to support such population. It is necessary to include demand into the characterisation of access in this region. NDHS of 2003 (National Population Commission, and ORC Macro Citation2004) identified distance as one of the impediments to access health care in the region. However, the current result shows that this may not be the case right now.
The results identified terrain characteristics as one of the major factors limiting access as many of the settlement with poor and very poor access have difficult terrain to navigate. The results also partially confirmed what was reported by the NDHS (2003) in which women affirmed that poverty is the major limiting factors and not distance.
4. Conclusions and recommendations
One of the tasks of the government in ensuring the achievement of the 3rd SDG is to provide more robust access to an improved and equitable healthcare service. To do this, there is a need for regular evaluation of access, facilities (efficiency of service provision) and planning for future demand. This study partially confirmed previous studies which show that geographic access is not the main limiting factor to health care access in the region but the cost of procuring services (from transport to drugs) is the main limiting factor. Therefore, computation of access to PHCF needs to take into consideration other dimensions of accessibility, to create a robust measure which will support effective and efficient health care planning and delivery.
To bring the country closer achieving the SDG several issues must be addressed. Thus, ensuring a more robust geographical access to an improved and equitable healthcare services will be through investigation and efforts targeted towards tackling poor remote road network especially in rural areas (inaccessibility), high travel costs as a result of distance, time, and expenses, high population to PHCF ratio in the urban areas, climate conditions and even cultural factors, which when tackled can enhance healthcare utilization. Ensuring effective public transportation means especially for those with low-income can lead to enhanced utilization (Mattson Citation2011; Suzuki, Cervero, and Iuchi Citation2013). Methods that will encourage travel expenses reimbursements for rural residents to healthcare services will improve their visit and access to HCF. Innovative means of reducing geographic barrier or to circumvent them should be explored and the government should begin to explore investing in low cost, easy to use, and innovative delivery technologies for Information and Communications Technology (ICT) infrastructure in the adoption of telehealth which is been practiced in some countries (Wade et al. Citation2010; Steventon et al. Citation2012). This will surely improve the quality of health information available to communities and their families in underserved rural areas, as this has proven effective in its use for phone calls and the internet in Nigeria (Akinfaderin-Agarau et al. Citation2012; Odigie et al. Citation2012). Momentum can be created for online patients support and allow urban doctors access to rural doctors and nurses and decide on appropriate treatment (Beedasy Citation2010).
This study has shown that open data and spatial modelling can provide insights into the access to HCF and will help inform policy decisions, as larger datasets can be processed quickly, efficiently and consistently. With this framework, it is possible to regularly assess geographic accessibility to health care services. Such regular measurement will identify poorly served locations due to population changes, thereby helping to know where HCF can be located to improve access. Thus, with proper engagement among stakeholders (policymakers, researchers, industry, health practitioners, community workers, and residents, etc.) translating science and research into actionable policies and measures are possible in achieving SDGs.
There is a need to measure accessibility with the incorporation data on poverty, population structure and capacity of HCFs monitor access to health care, therefore creating a more robust indicator to support planning for health delivery for the nation and consequently supporting the achievement of 3rd SDG. Provision of more data from the Ministry of Health would further support this drive, allowing various researchers the opportunity to work on such.
Additional information
Notes on contributors
Olanrewaju Lawal
Olanrewaju Lawal is a senior lecturer at the University of Port Harcourt. He is a fellow of the Royal Geographical Society His works have leveraged the development in GIS, remote sensing, information and communication technology in addressing various issues in relation to sustainability, disaster risk management and risk reduction. Current research interests include application of geocomputation, modelling, geospatial intelligence, geosocial analysis for addressing social, economic and environmental issues.
Felix E. Anyiam
Felix E. Anyiam is a trained Public Health Researcher, Research Data Management Expert and Biostatistician; and presently employed as the Research Officer and Data Analyst (Scientist) for the Centre for Health and Development (CHD), University of Port Harcourt, Nigeria, a Centre that evolved from over 10 years of collaboration between faculty members from the University of Port Harcourt and the University of Toronto, Canada. The aim of the CHD is to develop human and organizational capacity for health-related research and quality health care provision in the Niger Delta region of Nigeria, built on sustainable local structure, and international collaborations.
References
- Aday, L. A., and R. Andersen. 1974. “A Framework for the Study of Access to Medical Care.” Health Services Research 9 (3): 208.
- Akinfaderin-Agarau, F., M. Chirtau, S. Ekponimo, and S. Power. 2012. “Opportunities and Limitations for Using New Media and Mobile Phones to Expand Access to Sexual and Reproductive Health Information and Services for Adolescent Girls and Young Women in Six Nigerian States.” African Journal of Reproductive Health 16 (2): 219–230.
- Alexander, K. A., C. E. Sanderson, M. Marathe, B. L. Lewis, C. M. Rivers, J. Shaman, J. M. Drake, E. Lofgren, V. M. Dato, and M. C. Eisenberg. 2015. “What Factors Might Have Led to the Emergence of Ebola in West Africa?” PLoS Neglected Tropical Diseases 9 (6): e0003652. doi:10.1371/journal.pntd.0003652.
- Beedasy, J. 2010. “Rural Designations and Geographic Access to Tertiary Healthcare in Idaho.” Online Journal of Rural Research & Policy 5 (2): 1. doi:10.4148/ojrrp.v5i2.191.
- Bollier, D., and C. M. Firestone. 2010. The Promise and Peril of Big Data. Washington, DC: Aspen Institute, Communications and Society Program.
- Comber, A. J., C. Brunsdon, and R. Radburn. 2011. “A Spatial Analysis of Variations in Health Access: Linking Geography, Socio-Economic Status and Access Perceptions.” International Journal of Health Geographics 10 (1): 44. doi:10.1186/1476-072X-10-44.
- Cressie, N. 2015. Statistics for Spatial Data. New York: John Wiley & Sons.
- Delamater, P. L., J. P. Messina, A. M. Shortridge, and S. C. Grady. 2012. “Measuring Geographic Access to Health Care: Raster and Network-Based Methods.” International Journal of Health Geographics 11 (1): 15. doi:10.1186/1476-072X-11-15.
- Dos Anjos Luis, A., and P. Cabral. 2016. “Geographic Accessibility to Primary Healthcare Centers in Mozambique.” International Journal for Equity in Health 15 (1): 173. doi:10.1186/s12939-016-0455-0.
- ESRI. 2017. ArcGIS Desktop 10.6. Environmental Systems Research Institute, Redlands, CA.
- Evans, R. G., and G. L. Stoddart. 1990. “Producing Health, Consuming Health Care.” Social Science & Medicine 31 (12): 1347–1363. doi:10.1016/0277-9536(90)90074-3.
- Geurs, K. T., and B. Van Wee. 2004. “Accessibility Evaluation of Land-Use and Transport Strategies: Review and Research Directions.” Journal of Transport Geography 12 (2): 127–140. doi:10.1016/j.jtrangeo.2003.10.005.
- Hägerstraand, T. 1970. “What about People in Regional Science.” Papers in Regional Science 24 (1): 7–24. doi:10.1111/j.1435-5597.1970.tb01464.x.
- Heymann, D. L., L. Chen, K. Takemi, D. P. Fidler, J. W. Tappero, M. J. Thomas, T. A. Kenyon, T. R. Frieden, D. Yach, and S. Nishtar. 2015. “Global Health Security: The Wider Lessons from the West African Ebola Virus Disease Epidemic.” The Lancet 385 (9980): 1884–1901. doi:10.1016/S0140-6736(15)60858-3.
- Iyioha, I. O., and R. N. Nwabueze. 2016. Comparative Health Law and Policy: Critical Perspectives on Nigerian and Global Health Law. New York: Routledge.
- Khan, A. A. 1992. “An Integrated Approach to Measuring Potential Spatial Access to Health Care Services.” Socio-economic Planning Sciences 26 (4): 275–287. doi:10.1016/0038-0121(92)90004-O.
- LaMondia, J. J., C. E. Blackmar, and C. R. Bhat. 2010. “Comparing Transit Accessibility Measures: A Case Study of Access to Healthcare Facilities.” Paper read at Transport Research Board 2011 Annual Meeting, Washington, DC.
- Loo, B. P. Y., and W. W. Y. Lam. 2012. “Geographic Accessibility around Health Care Facilities for Elderly Residents in Hong Kong: A Microscale Walkability Assessment.” Environment and Planning B: Planning and Design 39 (4): 629–646. doi:10.1068/b36146.
- Mansour, S. 2016. “Spatial Analysis of Public Health Facilities in Riyadh Governorate, Saudi Arabia: A GIS-based Study to Assess Geographic Variations of Service Provision and Accessibility.” Geo-spatial Information Science 19 (1): 26–38. doi:10.1080/10095020.2016.1151205.
- Mattson, J. 2011. “Transportation, Distance, and Health Care Utilization for Older Adults in Rural and Small Urban Areas.” Transportation Research Record 2265 (1): 192–199. doi:10.3141/2265-22.
- McGrail, M. R., and J. S. Humphreys. 2014. “Measuring Spatial Accessibility to Primary Health Care Services: Utilising Dynamic Catchment Sizes.” Applied Geography 54: 182–188. doi:10.1016/j.apgeog.2014.08.005.
- National Population Commission, and ORC Macro. 2004. Nigeria Demographic and Health Survey 2003. Calverton, Maryland: National Population Commission (Nigeria) and ORC Macro.
- Nicholl, J., J. West, S. Goodacre, and J. Turner. 2007. “The Relationship between Distance to Hospital and Patient Mortality in Emergencies: An Observational Study.” Emergency Medicine Journal 24 (9): 665–668. doi:10.1136/emj.2007.051011.
- Niger Delta Development Commission. 2006. Niger Delta Regional Development Master Plan. Port Harcourt: NDDC.
- Norheim, O. F., P. Jha, K. Admasu, T. Godal, R. J. Hum, M. E. Kruk, O. Gómez-Dantés, C. D. Mathers, H. Pan, and J. Sepúlveda. 2015. “Avoiding 40% of the Premature Deaths in Each Country, 2010–30: Review of National Mortality Trends to Help Quantify the UN Sustainable Development Goal for Health.” The Lancet 385 (9964): 239–252. doi:10.1016/S0140-6736(14)61591-9.
- Odigie, V. I., L. M. D. Yusufu, D. A. Dawotola, F. Ejagwulu, P. Abur, A. Mai, Y. Ukwenya, E. S. Garba, B. B. Rotibi, and E. C. Odigie. 2012. “The Mobile Phone as a Tool in Improving Cancer Care in Nigeria.” Psycho‐Oncology 21 (3): 332–335. doi:10.1002/pon.1894.
- OpenStreetMap contributors. 2018. Openstreet Map Data: Nigeria.
- Pyrialakou, V. D., K. Gkritza, and J. D. Fricker. 2016. “Accessibility, Mobility, and Realized Travel Behavior: Assessing Transport Disadvantage from a Policy Perspective.” Journal of Transport Geography 51: 252–269. doi:10.1016/j.jtrangeo.2016.02.001.
- Raghupathi, W., and V. Raghupathi. 2014. “Big Data Analytics in Healthcare: Promise and Potential.” Health Information Science and Systems 2 (1): 3. doi:10.1186/2047-2501-2-3.
- Ravelli, A. C. J., K. J. Jager, M. H. De Groot, J. J. H. M. Erwich, G. C. Rijninks‐van Driel, M. Tromp, M. Eskes, A. Abu‐Hanna, and B. W. J. Mol. 2011. “Travel Time from Home to Hospital and Adverse Perinatal Outcomes in Women at Term in the Netherlands.” BJOG: An International Journal of Obstetrics & Gynaecology 118 (4): 457–465.
- Stenberg, K., O. Hanssen, T. T. Edejer, M. Bertram, C. Brindley, A. Meshreky, J. E. Rosen, J. Stover, P. Verboom, and R. Sanders. 2017. “Financing Transformative Health Systems Towards Achievement of the Health Sustainable Development Goals: A Model for Projected Resource Needs in 67 Low-income and Middle-income Countries.” The Lancet Global Health 5 (9): e875–e887. doi:10.1016/S2214-109X(17)30263-2.
- Steventon, A., M. Bardsley, J. Billings, J. Dixon, H. Doll, S. Hirani, M. Cartwright, L. Rixon, M. Knapp, C. Henderson, A. Rogers, R. Fitzpatrick, J. Hendy, and S. Newman. 2012. “Effect of Telehealth on use of Secondary Care and Mortality: Findings from the Whole System Demonstrator Cluster Randomised Trial.” British Medical Journal no. 344:e3874. doi:10.1136/bmj.e3874.
- Stevens, F. R., A. E. Gaughan, C. Linard, and A. J. Tatem. 2015. “Disaggregating Census Data for Population Mapping Using Random Forests with Remotely-Sensed and Ancillary Data.” Plos One 10 (2): e0107042. doi:10.1371/journal.pone.0107042.
- Suzuki, H., R. Cervero, and K. Iuchi. 2013. Transforming Cities with Transit: Transit and Land-Use Integration for Sustainable Urban Development. Washington, DC: The World Bank.
- Tangcharoensathien, V., A. Mills, and T. Palu. 2015. “Accelerating Health Equity: The Key Role of Universal Health Coverage in the Sustainable Development Goals.” BMC Medicine 13 (1): 101. doi:10.1186/s12916-015-0342-3.
- UNDP. Niger Delta Human Development Report. 2006. Garki, Abuja: United Nations Development Programme.
- United Nations Department of Economic and Social Affairs. 2015. “Sustainable Development Goals.” United Nations. Accessed 23rd October 2015. https://sustainabledevelopment.un.org/?menu=1300
- USGS. 2015. “Shuttle Radar Topography Mission (SRTM) 1 Arc-Second Global - The Long Term Archive.” U.S. Department of the Interior. Accessed 25th March 2015. https://lta.cr.usgs.gov/SRTM1Arc
- Uzochukwu, B., O. Onwujekwe, C. Mbachu, C. Okwuosa, E. Etiaba, M. E. Nyström, and L. Gilson. 2016. “The Challenge of Bridging the Gap between Researchers and Policy Makers: Experiences of a Health Policy Research Group in Engaging Policy Makers to Support Evidence Informed Policy Making in Nigeria.” Globalization and Health 12 (1): 67. doi:10.1186/s12992-016-0209-1.
- Van Wee, B., M. Hagoort, and J. A. Annema. 2001. “Accessibility Measures with Competition.” Journal of Transport Geography 9 (3): 199–208. doi:10.1016/S0966-6923(01)00010-2.
- Wade, V. A., J. Karnon, A. G. Elshaug, and J. E. Hiller. 2010. “A Systematic Review of Economic Analyses of Telehealth Services Using Real Time Video Communication.” BMC Health Services Research 10 (1): 233. doi:10.1186/1472-6963-10-233.
- Wang, J., Y. Deng, C. Song, and D. Tian. 2016. “Measuring Time Accessibility and Its Spatial Characteristics in the Urban Areas of Beijing.” Journal of Geographical Sciences 26 (12): 1754–1768. doi:10.1007/s11442-016-1356-2.
- Wang, L., and H. Liu. 2006. “An Efficient Method for Identifying and Filling Surface Depressions in Digital Elevation Models for Hydrologic Analysis and Modelling.” International Journal of Geographical Information Science 20 (2): 193–213. doi:10.1080/13658810500433453.
- Wiseman, V., C. Mitton, M. M. Doyle‐Waters, T. Drake, L. Conteh, A. T. Newall, O. Onwujekwe, and S. Jan. 2016. “Using Economic Evidence to Set Healthcare Priorities in Low‐income and Lower‐middle‐income Countries: A Systematic Review of Methodological Frameworks.” Health Economics 25 (S1): 140–161. doi:10.1002/hec.3299.
- Yerramilli, S., and D. G. Fonseca. 2014. “Assessing Geographical Inaccessibility to Health Care: Using GIS Network Based Methods.” Public Health Research 4 (5): 145–159.
- Zhang, W., K. Cao, S. Liu, and B. Huang. 2018. “GIS-Based Accessibility Analysis of Health-Care Facilities: A Case Study in Hong Kong.” In Comprehensive Geographic Information Systems, edited by B. Huang, 402–410. Oxford: Elsevier.