
 ?Mathematical formulae have been encoded as MathML and are displayed in this HTML version using MathJax in order to improve their display. Uncheck the box to turn MathJax off. This feature requires Javascript. Click on a formula to zoom.
ABSTRACT
In the big data era, robust solutions are obliged to be proposed to integrate and represent data from different formats and with different contents to assist the decision-making. Current cartographic and geographic information systems have limited capabilities for solving these problems. This paper describes an automatic and comprehensive system that conducts data fusion from all potentially related sources. In this system, a new Semantic Location Model (SemLM) is established to present the semantic concepts and location feature and demonstrate how locations are interrelated. In the SemLM, various types of location descriptors in different application scenarios can be analyzed and understood. Additionally, considering the challenges involved in data-intensive computation and visualization, this paper implements a Place-based Pan-Information System (P2S) as an innovative 4D system that dynamically associates and visualizes place-based information, using public security as the case study.
1. Introduction
Maps are essential in communicating spatial information that cannot be adequately conveyed by text or numbers. Maps can also show how people and places are related. Beyond mapping the absolute locations of people and places, we often utilize additional communication tools to describe many different types of relationships among people and places. This need has become more intense because the Internet has proliferated and the vast amount of digital information has been generated and disseminated. In response, numerous tools such as Cybermap (Jiang and Ormeling Citation1997), Cybercartography (Taylor and Lauriault Citation2013), and Google/Bing/Yahoo Maps have been developed to visualize and convey information about people and places. However, three significant challenges emerge: (1) a large amount of useful information remains undetected and invisible on maps; (2) indoor mapping tools are scarce; (3) real-time and dynamic information is not well visualized. In the report entitled “Looking Forward: Five Thoughts on the Future of GIS”, “indoor and outdoor integration”, “location understanding”, “dynamic information representation”, and “user-oriented demand” were identified as the major GIS frontiers in the future (Goodchild Citation2011). The purpose of this paper is to present a new system called Place-based Pan Information System (P2S) that can address some of the challenges described above.
The growing multi-source heterogeneous big data over the Internet reflects human-environment interaction across scales. International Data Corporation (IDC) estimated that approximately 0.8 ZB (a trillion GB) of digital information was generated in 2009 around the world and that this number will increase dramatically to 40 ZB by 2020. In light of this trend, new robust solutions must be developed to make better use of the data. As argued by (Williams Citation1987), approximately 80% of the information is related to geographical locations. Hence, location can be a critical link in integrating data from different sources and with different place attributes. Using location as the key, any location-related description, from the coordinates to the informal textual descriptions of places, can be associated. Therefore, P2S contains a location-understanding module that extends the semantic location model to include both indoor and outdoor locations. Based on this model, P2S can convert locations described by various types of text (natural language) into geographical locations. Based on the location, various types of data are linked using spatio-temporal methods, and we can discover new patterns to gain more insights from the data.
Beyond associating many data sets by linking their locations, visualizing such a wide range of information remains a challenge. Dynamic 3D visualizations have been shown to have considerable advantages over conventional 2D approaches in conveying spatial content (Jobst and Germanchis Citation2007). By adding the temporal dimension, 4D maps are a more robust platform for visualizing spatio-temporal processes, and they are also suitable for indoor/outdoor and underground views (Li and Lee Citation2008). Moreover, P2S integrates a variety of visualization tools to demonstrate real and virtual environments, including videos, panoramas, 3D models, and so on. Furthermore, Goodchild (Citation2011) mentioned that most technologies are built for outdoors. Thus, P2S integrates both indoor and outdoor positioning technology and seamlessly locates users’ positions. Additionally, it provides seamless two-way visual transitions: outside-to-inside and inside-to-outside.
In summary, this paper suggests a solution for using and visualizing a wide range of big data through the implementation of P2S. This paper defines P2S as follows: in a ubiquitous network environment, P2S is an intelligent platform service that dynamically associates multi-temporal, multi-thematic, multi-granular, and hierarchical information for objects and events based on their locations, and dynamically provides a personalized location and location-related intelligent information services.
In the following sections, this paper first discusses the unique characteristics of place-based big data. Next, it presents the conceptual framework of a dynamic 4D GIS using a semantic location model. To demonstrate the feasibility of this new approach, this paper finally implements P2S to support police operations.
2. Related works
Maps tend to obscure rather than reveal the complexity of social and spatial processes (Goodchild and Glennon Citation2008). Maps are central to GIS, both as a source of input data and as a means of demonstrating the output. Currently, the mapping is burdened with a bewildering number of names, including the geospatial web or Geoweb (Haklay, Singleton, and Parker Citation2008; Goodchild Citation2007), neogeography (Turner Citation2006), locative media (Farman Citation2013), DigiPlace (Zook and Graham Citation2007), and spatial crowdsourcing or geo-collaboration (Crampton Citation2009). The research most related to this paper is “Cybercartography”, a term coined by Taylor and Lauriault (Taylor and Lauriault Citation2013), which is “the organization, presentation, analysis and communication of spatially referenced information on a wide variety of topics of interest to society in an interactive, dynamic, multisensory format with the use of multimedia and multimodal interfaces”.
However, Cybercartography has several shortcomings, as discussed below.
Data collection. Cybercartography is multisensory. It uses vision, hearing, and touch and eventually add smell and taste. However, as new communication and sensor technologies develop, data may be in new formats, originating from more sources and becoming ubiquitous. These sources and formats range from man-made to machine-generated, from indoors to outdoors, and from subterranean areas to outer space. Therefore, the volume and variety of data will become much more extensive. In addition, Cybercartography focuses on outdoor information. However, outdoor information needs to be integrated with indoors, where people spend 80– 90% of their time, generating over 80% of information.
Data association. Cybercartography supports data in the formats of images, videos, and sounds. Although cybercartography may be integrated into a location-based model, it needs to be expanded into a semantic location model to include indoor applications (Anagnostopoulos et al. Citation2005; Jiang and Steenkiste Citation2002a; Liang et al. Citation2011; Worboys Citation2011). In addition, semantic location models are context-aware systems showing how users interact with the environment.
Data visualization. Cybercartography maps information using multimedia formats. However, in a semantic location model, there is a need for new methods of data visualization that not only display a large amount of data but also convey comprehensive information with a temporal dimension.
In the big data era, all types of related and associated information will change as the data volume increases – including methods for capturing data, processing data, and visualizing data. Therefore, this paper proposes the concept of a P2S as a new way of visualizing a large amount of wide-ranging data. Place-based information resource integration and the interdisciplinary approaches for representing that information are fundamental for spatial thinking because they support multi-dimensional uses of spatial data. Spatial thinking has become a common interest in a growing research community. Spatial thinking aims to analyze the spatial patterns of structures, and the trends and dynamics of geographical phenomena. Spatial thinking analysis often harnesses large volumes of digital social and environmental data to improve human well-being. The place-based public policy may be useful, but location-based information that supports the decision-making processes can be challenging to assemble and expensive to retrieve. Simultaneously, researchers have recognized that the spatial and temporal components of geographic events should be addressed jointly instead of being treated separately. Thus, researchers must consider both the spatial and temporal aspects of the data they use. Even with this awareness, the rich details of spatio-temporal complexity remain largely unexplored because of constraints in computation capacity from the challenges of large data volumes and the intensive demand for the computing resources involved.
Traditional cartographic methods and legacy spatial analysis tools must be improved to be capable of mapping large amounts of event data, such as all reported cases in police work. This type of information always contains place-related information (e.g. “There is a fire at No. 129 Luoyu Road.”). Thus, it is necessary to translate the natural language descriptions of location information into mapping coordinates. Mapping and analyzing event data requires an innovative design for data visualization and spatial analysis algorithms that go beyond the traditional approaches. These research challenges may invoke a paradigm shift in the field of geography because geographers and cartographers are facing a crisis about how to represent these new forms of information. Throughout P2S development, the focus has been on building its capabilities by considering both the computational intensity and intelligent data mining. P2S was designed to empower multiple communities, including researchers and participants from the broader domains of science, governmental and non-profit agencies. P2S enables a shared common interest in visualizing big data for geographic events.
Meanwhile, spatio-temporal dynamics has become a central theme for Geographical Information (GI) scientists. The location is the key to centrally organizing all types of information, and it is the principal element that defines new mapping concepts and approaches. Also, location is increasingly seen as attributable to the availability of spatio-temporal datasets (Stevenson et al. Citation2010).
3. Framework and methodology
3.1. P2S framework
When a user remains at a place modeled in P2S, information related to that user or that is of interest to that user will be pushed to the P2S based on the user’s location. The information is collected from resources such as the Internet, industries (data providers), and sensors that possess information about the user’s location. P2S offers unique advantages over conventional 2D or 3D mapping approaches. In general, the P2S owns the features, such as:
P2S accepts real-time data from earth observation systems, the Internet, mobile communication networks, and sensor webs. It provides unified interfaces to access a variety of information from different fields.
P2S associates various types of information with location semantics, including spatial coordinates and other notions of locations. Information associations can be spatial using coordinates or by using semantic notions.
P2S generates 4D maps (including 2D and 3D maps with temporal information) using cross-disciplinary knowledge and technologies to support multi-purpose uses of integrated information.
P2S can serve individuals, governments, civil groups, and the private sectors to aid in the integration of scientific and artistic expression.
P2S supports indoor and outdoor scenarios, as well as surface and underground spaces with a uniform data structure and organization.
P2S is highly adaptive to user requirements and devices because of its flexible user interface. Users’ inputs and preferences are maintained and used for recommendations
P2S can be applied to a variety of domains such as indoor and outdoor navigation or tracking, queries based on natural language, emergency rescue operations, and security monitoring.
Simplifying the description of P2S, this paper decomposes it into three key closely related elements. Ubiquitous information is acquired for locations in P2S from the Internet, sensor networks, data providers, and other sources. A semantic location is a location that has a meaningful interpretation to applications in a scenario (i.e. on campus, classroom buildings and meeting rooms can be semantic locations; in an airport, the location of a tilt-tray sorter or inquiry desk can be semantic locations). Applications are generally linked to the notion of a semantic location rather than using geographical coordinates directly. For data management, the P2S associates ubiquitous information with other location-based information based on semantic locations. These associations are described in detail in the next section.
Using captured information, 4D map is established to represent that information, showing not only 3D space but also representing how data changes over time. In essence, “Ubiquitous Information,” “Semantic Location,” and “4D Map” are the three key elements that comprise the P2S. The following sections provide detailed descriptions of each component.
3.2. Acquiring ubiquitous information
The flow of digital information has grown exponentially in recent years. Based on varieties of resources, ubiquitous information can be captured from anywhere at any time, including social networks (such as Facebook, microblogs, and other social media outlets), Places of Interest (POIs) (such as banks, shopping malls, gas stations, and parks) and Volunteered Geographic Information (VGI) (Goodchild Citation2007). Industrial information resources provide data for weather, transportation, public security, surveying and mapping, and many others. Sensor networks collect data using various types of sensors, including traffic sensors, Radio Frequency Identification (RFID) positioning sensors (Cangialosi, Monaly, and Yang Citation2007), temperature sensors, humidity sensors, and so forth. Using Application Program Interfaces (APIs), it is possible to acquire a wide range of information such as user information, comments, relationships, favorites, etc. Some of these data are publicly accessible through Web Services (e.g. http://www.36wu.com/Service.aspx) and include weather reports, ID queries, train schedule queries, and others. However, access to industrial data may be limited because of security concerns except with prior approval from the data producers or owners. For sensor networks, similar to industrial data, some of the information are freely collected by the public but other data sources may be controlled. The availability of large data sets of georeferenced events in concert with high-performance computing technology has not only raised fundamental challenges for researchers and analysts but also provided new opportunities for collecting thematic data to help researchers better understand the socioeconomic dynamics.
When ubiquitous information is collected in large volumes and with high diversity, place-based strategies can be used to sort the collected data and associate them with different locations. Recalling Williams’ estimate that approximately 80% of data from the Internet include some location elements, associating different datasets by using location as a critical link among these data would be a practical and useful approach. Based on this estimate, the P2S classify data into location description data and location-based data. In short, location description data include descriptive information about places, including place names, addresses, IP addresses, POIs, zip codes, etc. Meanwhile, location-based data include social data, traffic data, and user preferences data, etc.
3.3. Semantic location model (SemLM)
A location model plays a vital role in location-awareness applications. Location can represent the position, distance, topology, and direction of static objects (e.g. buildings, rooms) or dynamic objects (e.g. people, vehicles) in the real world (Couclelis Citation2010; MacEachren Citation2017). Its semantics can be studied from thematic, spatial, and temporal perspectives (Hu Citation2017). Thus, geographic-oriented ontologies are proposed. For example, (Worboys and Hornsby Citation2004) introduced the Geospatial Event Model (GEM) which extends the traditional object model with events to capture dynamic geospatial processes. Multi-layer ontologies, which distinguish the entities in the physical world and their representations in human cognition, were developed for spatiotemporal databases (Frank Citation2001; Citation2003) and geographic information (Couclelis Citation2010). In recent years, Ontology Design Patterns (ODPs) are developing rapidly in the geospatial domain, such as semantic trajectories (Hu et al. Citation2013) and space-time prisms (Keßler and Farmer Citation2015).Meanwhile, some researchers have criticized the use of ontologies to address semantic issues by arguing that ontologies as priori agreements cannot capture the meaning of concepts that change dynamically (Di Donato Citation2010; Gärdenfors Citation2004).
Becker and Dürr (Citation2005) identified three types of location models, including the Geometry Location Model (GLM), Symbol Location Model (SymLM) and a combination of both, named the Hybrid Location Model (HLM) (Jiang and Steenkiste Citation2002a). GLM allows accurate position expressions and inquiries. However, it is limited to what is supported by the semantic relations between locations (Anagnostopoulos et al. Citation2005). SymLM accommodates various ways of expressing unknown spatial relations. However, it lacks geometric calculations and consumes many computational resources. Therefore, considering the limitations of GLM and SymLM, (Liang et al. Citation2011) proposed a Semantic Location Model (SemLM) to meet the demands of both location awareness and computational resources.
Although SLM is capable to describe the semantics and properties of a location, and its spatial relation to other locations, it still not include comprehensive information to fully support the expression of distances as measured in different forms (i.e. Euclidean distance, distance in time, distance within social networks, etc.) or different reasoning schemes for location knowledge. For example, the description, “the southeast corner of the 3rd floor in the Wangfujing Department Store” includes a combination of indoor and outdoor locations. Existing location models cannot describe and express all these locations. However, such location descriptions will be common in location-based pan-information systems; thus, we propose a new semantic location model, SemLM.
The semantic location describes the features and meaningful implications of a spatial location in specific scenarios. For example, geographical coordinates represent a location of a point in a specific coordinate system; a room number represents a specific spatial range in a building; a postal code indicates an administrative region. The newly proposed SemLM forms the conceptual backbone of P2S. SemLM integrates locations and their trajectories of static and dynamic objects, as well as related spatial semantics, geographic semantics, scale semantics, property semantics, source semantics, and mobile semantics.
SemLM consists of a location description model and a location feature model (as shown in ). A location description model describes both indoor and outdoor locations, enabling P2S to integrate and parse location information with different spatial references, representations, and semantics. A location feature model depicts the semantic features of a location at different levels, allowing P2S to implement both location calculations and to analyze location-related information based on SemLM characteristics.
Figure 1. Unified location description.
3.3.1. Location description model
A location description model consists of three elements: a reference location, a Primary Location (PL), and the relationships between the two locations. A location can be the primary location in a model. A location can also be a reference location that acts as an indicator to determine other positions (Graham and Shelton Citation2013). The relationship among locations explicitly depicts the spatial relations between the primary location and the reference locations. For example, in the description “China is adjacent to Mongolia”, Mongolia acts as a reference location for locating China, while China is the primary location. The location relation between them is adjacency. Note that sometimes the primary location might not be explicitly expressed, for example, “next to Wuhan University.” In such cases, a semantic approach helps to solve the problem.
A location description model is composed of both a geometric location description and a semantic location description, as shown in . The geometric location description describes location information precisely based on a coordinate system. A typical example would be (114.12°, 30.21°) in the geodetic coordinate system. Geometric location descriptions consist of two elements, a geometric location, and geometric spatial relations. The former acts as a reference location that can be described with either raster coordinates (e.g. cell A (1, 1)) or vector coordinates (e.g. vector point B (112.32°, 32.42°)). The latter describe geometric offsets between the reference location and the primary location. A geometric offset can be a distance offset (e.g. 500 m) or a directional offset (N2E15°). A distance offset represents a quantitative distance from the reference location to a primary location. A directional offset depicts the angle between a reference direction and the direct line from the reference location to the primary location. A combination of distance and directional offsets can often be used to refine the position of a location, for example, Location = (114.2323°E, 32.2341°N, 5 km, and N20°E).
Geometric location descriptions have been widely used in GIS because they are convenient for storage and computational procedures. However, geometric locations are not friendly for human beings trying to cognize and comprehend real features and events from pairs of cryptic coordinates. Thus, a semantic location description can be integrated by incorporating qualitative descriptions of a location expressed in natural language. As described earlier, a semantic location gives human beings a meaningful locality through a semantic description of the location, which can be a place name, a postal address, a zip code, a named entity, a URL, an IP address, a telephone number, an indoor location, a velocity, the name of a geo-event, etc. The relations between semantic locations, which are called semantic spatial relations, can be defined in spatial terms. Three binary relations are primarily used in semantic location descriptions: qualitative distance relations, qualitative directional relations, and topological relations.
Qualitative distance relations are those that qualitatively describes the distance between semantic locations (i.e. how different the two locations are to human beings). Qualitative directional relations represent the results of spatial cognition from sorting through the semantic locations, which were derived from absolute directions (such as North, East, South and West) or relative directions (such as left, right, front and back). Topological relations represent containment, adjacency and intersection relations between semantic locations. For example, relations such as “located in,” “next to,” or “the intersection of,” can all be topological relations.
Moreover, the three relations can be either individual or compound relations for describing location relations. Note that special spatial relations may exist (such as “along” and “between”) that requires special handling in the model. The diversity of semantic spatial relations allows various means of associating spatially different semantic locations.
3.3.2. Location feature
A location feature model depicts semantic features of a location at different levels, allowing P2S to implement location calculations and location-related information analysis based on semantic characteristics. (Zhao, Lue, and Zhang Citation2007) suggested that location semantics include location names, relationships, properties, and time. In a location feature model, four semantics are defined: spatial features, scale features, source features, and mobile features. describes how four semantics help to represent location features.
Figure 2. Location features.
A location is described using the concept of a five-tuple structure that includes conception, characteristics, axioms, spatial relations, and semantic relations, as shown by the following formula.
In the above formula, “Conception” denotes a detailed location. “Characteristics” describes the notion semantics of the location in a scenario, including spatial, geographic, scale, source, property and mobile semantics. “Axioms” depicts a series of behavioral rules within the location. “Spatial Relations” defines both local spatial relations and global spatial patterns between the location and other locations. Finally, “Semantic Relations” represents non-spatial relations between the location and other locations.
Spatial features, as the underlying semantic of a location, include a footprint and an attribute of data uncertainty. The footprint of a location is its geographic extent. It is depicted by geometry with coordinates such as a point, a polyline, a polygon, a substantial volume, or their combination. When a location cannot be defined with certainty by geometry, an uncertainty attribute field is used to represent the probability distribution of the location in and around its footprint. Spatial features are used primarily to position and represent locations. The scale feature is the scale semantic of location.
The scale is an abstract concept that is difficult to measure quantitatively. We define a variety of scale reference concepts to describe the scale semantic of a location, such as map scales (e.g. 1:500), administrative hierarchies (e.g. a certain level within a city), and spatial resolutions (e.g. 500 m). In the process of georeferencing locality descriptions, a scale feature is needed. The source feature refers to the means by which the location information was acquired. A location may be a discrete point or a continuous area whose position is measured by some devices with a time stamp or over a while. The source feature of a location may also be formulated from verbal descriptions by human beings. Using location source features, a more precise location can be derived. For example, integrating positioning results from both Wi-Fi and RFID is popular for locating certain objects. A mobile feature uses the characteristics of a trajectory location to describe a dynamic object, such as an object’s velocity and orientation. This feature is helpful for mining interesting places from trajectories and in analyzing human behavior patterns. All the location semantics above are considered mainly during the processes of positioning location descriptions and calculating location relations. However, they can also be used to analyze and excavate located-related ubiquitous information.
3.3.3. Applying SemLM
Because the location is the key element in linking data, it is necessary to provide methods that can understand locations. Currently, GPS is the most widely used way to obtain users’ positions outdoors. Besides, this paper presents two other applications that can understand locations. One is to locate indoor positions using the Wi-Fi fingerprinting location method, which provides geographical coordinates directly. The other is to convert locations described by natural language into geographical coordinates suitable for both indoor and outdoor positions.
Understanding locations by Wi-Fi fingerprinting positioning technology
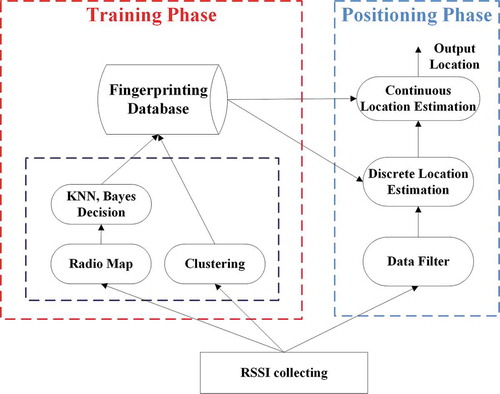
The positioning has become a hot research topic recently, especially for indoor applications (He and Chan Citation2016; Jiang et al. Citation2012). However, indoor positioning is still a challenging topic because of complex spatial structures and high positioning precision demand. Therefore, the P2S studied indoor position technologies to extract locations using Wi-Fi fingerprinting and Inertial Measurement Unit (IMU). The main task involved in positioning is deploying Access Points (APs), which provides location information. With known APs, target locations can be calculated using wireless signal strength. demonstrates how APs are deployed in a test area over two floors. IMU sensors and barometer sensors were used to improve the result. The barometer is sensitive to different floor levels. The IMU data can be used to track the movement of a mobile phone. presents the procedures for obtaining accurate locations. The collected Received Signal Strength Indication (RSSI) values are processed by comparing them with the data in a fingerprinting database. The system then estimates discrete and continuous locations.
Figure 3. AP deployment in the test area.
Figure 4. Positioning algorithms based on Wi-Fi fingerprinting.
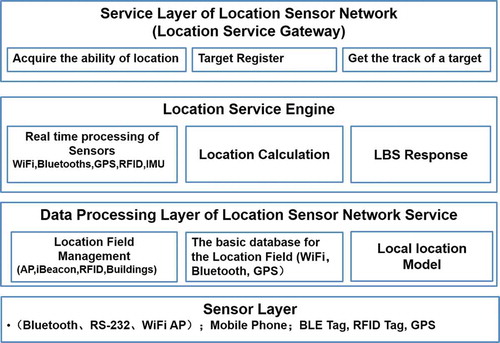
Additionally, we propose an architecture of location-based sensors that work to process positioning data as shown in . The first layer is the sensor layer, in which all kinds of sensors are connected to the location sensor network. The second layer is the data processing layer, including location field management, the database for the location field and the local location model. The third layer is the location service engine. Real-time information from the sensors is processed in real time. Then, the locations of targets are calculated. This layer fulfills the requirements of Location-based Service (LBS). The fourth layer is a service layer, which can process all location requirements depending on HTTP rules.
Figure 5. Structure of sensor networks.
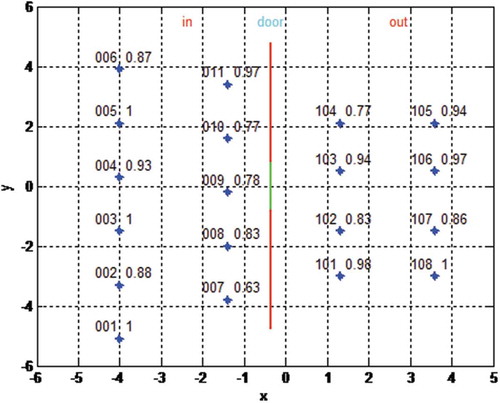
Based on the developed algorithm, we have a performance test with 270 training samples, including 110 indoor samples and 160 outdoor samples, and 1620 testing samples, including 660 indoor samples and 960 outdoor samples. It is calculated that the average accuracy is 0.8981. demonstrates the indoor and outdoor test points with their positioning accuracy. According to the illustration, the points near the door have lower accuracy than indoor and outdoor area.
Figure 6. Results of positioning experiment.
(2) Understanding locations by natural language analysis
Many methods exist for describing locations; however, one of the most important is natural-language location descriptions, such as “the main entrance to Wuhan University is near the intersection of Bayi Road and South Luoshi Road”. Using this example, for a computer to understand the location as described, it must understand how to acquire the location of Bayi Road and South Luoshi Road and translate “intersection” into a spatial correlation where the two roads cross. However, in Chinese, natural language location descriptions are complex and the available research is limited. Two other major problems exist in current natural language location descriptions: first, the accuracy of extracted words is insufficient, making the extracted set incomplete; second, location semantic models are not used to calculate and disambiguate the words, making the description of a conceptual location inaccurate. In other words, the existing techniques cannot match people’s cognition or their descriptions. Natural language description of a location is one kind of semantic location description. Therefore, this paper extended the Semantic Location Model mentioned above and established a location description model to better understand natural language locations. A natural language location description is composed of a generalized place name and spatial correlation of objects. The generalized place name consists of a POI, an address name or a place name. The spatial relationships enrich the content in the semantic location model based on the features of the described locations. The details of the model are illustrated in .
Figure 7. Natural language location description model.
Based on the Natural Language Location Description (NLLD) model, the P2S defines the Location Concept Ontology (LCO), which includes the Basic Location Concept Ontology (BLCO) and the Location Entity Concept Ontology (LECO). The BLCO specifies the atomic words in a semantic location description, while the LECO indicates the location’s spatial entity or its correlation with other locations. For example, the location description “Hubei Province” is a spatial entity, and it consists of two BLCOs (Hubei and Province). After establishing the LCO, further work needs to be done to complete the NLLD, such as extraction, matching, disambiguation, and spatial computation.
illustrates the processes of analyzing and understanding a natural language description of a location. For a given location description statement, first, a Trie structure is built using the Chinese phonetic alphabet and features while traversing the current statement. The purpose of this step is to gather all the basic geographical vocabularies, which are used in the next step. Thus, this method not only consists of efficient extraction but also supports the specific location conceptions using fuzzy syllables and missing words. Next, these results are matched to seek an optimal matching position concept collection of objects based on a hierarchical matching graph. Then, the closest description data records based on fuzzy queries of the database are obtained, and the optimal position is calculated based on the spatial relationship between the spatial and semantic disambiguation position and co-occurrence. Co-occurrence is the process by which GIS semantic descriptions of words are obtained to calculate the final expression according to people’s habits of cognition and description(Rheingold Citation2007; Turner Citation2006). After analyzing the semantics of a location, the position of the described location can be obtained and visualized on a map.
Figure 8. Processes of location analysis and understanding.
3.4. Semantic location association
The First Law of Geography states that “everything is related to everything else, but near things are more related than distant things” (Tobler Citation1970). Ignoring the spatial relationship in any data analysis may lead to overlooking many possible interactions and spatio-temporal dependencies among locations in decision-making processes. Spatio-temporal differentiation is inevitably non-stationary when the same policy has been implemented or perceived differently across space and over time, by different persons, or by different socioeconomic or partisan groups. Through a feature analysis of multi-source ubiquitous information on spatio-temporal benchmarks, spatio-temporal semantics, express models, and qualities, it is possible to summarize the internal spatio-temporal relations of ubiquitous information to build formal descriptions and expressions.
By adopting the spatio-temporal relation analysis of ubiquitous information and exploring it with qualitative reasoning, it is also possible to extract the spatio-temporal relations for spatial positions (addresses and geocoding), spatial forms, spatial relations, spatial associations, spatial contrasts, spatial trends, spatial motions, time series, and time cycles of locations. Furthermore, it is possible to obtain in-depth knowledge of these relations between locations. Such knowledge and relations include spatio-temporal distributions, clustering patterns, spatio-temporal anomalies, trend predictions, spatial co-location patterns, sequential patterns, and cycles. All these can offer comprehensive ubiquitous information concerning all aspects of locations. To help in describing these, the location-based association model is presented in .
Figure 9. Location-based association model.
As shows, the location-based association model provides us the possibility of finding the internal spatio-temporal relations of ubiquitous information, and building the knowledge of these relations between locations. However, the issue of how to build these connections between locations and users remains to be discussed. Appropriate information is required to be able to provide filtered information to appropriate users. For this, links among users and the context, as well as the related information, are necessary.
Note that users’ identities would change based on the function of the places they find themselves. For example, the same user may be a student at the school, but become a patient when entering a hospital a customer at the shopping mall, or simply a pedestrian on a sidewalk. Based on the function of the location of a P2S user, a unified description of the users is necessary. P2S users can be divided into the administrative staff, service providers, service acceptors, and other personnel. The location-related contexts include the user context, time context, location context, and task context.
Accordingly, a location-relatedcontext model can be built as shown in . A trifold relation between a user and the context information is presented instead of binary relation in traditional recommender systems. The model is context-aware and is adaptive to dynamic changes in users’ preferences. It can be used both indoors and outdoors. In addition, ubiquitous information for all aspects of locations as well as POIs can be recommended to the appropriate users based on a set of a priori defined rules.
Figure 10. Location-related context model.
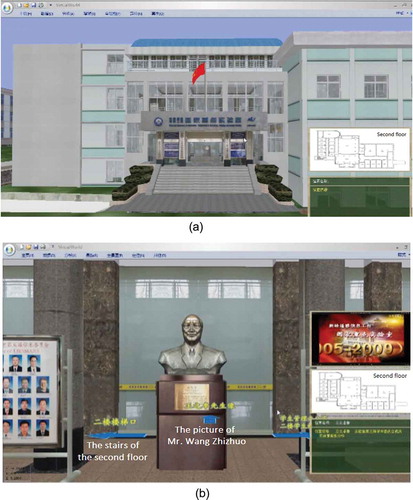
A location-based information recommendation system was proposed in which the test area was the “State Key Laboratory of Information Engineering in Surveying, Mapping and Remote Sensing (LIESMARS)”. shows that when a visitor arrives at the front door of “LIESMARS,” the system pushes information important for “LIESMARS”, such as the spatial layout of the floor, as well as the office locations of important people (). When the visitor enters the hall of “LIESMARS,” based on an analysis of the visitor’s location and the orientation of the visitor’s movements, the system automatically find and associate all interesting information for this visitor and push it to the visitor. For example, the head sculpture of Professor Wang Zhizhuo that stands in the entrance hallway, and the layout of the first-floor landing as well as the graduate management office, and so on (See ). When a visitor climbs the stairs to the third floor, the recommended information pushed to the user might include academician Li’s office, student classrooms, and published papers hang on the wall. Users can explore this information if they are interested in finding out more.
Figure 11. (a) Location-based information visualization, and (b) location-based information recommendation.
3.5. 4D map visualization
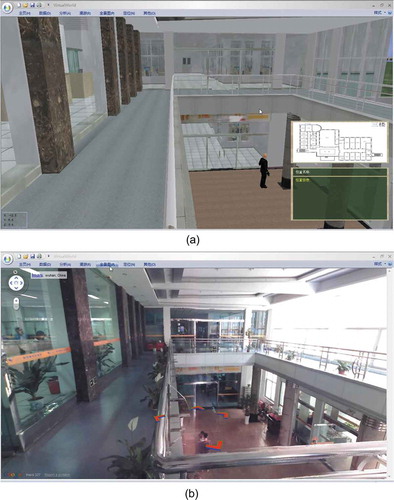
Different types of data from different sources and associated information can be linked or connected based on semantic location models and location-based association models. However, the issue of how to visualize them on maps had not been developed until P2S. Research shows that users assimilate information derived from spatio-temporal trends faster using animated maps than using static maps (Lee Citation1995). Similar discussions can be found in a growing list of studies concerning animation techniques and visualization criteria. As Goodchild mentioned (Engin, Bozkaya, and Balcisoy Citation2009), most GIS technologies focus on outdoor settings, but humans spend 87% of their time indoors. Therefore, the 4D map designed in P2S aims to establish a transitional model to integrate indoor and outdoor environments. This is implemented by incorporating a set of existing technologies that range from 3D models to panoramic views of locations. shows multiple visualization methods used in the 4D maps, including the outdoor 3D model and indoor panoramic views. The 3D model data is available via accessing the web address http://datadryad.org/review?doi=doi:10.5061/dryad.4d9s3.
Figure 12. (a) 3D models visualization, and (b) 3D models and panoramic integration visualization.
4. Results and discussion
P2S focuses on locations by integrating information from all sources related to the locations of users in the system. P2S has been designed to support applications that (1) require information from multiple sources over time, (2) involve multiple locations, and (3) depend on real-time dynamic visualization of information. P2S provides an example for a 4D GIS (i.e. 3D space plus time) and for how such a GIS can support decision-making processes and applications that rely on real-time and complex sets of information.
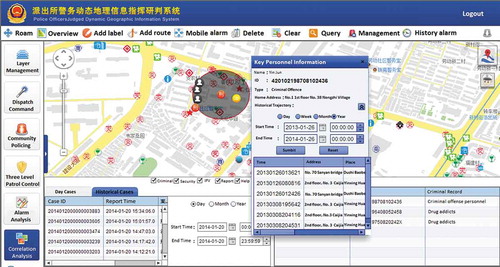
To illustrate the structure and composition of a P2S, the next several sub-sections describe a dynamic GIS that supports police and law-enforcement activities and policy-making processes. This example system integrates human resource, police intelligence, and location attribute information. This P2S is a user-centric system that uses 4D dynamic visualization of integrated information. Of special note is its ability to integrate indoor and outdoor information as well as above and underground information. It provides a seamless environment that can support applications such as all-inclusive surveillance, emergency management, and comprehensive planning. The P2S described here was designed for police work to support data and intelligence management, intelligence analysis for crime investigation and prevention, policing task assignments, and communication among police and law-enforcement agencies.
4.1. Data management
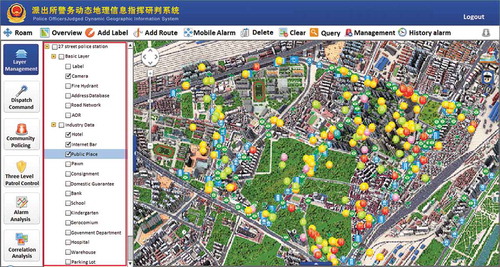
Depending on different police needs, different data layers could be added into the P2S. The basic layers in this example include boundaries, streets and street addresses, water hydrants, the locations of surveillance video cameras, and so forth. shows some additional data layers, including hotels, bars, pawn shops, public recreational spaces and facilities, banks, schools, daycare centers, hospitals, warehouses, parking lots, garages and so forth. In addition to data associated with geographical coordinates, many types of data stem from the text where the geographical coordinates are not recorded. For example, if a policeman gets a call in which someone tells him there is a robbery in progress at No. 71 on Sanyang Road in Jiangan District, P2S would be able to instantly push relevant information to the closest policeman, making nearby streets, shops, bus routes, traffic conditions and so on available. This would be convenient not only for generating fast responses to the crime but also in mining the spatio-temporal patterns of crime patterns in the city for the future.
Figure 13. Layers visualization.
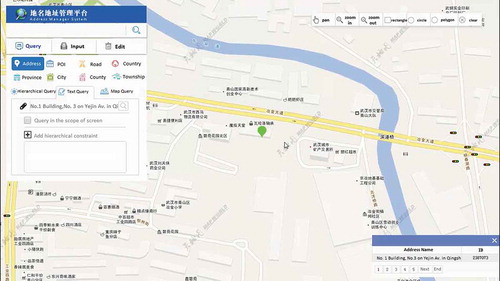
The method for translating from natural language location descriptions to map locations is presented in Section 3.3. demonstrates the address management system, providing geolocation query, input and edit function for natural language location descriptions. The query function allows users to search place names in a certain category such as address and POI. The query results will be displayed as a table on the top of the map, and users can interactively select and highlight them on the map. The import function allows users to upload data into the database from the pre-defined tabular format. The edit function allows users to select a query result from the database and edit the components of the place.
Figure 14. Address management system.
4.2. Command center
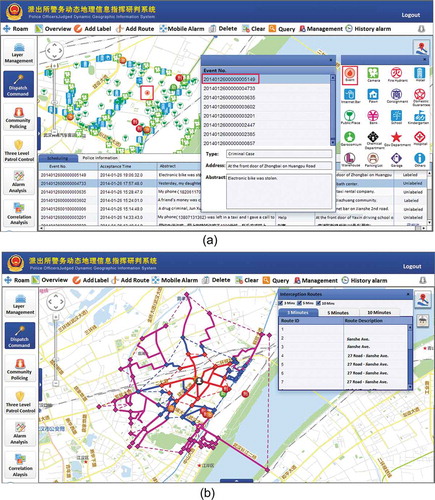
As shown in ), police commands can be issued with the support of an integrated spatio-temporal decision support system such as the police P2S presented here. For any location where certain events occur that require police commands, (1) the location can be identified, (2) all attribute information related to the location is readily available or can be easily extracted for reference, (3) real-time information can be generated and provided to dispatched patrols or other police units, and (4) updates or edits of related information to reflect the occurrence of any incident can be performed in real time. Please note that a set of tools are also available on the upper right corner of the display (as shown in )) that supports police tasks. For example, 911 calls and other alerts are reported in real-time to allow timely decisions and actions.
Another example illustrating how police P2S supports police tasks can be seen in ). After a robbery has occurred and is reported, the P2S quickly analyzes system data such as the street networks, police resources near the site, and potential obstacles nearby. It then suggests possible escape routes from the location that criminals are likely to take in 3, 5 and 10 minutes. The command center then provides quick access for communicating with or dispatching police to intercept the escaping criminals.
Figure 15. (a) Location attribution representation, and (b) location based interception analysis.
4.3. Patrol system
Three levels of patrolling assignments were implemented in the example police P2S, including the major artillery patrols, main street patrols, and community street patrols. P2S supports the management and monitoring of patrol activities with integrated maps and attribute data. The three-level hierarchy allows police patrols be carried out by specific task forces with specific functions assigned at each level. The police response time drastically improved after implementing the P2S.
4.4. Intelligence analysis
Analysis of police intelligence depends on the severity of the crime, available police resources, and the urgency of police intervention. In areas with urgent needs or emergencies, P2S provides integrated and comprehensive data at the fingertips of commanding officers that assist in making timely decisions. The example police P2S analyzes previous (and existing) crime records related to the crime being investigated to provide a crime reoccurrence risk estimate, which can suggest a reasonable allocation of police resources in response to the crime and its location. The P2S visualizes all these in a 4D environment with real-time data inputand highlights routes to which police resources can be dispatched.
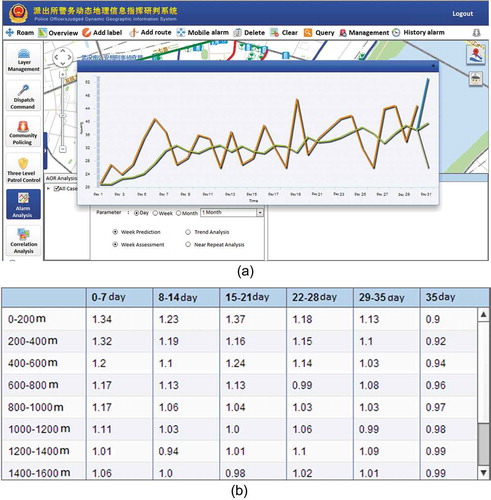
Beyond planning and implementation crime responses, the police P2S also supports analysis of past crime records. It can calculate various crime statistics by day, week, or month using a time series exponential smoothing method. This allows the detection of temporal trends for a variety of crime types. ) provide examples of such a function in the P2S. The P2S shows the calculated temporal trends of crime activities in a given location, and estimates the risks of crime reoccurrences at a site and in nearby locations, revealing the locations of high-value and high-risk crimes.
Figure 16. (a) Temporal trends of crime activities, and (b) spatio-temporal analysis of crime activities.
4.5. Location analysis
Last but not least is the function in P2S that supports location analysis. Based on real-time police intelligence, historical records of similar crimes and past criminal records, P2S allows police personnel to query, summarize, and simulate crimes to reveal potential suspects and potential locations to focus on. These queries and simulations are supported by maps and other visualization methods using both current and historical records. For example, after a reported (recorded) crime site is selected, the police P2S reports (1) potential suspects, providing information about their current and historical records, (2) similar crimes in the past, and (3) other locations where similar crimes occurred. This function proves to be highly useful for assisting the detectives investigating crimes. As shown in , such integrated visualization is critical in allowing detectives to quickly access information that they need and to assess possible suspects and locations.
Figure 17. Location-based integrated visualization assessing possible suspects.
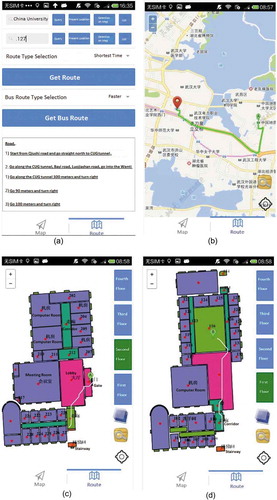
For public security, timely and effective crowd evacuation under emergency situation is one of the most important issues. Thus, the P2S provides navigation function for users in a seamless environment, from maps showing outdoor environments to indoor settings, showing what locations look like both aboveground and underground when needed. In this research, one of the university building is considered as the test area to verify the effectiveness of proposed method and it will be applied in other public places. For outdoor positioning, the system uses GPS for locations. For indoor positioning, the system uses the Wi-Fi fingerprinting technology described in Section 3.3. shows the indoor/outdoor seamless navigation system. In ), a user selects a start point and an end point; both locations can be described in either indoor or outdoor place. Then, the navigation system first shows the outdoor route as demonstrated in ). When the user arrives at a transition point between indoors and outdoors, the navigation map shows the route from outside to inside the target as presented in ,d), accurately coordinating 3D spatial location (2D Geographical coordinates and floor information) of the user. For the indoor display, the system visualizes detailed information of each floor including functional zones, corridors, and so forth.
Figure 18. (a) Start point and end point selection, (b) outdoor navigation, (c) indoor navigation from outside to the 2nd floor, (d) indoor navigation from the 2nd floor to the 1st floor.
5. Conclusions
Big data analytics has gained considerable momentum in recent years through advances in computation and visualization technologies, and from the arrival of new data sources such as social media sites. However, how to correlate and present the data is a challenging problem. The capabilities of current geographical information systems are limited. “Cartography” does not seem to be one of the options even though all these activities revolve around and are dependent on mapping. “Cybercartography”, a term coined by Taylor and Lauriault, is the most related to this paper’s research. However, it considers less about big data association but more about traditional cartography methods.
This paper proposed a P2S that demonstrated the feasibility of handling large and complex data appropriately. There are several merits of the P2S. (1) A new Semantic Location Model (SemLM) is established to present the semantic concepts and location features and describe how locations are interrelated. (2) Extending the Semantic Location Model mentioned above, this paper also established a location description model and Trie structure-based location analysis method to understand complex natural language locations better. (3) Indoor and outdoor seamless positioning and visualization methods are implemented, providing effective representation to indoor-outdoor navigation and other applications. (4) The P2S takes public security as background and is used to improve the efficiency of police work and provide helpful information to decision makers. Overall, the P2S address Hellmi’s call of “We will redefine mapmaking through computation cartography. This means maps are created on demand to meet a specific purpose, to help govern an individual action, to help answer a personal question” (Huang et al. Citation2016).
In the near future, an increasing amount of data will be collected and accessible (Chong, Qin, and Ye Citation2016). This data will be sourced from the Internet, industry, social networks, and sensor networks. Thus, the P2S needs to develop the capability to process large volumes of data in an affordable time frames to advance research in various fields. In addition, this paper proposes a semantic location model and successfully applies it to understand the descriptions of locations in the Chinese language. In the next step, the model will be used and tested with locations described in the English language. Furthermore, in future case studies, building new and essential capabilities for scalable visualizations and analytics on the dynamics of geographical patterns and processes using cyber-infrastructure will be critical to all research communities affiliated with the social, behavioral, economic, and environmental sciences. Thus, additional research areas such as socioeconomic and environmental sciences will also be considered beyond the public security field described in this paper.
Additional information
Funding
Notes on contributors
Xinyan Zhu
Xinyan Zhu is a professor at Wuhan University. He received his Ph.D. in cartography and geographical information system at Wuhan University. His research interests are spatial-temporal data analysis and spatial databases.
Tao Hu
Tao Hu received his Ph.D. in cartography and geographical information system at Wuhan University in 2015. Currently, he is the post-doctoral researcher at the center for geographical analysis in Harvard University. His research interests include spatial data analysis and innovation studies.
Xinyue Ye
Xinyue Ye received his Ph.D. at the University of California at Santa Barbara. Currently, he is the associate professor at College of Computing in New Jersey Institute of Technology. He integrates social science and computational science towards information visualization, urban informatics and spatial social network analysis.
Wei Guo
Wei Guo received his Ph.D. in remote sensing. His research interests include spatial data analysis, natural language processing, and indoor real time mapping and navigation.
Liang Huang
Liang Huang received his Ph.D. in cartography and geographical information system. He is interested in the researches of spatial analysis, geoinformation, and traffic flow analysis.
Hanjiang Xiong
Hanjiang Xiong is a professor at Wuhan University. He received his Ph.D. in cartography and geographical information system. His is interested in the researches of distributed spatial database organization, web-based 3D model visualization, and 3D model reconstructions.
Haojun Ai
Haojun Ai is a professor at Computer Science School in Wuhan University. His research interests include signal processing and content analysis of audio and video, network of things system design and application.
Bing She
Bing She receeived Ph.D. in cartography and geographic information engineering from Wuhan Unviersity. His research interests include spatial data integration and CyberGIS.
Qing Xiong
Qing Xiong received his Ph.D. in photogrammetry at Wuhan University. His research topics include 3D model construction and reconstruction.
Lian Duan
Lian Duan received Ph.D. in cartography and geographic information engineering from Wuhan Unviersity. He has the expertise in urban crime patterns in space and time with geo-spatial analytics and machine learning methodologies. His academic interests focus on the understanding of geographical environments of local crimes, as well as offenders mobility predictions.
References
- Anagnostopoulos, C., V. Tsetsos, and P. Kikiras. 2005. “OntoNav: A Semantic Indoor Navigation System.” Paper presented at the 1st Workshop on Semantics in Mobile Environments (SME05), Ayia.
- Becker, C., and F. Dürr. 2005. “On Location Models for Ubiquitous Computing.” Personal and Ubiquitous Computing 9 (1): 20−31. doi:10.1007/s00779-004-0270-2.
- Cangialosi, A., J. E. Monaly, and S. C. Yang. 2007. “Leveraging RFID in Hospitals: Patient Life Cycle and Mobility Perspectives.” IEEE Communications Magazine 45 (9): 18−23. doi:10.1109/MCOM.2007.4342874.
- Chong, Z., C. Qin, and X. Ye. 2016. “Environmental Regulation, Economic Network and Sustainable Growth of Urban Agglomerations in China.” Sustainability 8 (5): 467. doi:10.3390/su8050467.
- Couclelis, H. 2010. “Ontologies of Geographic Information.” International Journal of Geographical Information Science 24 (12): 1785−1809. doi:10.1080/13658816.2010.484392.
- Crampton, J. W. 2009. “Cartography: Maps 2.0.” Progress in Human Geography 33 (1): 91−100. doi:10.1177/0309132508094074.
- Di Donato, P. 2010. “Geospatial Semantics: A Critical Review.” Paper presented at the International Conference on Computational Science and Its Applications, Netherlands, May 528–544
- Engin, B., B. Bozkaya, and S. Balcisoy. 2009. “Introducing Level of Detail to 3D Thematic Maps.” ICA GeoViz, Nottingham, UK.
- Farman, J. 2013. Mobile Interface Theory: Embodied Space and Locative Media. London: Routledge.
- Frank, A. U. 2001. “Tiers of Ontology and Consistency Constraints in Geographical Information Systems.” International Journal of Geographical Information Science 15 (7): 667−678. doi:10.1080/13658810110061144.
- Frank, A. U. 2003. “Ontology for Spatio-temporal Databases.” In Spatio-Temporal Databases, 9−77. Berlin, Germany: Springer.
- Gärdenfors, P. 2004. “How to Make the Semantic Web More Semantic.” In Formal Ontology in Information Systems, 19–36. Amsterdam: IOS Press.
- Goodchild, M. F. 2007. “Citizens as Sensors: The World of Volunteered Geography.” GeoJournal 69 (4): 211−221. doi:10.1007/s10708-007-9111-y.
- Goodchild, M. F. 2011. “Looking Forward: Five Thoughts on the Future of GIS.” Accessed November 2018. https://www.esri.com/news/arcwatch/0211/future-of-gis.html
- Goodchild, M. F., and A. Glennon. 2008. “Representation and Computation of Geographic Dynamics.” In Understanding Dynamics of Geographic Domains, 13−30. Boca Raton, FL: CRC Press.
- Graham, M., and T. Shelton. 2013. “Geography and the Future of Big Data, Big Data and the Future of Geography.” Dialogues in Human Geography 3 (3): 255−261. doi:10.1177/2043820613513121.
- Haklay, M., A. Singleton, and C. Parker. 2008. “Web Mapping 2.0: The Neogeography of the GeoWeb.” Geography Compass 2 (6): 2011−2039. doi:10.1111/j.1749-8198.2008.00167.x.
- He, S., and S.-H. G. Chan. 2016. “Wi-Fi Fingerprint-based Indoor Positioning: Recent Advances and Comparisons.” IEEE Communications Surveys and Tutorials 18 (1): 466−490. doi:10.1109/COMST.2015.2464084.
- Hu, Y. 2017. Geospatial Semantics. arXiv preprint arXiv:1707.03550. Ithaca, NY: Cornell University.
- Hu, Y., K. Janowicz, D. Carral, S. Scheider, W. Kuhn, G. Berg-Cross, P. Hitzler, M. Dean, and D. Kolas. 2013. “A Geo-Ontology Design Pattern for Semantic Trajectories.” Paper presented at the International Conference on Spatial Information Theory, New Mexico, USA, October 12–16.
- Huang, X., Y. Zhao, C. Ma, J. Yang, X. Ye, and C. Zhang. 2016. “TrajGraph: A Graph-based Visual Analytics Approach to Studying Urban Network Centralities Using Taxi Trajectory Data.” IEEE Transactions on Visualization and Computer Graphics 22 (1): 160−169. doi:10.1109/TVCG.2015.2467771.
- Jiang, B., and F. J. Ormeling. 1997. “Cybermap: The Map for Cyberspace.” The Cartographic Journal 34 (2): 111−116. doi:10.1179/caj.1997.34.2.111.
- Jiang, C., and P. Steenkiste. 2002a. “A Hybrid Location Model with A Computable Location Identifier for Ubiquitous Computing.” In UbiComp 2002: Ubiquitous Computing. Lecture Notes in Computer Science, vol 2498, edited by G. Borriello and L. E. Holmquist. Berlin, Heidelberg: Springer.
- Jiang, Y., X. Pan, K. Li, Q. Lv, R. P. Dick, M. Hannigan, and L. Shang. 2012. “Ariel: Automatic Wi-fi Based Room Fingerprinting for Indoor Localization.” Paper presented at the Proceedings of the 2012 ACM Conference on Ubiquitous Computing.
- Jobst, M., and T. Germanchis. 2007. “The Employment of 3D in Cartography—An Overview.” In Multimedia Cartography, 217−228. Berlin: Springer.
- Keßler, C., and C. J. Farmer. 2015. “Querying and Integrating Spatial–Temporal Information on the Web of Data via Time Geography.” Web Semantics: Science, Services and Agents on the World Wide Web 35: 25−34. doi:10.1016/j.websem.2015.09.005.
- Lee, J. 1995. “Map Design and GIS–A Survey of Map Usage Amongst GIS Users.” The Cartographic Journal 32 (1): 33−44. doi:10.1179/caj.1995.32.1.33.
- Li, D., and D. L. Lee. 2008. “A Topology-based Semantic Location Model for Indoor Applications.” Paper presented at the Proceedings of the 16th ACM SIGSPATIAL International Conference on Advances in Geographic Information Systems. Irvine, CA.
- Liang, R., H. Li, Q. Li, L. Ma, and H. Chen. 2011. “Construction of Semantic Location Model Based on Typonym Ontology.” Paper presented at the 2011 19th International Conference on Geoinformatics, Shanghai, China.
- MacEachren, A. M. 2017. “Leveraging Big (geo) Data with (geo) Visual Analytics: Place as the Next Frontier.” In Spatial Data Handling in Big Data Era, 139−155. Singapore: Springer.
- Rheingold, H. 2007. Smart Mobs: The Next Social Revolution. New York, NY: Basic Books.
- Stevenson, G., J. Ye, S. Dobson, and P. Nixon. 2010. “LOC8: A Location Model and Extensible Framework for Programming with Location.” IEEE Pervasive Computing 9 (1): 28−37. doi:10.1109/MPRV.2009.90.
- Taylor, D. R. F., and T. Lauriault. 2013. Developments in the Theory and Practice of Cybercartography: Applications and Indigenous Mapping, Vol. 5. Amsterdam: Elsevier.
- Tobler, W. R. 1970. “A Computer Movie Simulating Urban Growth in the Detroit Region.” Economic Geography 46 (sup1): 234−240. doi:10.2307/143141.
- Turner, A. 2006. Introduction to Neogeography. Newton, MA: O’Reilly Media, Inc.
- Williams, R. E. 1987. “Selling a Geographical Information System to Government Policy Makers.” Paper presented at the Annual Conference of the Urban and Regional Information Systems Association, Fort Lauderdale, FL.
- Worboys, M. 2011. “Modeling Indoor Space.” Paper presented at the Proceedings of the 3rd ACM SIGSPATIAL International Workshop on Indoor Spatial Awareness, Chicago, IL.
- Worboys, M., and K. Hornsby. 2004. “From Objects to Events: GEM, the Geospatial Event Model.” Paper presented at the International Conference on Geographic Information Science, Zurich, Switzerland.
- Zhao, D., Z. Lue, and X. Zhang. 2007. “Location and Its Semantics in Location-based Services.” Geo-spatial Information Science 10 (2): 145−150. doi:10.1007/s11806-007-0041-0.
- Zook, M. A., and M. Graham. 2007. “Mapping DigiPlace: Geocoded Internet Data and the Representation of Place.” Environment and Planning B: Planning and Design 34 (3): 466−482. doi:10.1068/b3311.