
 ?Mathematical formulae have been encoded as MathML and are displayed in this HTML version using MathJax in order to improve their display. Uncheck the box to turn MathJax off. This feature requires Javascript. Click on a formula to zoom.
ABSTRACT
A point zero represents a central geographical location of a city, which is essential for not only measuring distances, but also understanding the historical and/or cultural origin of a city. Although extensive studies have focused on delineating city centers, to our knowledge, no studies have paid attention to determining the location for a point zero. Here, our goal is to investigate various potential approaches for identifying such a location. Specifically, three typical approaches, geometric-based, topological-based, and thematic-based, are proposed to recommend point zeros and different scales, administrative divisions, kernel density surfaces, and regions enclosed by ring roads are used for analysis. The effectiveness of different approaches and scales are evaluated and compared by calculating an offset distance between recommended and actual point zero locations in 20 Chinese cities. Using the different approaches, the average offset distance for most Chinese cities is 2–4 km, and the thematic-based approach performs best. Both the topological-based and thematic-based approaches are less sensitive to the analyzed scale than the geometric-based approach. The results indicate that it is possible to determine the approximate location for a point zero from geographical data. Based on the buffer zone of such a location, an actual point zero may further be recommended.
1. Introduction
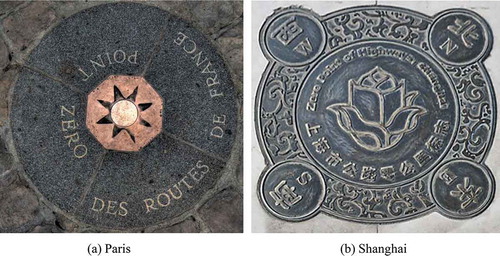
A point zero (or zero point) represents the central geographical location of a city. The point zero can also be termed the kilometer zero, from which all other locations can be measured as a distance. Point zeros have been marked in many cities. As shown in ), the point zero of Paris is located outside the Notre Dame Cathedral, a famous landmark, and embedded in concrete in a public square. The point zero of Shanghai is located at the People’s Square, as shown in ).
Determining the point zero of a city has many advantages. First, the original function of the point zero is measured. For instance, the distances to several landmarks in Guangzhou can be precisely measured from Guangzhou’s point zero. Furthermore, with point zeros for two or more cities, it is possible to precisely measure the distances between cities. Second, the point zero is usually a city landmark, e.g., Paris and Shanghai, which may attract visitors. Finally, the point zero may represent both the geographical city origin and the historical and/or cultural origin, and this is particularly true in China. Hence, point zeros may provide both visitors and local residents a better understanding of the development of a city. Given these benefits, a number of cities in China, e.g., Wuhan, Zhuhai and Changde, are considering or planning to designate point zeros, especially with the accelerated process of urbanization in China in recent years. Unfortunately, there are limited research works discussing approaches for determining an appropriate location or even a scope for point zeros. Few studies have addressed this problem because the site selection for a point zero is a complex process, which often considers geographical location and historical and/or cultural factors. As a result, most point zeros have been manually identified by experts, and then published by government agencies. The purpose of this study is to explore different approaches for locating the point zero.
Figure 1. Point zeros in Paris (a) and Shanghai (b).
Commonly, the point zero is located at the city center or core. Extensive studies have focused on delineating city centers, which differ based on their sources of data. For instance, socio-economic data (Thurstain-Goodwin and Unwin Citation2000; Pereira et al. Citation2013; Liu and Wang Citation2016), road network data (Borruso and Porceddu Citation2009; Sun et al. Citation2016; Zhou et al. Citation2015), land use data (Yue, Liu, and Fan Citation2010; Lüscher and Weibel Citation2013; Li, Long, and Dang Citation2018), big data (Hollenstein and Purves Citation2010; Roth et al. Citation2011; Yin et al. Citation2017), and remote sensing data (Taubenböck et al. Citation2017; Cai, Huang, and Song Citation2017), have been used for delineating city centers.
However, while a delineated city center is often a polygon or surface, the point zero is a position or coordinate (with longitude and latitude). None of the above studies have investigated: whether a delineated city center can be used as a scope to select the site for a point zero, or whether the most appropriate point zero is located inside such a delineated city center. More importantly, not any study have determined the location for a point zero or even the scope required for site selection. Indeed, this study is motivated by the fact that a number of Chinese cities are considering or planning point zeros, but there remains a lack of research on how to determine such a location for each city. Therefore, the purpose of this study is to explore approaches for locating the point zero in a city through investigating a total of 20 Chinese cities whose point zeros have already been determined. These approaches may further be used by urban planners, geographers and/or government officials to recommend an appropriate location or scope for a city whose point zero has not yet been determined. Here, we used different approaches to recommend such a location, and validated the recommended location by comparison with the actual point zero. Specifically, three different approaches, geometric-based, topological-based, and thematic-based were used, and different scales, administrative divisions, kernel density surfaces, and regions enclosed by ring roads were included in the analysis. To our knowledge, this may be the first study to explore approaches and scales for locating a point zero.
The remainder of this manuscript is structured as follows: Section 2 gives out a review of existing research work on delineating city centers. Section 3 describes the design of a series of approaches and scales to explore the location of point zero in a city. Section 4 describes the study area and data. Section 5 reports and analyzes the experimental results. Sections 6 and 7 provide the discussion and conclusions, respectively.
2. Related works
As point zero is often located at the city center or core, this section reviews an amount of research work on delineating city centers. These research work can be classified according to the source of data.
(1) Socio-economic data: Pereira et al. (Citation2013) introduced the concept of urban centrality, which can be calculated using employment and population data because their densities in city center are often higher than that in outlying areas. Thurstain-Goodwin and Unwin (Citation2000) used Kernel Density Estimation (KDE) approach to transform post code data from dense points into continuous surfaces to delineate town centers. Similarly, Borruso and Porceddu (Citation2009) used KDE approach to identify the Central Business District (CBD) based on a density analysis of human activities, e.g., retail, banks, arts, and culture, selected from the Yellow Pages. Liu and Wang (Citation2016) explored polycentric urban development in 318 cities of China using detailed gridded population data. Liu and Liu (Citation2018) examined the role of urban polycentric planning in the polycentric evolution process of Beijing using employment data.
(2) Road network data: Borruso and Porceddu (Citation2009) proposed two approaches, grid-based and kernel density analysis, to analyze the density of road junctions in a road network. The KDE network has also been used to demarcate the CBD (Yu, Ai, and Shao Citation2015). Jiang and Liu (Citation2012) proposed a block-based approach to detect natural cities and the topological center of a geographic space. Hao, Zhu, and Zhong (Citation2015) improved the efficiency of the block-based approach. Zhou (Citation2015) further compared these approaches, i.e., grid-based approach, kernel density analysis approach and block-based approach, and investigated the most appropriate thresholds for their parameters (Zhou and Guo Citation2018). In addition, many studies (Porta, Crucitti, and Latora Citation2006; Yin et al. Citation2018) have used various centrality measures, i.e., degree, closeness, and betweenness, to investigate the pattern and structure of an urban road network. Some of these measures, e.g., closeness, may be used to delineate city centers.
(3) Land use data: Yue, Liu, and Fan (Citation2010) investigated polycentric urban development in Hangzhou (China) based on land use information. Lüscher and Weibel (Citation2013) delineated a city center based on land use data from a topographic database, for the purpose of acquiring cartographic knowledge. Zhu and Sun (Citation2017) used commercial data because a city center is commonly related to commercial land enterprises. Li, Long, and Dang (Citation2018) used the Points of Interest (POI) data to identify Live-Work-Play centers in Chinese cities, because the POI data can potentially be used for land use mapping (Jiang et al. Citation2015). Keeratikasikom (Citation2018) also used the land use data and found that urban density decreased outward from the city center.
(4) Big data: Recently, the rapid expansion of big data in urban studies has become widespread in China (Hao, Zhu, and Zhong Citation2015) and worldwide. Big data can include different types, such as mobile phone, smart cards and check-in data. Hollenstein and Purves (Citation2010) verified that city centers can be described using Flickr data, i.e., via geo-tagged photos. Hu et al. (Citation2015) further used geo-tagged photos to extract and understand urban areas. Roth et al. (Citation2011) used the “Oyster” card database to understand the polycentric configuration of a city. With social network data, Yin et al. (Citation2017) described a method to delineate urban boundaries from check-in data, i.e., from Twitter. Zhen et al. (Citation2017) also used check-in data from Sina Weibo to delineate the boundary of the Yangtze River Delta urban agglomeration in China. Sun et al. (Citation2016) compared different clustering approaches to identify city centers. Zhou et al. (Citation2015) used both mobile phone data and check-in POI data to identify different types of activity centers in Shenzhen, China, including those for employment, residential, and recreation purposes.
(5) Remote sensing data: In comparison, only a few studies have considered delineating city centers using remote sensing data. This omission is likely because socio-economic features are almost undetectable from remote sensing data (Liu et al. Citation2015), especially for those with low- and medium-resolution. Nevertheless, Taubenböck et al. (Citation2013) developed a method to delineate CBD from a combination of digital surface models and remote sensing data. Taubenböck et al. (Citation2017) further used remote sensing data to measure polycentric urban regions. Cai, Huang, and Song (Citation2017) proposed a method to identify both the main center and the sub-centers of a polycentric city by combining nighttime light imagery and check-in data.
Although a lot of research work focused on delineating a city center, to the best of our knowledge, none of them have explored the location of a point zero. Therefore, we proposed approaches for exploring the point zero.
3. Methods
3.1. Approaches for exploring the point zero
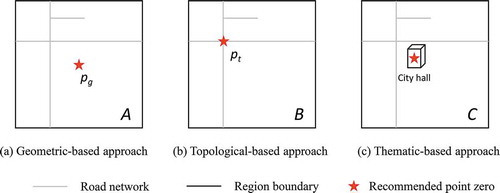
An actual point zero was often determined by a group of experts, who may recommended different candidate locations (e.g. various landmarks) in a city. Each candidate location was commonly recommended by considering two factors: (1) the point zero was located in or close to the central geographical location of a city; (2) the point zero was embedded in an open space. These candidate locations were compared and discussed by experts, and then the most appropriate one was selected as the point zero. Thus the procedure for determining a point zero seems to be a thematic-based approach. However, this study proposes three approaches, not only the thematic-based approach, but also the geometric-based and topological-based approaches to explore a point zero (as shown in ). This is because a large number of landmarks in a city may be recommended as candidate locations, and thus it is desirable to determine the most appropriate one or to reduce the analyzed scope. Moreover, in addition to the thematic-based approach, both geometric-based and topological-based approaches may also be used to determine the central geographical location of a city, and thus it is worth to evaluate the effectiveness of each approach and also to compare different approaches.
Figure 2. Three typical approaches for exploring point zero.
3.1.1. Geometric-based approach
The tenet of this approach is to use the geometric center of an area as the recommended point zero. The area may be an urban area or administrative division, because the boundary of an urban area is hard to be precisely delimited. As an example, ) shows the area A and its geometric center pg (the red star in )), the latter is viewed as the recommended point zero for this area.
3.1.2. Topological-based approach
In this approach, the topological center of a road network is viewed as the point zero. Several centrality measures, e.g., degree, closeness and betweenness, may be employed as they have been widely used to determine the importance of each node (or intersection) in a road network. In this study, we employed the measure-closeness because many prior studies have verified that this measure is applicable to determine the topological center of a road network (Porta, Crucitti, and Latora Citation2006; Yin et al. Citation2018). The closeness measure (Ci) calculates the inverse of the average shortest path from a node (i) to all other nodes in a road network, and is defined as follows:
where, d(i, j) denotes the shortest path from node (i) to node (j) in a road network, and k represents the number of nodes in this network. Generally, a relatively larger closeness value of a node indicates that it is closer to the topological center of a road network. Therefore, in this study, the maximum closeness value is used to identify the recommended point zero. ) shows a schematic road network and its topological center pt (the red star in )). The location of star pt, which has the maximum closeness value, is the recommended point zero for area B.
3.1.3. Thematic-based approach
The tenet of this approach is that a place’s importance in the center of a city can be used to distinguish a point zero. This may be a landmark or location of local government (e.g., city hall or town hall). In this study, the location of city hall was considered, because it is generally unique among the several landmarks in a city. ) shows that the city hall in this area is the recommended point zero.
3.2. Scales for analysis
An appropriate scale should be considered using these approaches, especially for the geometric-based and topological-based approaches. This is because both the geometric center of an area and the topological center of a road network may vary with different shapes and/or sizes of a given area, although this is commonly not the case for the thematic-based approach. In this study, three possible scales are used: administrative division, kernel density surface, and region enclosed by a ring road.
3.2.1. Administrative division
An administrative division is a portion of a country or region delineated for the purpose of administration, which may include different levels of administrative divisions, e.g., provincial, prefecture, and county. Normally, a recommended point zero may vary with different levels.
3.2.2. Kernel density surface
KDE is an approach to analyze the density of features (usually points or lines) in geographical space. Many studies have used the KDE approach to delineate urban areas and/or centers (Thurstain-Goodwin and Unwin Citation2000; Zhou Citation2015; Yu, Ai, and Shao Citation2015). The principle of the KDE approach is to calculate the density of each feature by considering the neighboring features within a certain radius or bandwidth. Theoretically, a smoothly curved surface, which is called the kernel density surface, may be produced to delineate an area wherein the density of each feature is higher than a certain threshold.
3.2.3. Region enclosed by ring road
A ring road is often a road or a series of roads encircling a city. The most common purpose of a ring road is to reduce the traffic volume in the urban center. Therefore, the region enclosed by a ring road may also be used to explore the point zero, because the geometric or topological center of such a region may represent the urban center. Commonly, the number of ring roads varies in cities, and some cities even do not have ring roads.
3.3. Validation
Our approach for validation is to calculate the Euclidean distance (or called the offset distance) between the calculated and actual point zeros. Here, a smaller offset distance indicates a better result. In addition, several statistical parameters, including the maximum distance, minimum distance, average distance, and standard deviation, are used to evaluate the results.
4. Study area and data
4.1. Study area
There were 20 Chinese cities whose point zeros have been determined, and all these cities were used as study areas. These cities were considered for three reasons. First, a number of Chinese cities are considering or planning the appropriate location for a point zero. Therefore, proposing an approach to determine such a location or scope is relevant and timely. Second, all the cities are located in different regions of the whole country: Shanghai and Wuxi in eastern China, Chengdu and Chongqing in western China, Harbin in the north, and Guangzhou and Zhongshan in the south. This broad selection across the country should minimize the subjectivity of using only one or few study areas for analysis. Third and most important, the point zeros for these 20 cities have already been determined. Thus, for each city, the actual point zero can be used as a reference to compare with the calculated result.
4.2. Data
Three types of data were incorporated in the analysis: administrative division, road network, and Baidu Map.
The administrative division data of China were freely downloaded from the from the National Catalogue Service For Geographic Information (http://www.webmap.cn/main.do?method=index). The levels of administrative division datasets of China are available, provincial, prefecture, and county. Datasets of prefecture-level (i.e., the administrative boundary of each city in China) and county-level (i.e., sub-divisions of a prefecture-level division) were used in this study.
The road datasets for the 20 studied cities were obtained from OpenStreetMap (OSM, https://download.geofabrik.de/index.html), which is a free map of the world provided by global volunteers. Because the quality of OSM data has not been fully vetted, there may be some unforeseen errors. However, authorized road datasets are not provided freely to the public by mapping agencies or commercial companies in China. In this case, the purpose of using road network data is both to explore the topological center of the road network in each city and to extract the regions enclosed by one or multiple ring roads.
Baidu Map is a web mapping application developed by Baidu Company. Based on this application, the geographic coordinates of the location of the city hall and various ring roads, e.g., inner ring road and outer ring road, can be determined.
5. Results
The proposed approaches were implemented in ArcGIS 10.5, the standard commercial software for Geographic Information System (GIS). The topological center of an analyzed road network was calculated using the “Urban Network Analysis” toolbox, which was developed by the City Form Lab (Sevtsuk and Mekonnen Citation2012) and installed in ArcGIS.
5.1. Results using administrative divisions
lists the offset distances between actual and those recommended point zeros identified by using the geometric-based and topological-based approaches in this study. Additionally, the offset distances at the prefecture-level and county-level administrative divisions in China are calculated and presented.
Table 1. Offset distances using geometric-based and topological-based approaches with prefecture-level and county-level administrative divisions.
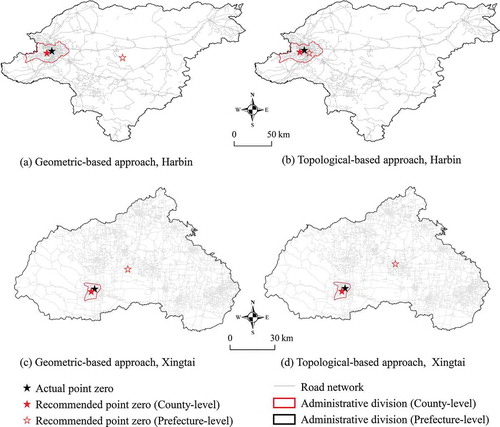
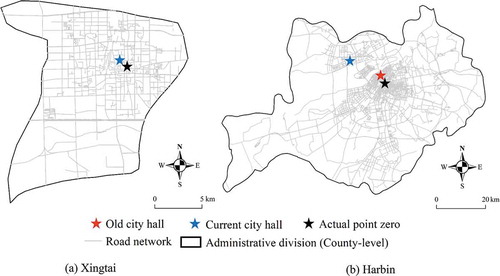
shows that, in terms of different administrative divisions, the offset distance at prefecture-level is generally much larger than that at county-level, especially using the geometric-based approach. For example, using the geometric-based approach, the offset distances at the prefecture-level for Harbin and Xingtai are respectively 148.7 km and 40.6 km, more than an order of magnitude larger than those for the county-level in both study areas, 11.6 km and 3.8 km. This significant difference arises because the urban area is not always located in the geographical center of the administrative district (as shown in ) and ()). Therefore, the offset distance increases as the analyzed region expands, i.e., from county- to prefecture-level division. However, this significant divergence is not as extreme for the topological-based approach and the offset distances analyzed using different administrative divisions are much smaller. For example, using the topological-based approach, the offset distances for Harbin are 2.6 km and 2.1 km at the prefecture-level and county-level, respectively. The results from the two administrative levels are in better agreement because there are much denser roads in urban than in rural areas ()), and thus the topological center of a road network is located inside an urban area (Porta, Crucitti, and Latora Citation2006). Although a recommended point zero may still deviate much from the actual point zero location, e.g., Xingtai in ), the topological-based approach is relatively less sensitive than the geometric-based approach to the size of the analyzed region.
Figure 3. Recommended point zeros in Harbin and Xingtai at prefecture-level and county-level division.
5.2. Results using kernel density surfaces
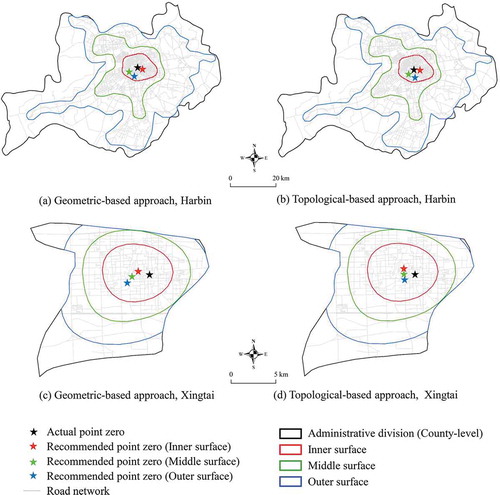
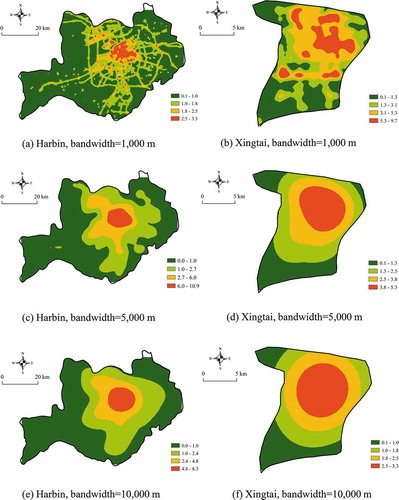
lists the offset distances between actual point zeros and those identified in this study using the geometric-based and topological-based approaches with different kernel density surfaces. For analysis, the bandwidth was fixed at 5,000 m after trying a number of different values. Moreover, three different density thresholds were automatically obtained using the natural breaks classification to produce three levels of kernel density surfaces to minimize the subjectivity of using only one kernel density surface for the analysis. These three levels, termed outer, middle, and inner surfaces, are shown in .
Table 2. Offset distances using geometric-based and topological-based approaches with different kernel density surfaces.
shows that the offset distances calculated with different kernel density surfaces, average 3.1–6.1 km, are smaller than that calculated using administrative divisions, average 4.0–45.9 km, especially for the geometric-based approach. The better agreement achieved using the kernel density surface is due to the dense road network inside the corresponding county-level division, which creates a relatively smaller size (). Moreover, the average offset distance tends to be smaller for a relatively smaller kernel density surface, e.g., the inner surface, which further supports reducing the analyzed scope to minimize the offset distance. The offset distances of the geometric-based and topological-based approaches are in good agreement, although those for the topological-based approach are generally smaller in terms of the maximum, average, and standard deviation of the offset distances.
Figure 4. Recommended point zeros in Harbin and Xingtai with different kernel density surfaces.
5.3. Results using regions enclosed by ring roads
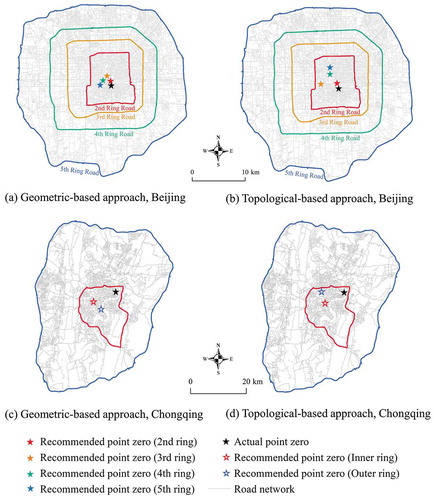
lists the offset distances between actual point zeros and those identified in this study using the geometric-based and topological-based approaches (termed recommended locations) with various types of ring roads for the analysis. For this analysis, only the 11 cities with at least one ring road were evaluated.
Table 3. Offset distances using geometric-based and topological-based approaches with various types of ring roads.
We further assess the performance achieved using the regions enclosed by ring roads by plotting the offset distance against the length of the ring road (). Based on a general overview of the data in and , four important results are obtained.
Figure 5. Relationships between offset distances and ring road lengths using the geometric-based (a) and topological-based (b) approaches.
The offset distances analyzed with ring roads are also smaller than those calculated using administrative divisions, especially using the geometric-based approach. The ring roads are generally built around an urban core and, more importantly, the region enclosed by a ring road is often smaller in area than that of either the prefecture-level or county-level administrative division. As we indicated previously, better results are achieved in smaller areas.
Using the geometric-based approach, the offset distance is positively correlated (R2 = 0.55) with the length of a ring road. However, there is a much lower correlation (R2 = 0.09) using the topological-based approach. This observation supports the hypothesis that the topological-based approach is less sensitive to the analyzed scale.
The offset distance tends to decrease using the topological-based approach (average 2.4 km), although the study area of Beijing is an exception ( and ). This difference is due to the much denser roads in the northern Beijing compared to the south. Thus the topological center is biased toward the north ()).
In addition, relatively larger offset distances are found in Chongqing because the actual point zero is located near the border rather than at the center of the region enclosed by the inner ring road ( and ). Chongqing is topographically unique compared to the other cities, and covered by a large area of rivers and mountains; therefore, the ring roads were built to accommodate these differing geographical conditions.
Figure 6. Recommended point zeros for Beijing (a, b) and Chongqing (c, d) using the regions enclosed by ring roads.
5.4. Results of the thematic-based approach
lists the offset distances between the actual point zeros and those calculated by the thematic-based approach. For each city, the current and old location(s) of city hall were considered because some city halls have been relocated since the urban development, e.g., in Chengdu and Shanghai. The longitudes and latitudes coordinates of the current city hall were obtained from Baidu Map. However, the coordinates for an old city hall are not always available. Therefore, the geometric centers of the old locations of the city hall buildings were used.
Table 4. Offset distances using thematic-based approach.
As shown in , city halls in 12 of the 20 cities had never been relocated. For current city halls, the offset distances are no greater than 4.0 km in 13 of the 20 cities because most city halls in China are located in the urban center ()), which indicates the effectiveness of the thematic-based approach. However, relatively larger offset distances are observed in Chengdu, Harbin, Wuxi, and Qinhuangdao because their city halls were relocated from an old urban center ()) to aid in urban development.
Figure 7. Comparison of actual point zero and the location of city hall in Xingtai (a) and Harbin (b).
In terms of the old city hall locations, the offset distances are not greater than 4.0 km in 19 of the 20 cities. Furthermore, the average offset distance, 2.0 km, is much smaller than those obtained using either the geometric-based or topological-based approaches (–). Clearly, the thematic-based approach performs best among these three different approaches.
6. Discussion
This study introduced three approaches, geometric-based, topological-based, and thematic-based to determine appropriate point zeros in 20 Chinese cities. The differences between the actual point zeros and those calculated using the proposed approaches, i.e., recommended locations, ranged from 2.4 km to 4.0 km on average. We found better agreement, i.e., average offsets of 2.0 km, when the old city hall location was used as the recommended point zero. These results indicate that it is possible to determine an appropriate area for choosing the point zero. However, the precise location has not yet been determined using the proposed approaches because the exact placement and spacing of the recommended point zero was not considered in this study. Here, the recommended point zeros using the topological-based approach were located at the intersection of a road network and those using the thematic-based approach were placed at city hall. An actual point zero is seldom built precisely at either a road intersection or city hall. Therefore, developing an approach to determine the precise location of a point zero is still required.
Our results showed that the thematic-based approach generally performs better than either the geometric-based or topological-based approaches based on average offset distance. However, the thematic-based approach did not always perform the best. For example, the offset distances for the city of Baoding are 1.6–3.6 km of the geometric-based and topological-based approaches (), which are smaller than that of the thematic-based approach (4.2 km, ). In addition, although the thematic-based approach can be further improved by considering additional city landmarks, determining appropriate typical landmarks will be difficult because landmarks often vary with between cities and multiple landmarks within a city are common.
In addition, both the geometric-based and topological-based approaches are more sensitive than the thematic-based approach to the analyzed scale. There are at least two parameters, bandwidth and density threshold, which are set to determine the kernel density surface. In this study, the bandwidth was empirically set to 5,000 m because a smaller bandwidth, e.g., 1,000 m, will result in a number of separate kernel density surfaces () and ()), from which choosing an appropriate one for analysis would be difficult. In contrast, a larger bandwidth, e.g., 10,000 m, will result in a relatively larger sized kernel density surface ( and ), which may potentially increase the offset distance (see Section 4.2). Although the density thresholds were automatically determined in this study, the recommended point zero may vary with different density thresholds. The topological-based approach will likely also vary with different road datasets, because the road data in OSM are continuously updated. More importantly, previous studies have found that the OSM data in China are far less complete than other developed regions in the world (Barrington-Leigh and Millard-Ball Citation2017; Zhou and Tian Citation2018; Tian, Zhou, and Fu Citation2019). However, it was not possible to investigate the impact of the less complete road dataset, because the corresponding reference road datasets produced by authoritative mapping agencies or commercial companies are not freely available.
Figure 8. Kernel density surfaces produced by different bandwidths.
Despite these limitations, this study is a first attempt to explore approaches and scales for identifying point zeros. Based on the results and advantages and disadvantages of the approaches, we suggest using either the topological-based or thematic-based approach to calculate an approximate point zero because these two approaches are relatively less sensitive to the analyzed scale. When applying the topological-based approach, using a region enclosed by a ring road is preferential. However, in the absence of a ring road, a kernel density surface maintains adequate performance. When applying the thematic-based approach, the location of old city hall provides good performance.
The next step in defining a point zero is to produce a buffer zone with the calculated location as the center of a circle and an empirical offset distance, e.g., 2–4 km, as the buffer radius. Moreover, all famous city squares and landmarks in the buffer zone can be chosen as candidate point zeros. In 14 of these 20 Chinese cities studied here, the point zeros are located at the city squares, e.g., People’s Square in Shanghai (). The point zeros of other cities are located at parks, e.g., Congtai Park in Handan; tourist attractions, e.g., Zhili Govern-general’s Office in Baoding; or road intersections, e.g., intersection between Wenwu Road and Louguo Road in Chengdu (as shown in ). Finally, a number of experts and members of the public may be asked to rank each candidate point zero, which can be used to finalize the most appropriate one.
Figure 9. Point zeros in some typical Chinese cities.
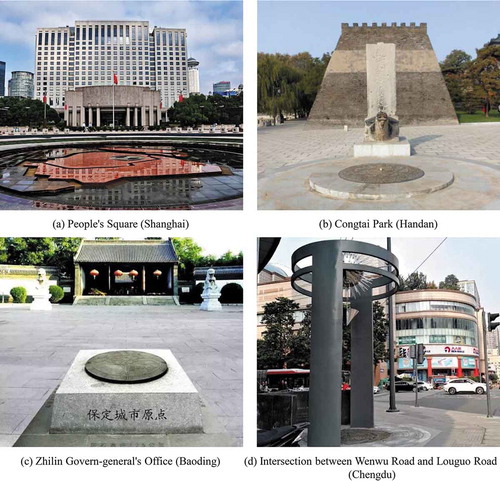
Table 5. Actual point zeros in 20 Chinese cities.
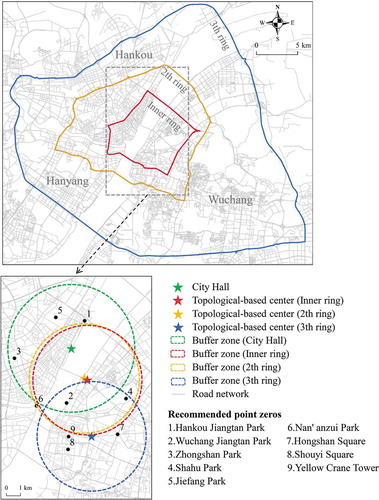
Furthermore, the city of Wuhan (China) was also chosen for the analysis. Wuhan is not only one of the ten largest cities in China, but also a typical polycentric city including three urban areas, Wuchang, Hankou and Hanyang. Moreover, Wuhan is being considered to designate a point zero. shows the buffer zones (all with a radius of 4.0 km) of the approximate point zeros calculated using both the topological-based and thematic-based approaches. A number of recommended point zeros, including squares, parks and landmarks inside those buffer zones, were further determined. Interestingly, two of these point zeros (No.1 and No.6 in ) have also been recommended by local government officials. This illustrates that: first of all, it is possible to recommend an appropriate point zero with our proposed method. Second, no matter using the topological-based or thematic-based approach, it is needed to combine thematic information (e.g. squares, parks and landmarks) for the recommendation. Third, an appropriate location for the point zero is usually located inside the main center (e.g. the inner ring) rather than sub-centers of a city. Moreover, our proposed method is also applicable to a polycentric city.
Figure 10. Recommended point zeros for Wuhan, China.
These proposed approaches have several additional applications. First, they can be used to determine an appropriate scope or scale for choosing the point zero, which can benefit local residents in understanding the history and culture of their city and provide new city landmarks. Second, these approaches can be used to detect the urban and historical centers of a city, as evidenced by our results showing that point zeros were in close proximity to old city halls rather than current city halls. Therefore, it may be possible to understand city development using the movement of city halls or other city landmarks (Ayhan and Cubukcu Citation2010).
7. Conclusions
This study designed several approaches to explore the locations of point zeros in Chinese cities. Three proposed approaches, geometric-based, topological-based, and thematic-based, and three different scales, administrative divisions, kernel density surfaces, and regions enclosed by ring roads, were evaluated. These approaches and scales were tested and validated for 20 Chinese cities. For each approach and scale, the calculated point zero was compared with the corresponding installed point zero using the offset distance between them. The minimum, maximum, average, and standard deviation of the offset distances were also calculated.
Our data indicates that in most cases, the average offset distances for these 20 Chinese cities were 2–4 km using the different approaches. This consistency between the different approaches suggests that they are effective for determining an approximate point zero. Of the three approaches, the thematic-based, which considers the location of old city hall, performed the best. The offset distances calculated using the geometric-based approach had a distinct positive correlation with the size of the analyzed scale. In comparison, the topological-based and thematic-based approaches were less sensitive to analyzed scale.
Furthermore, a method to recommend candidate point zeros was also proposed. This method first uses either the topological-based or thematic-based approach to calculate an approximate point zero; based on the buffer zone of which location, a number of squares, parks and landmarks may be recommended as candidate point zeros. To our knowledge, this study was the first attempt to explore the point zero using quantitative approaches. Nonetheless, a number of issues should be considered in the future. First, an approach should be developed to determine the precise point zero of a city that accounts for the historical and/or cultural characteristic(s). Second, in addition to the various scales used in this study, administrative divisions, kernel density surfaces, and regions enclosed by ring roads, other possible scales may be considered, such as urban centers and/or areas delineated using different source data (Sun et al. Citation2016; Zhou Citation2015). Moreover, in addition to the current and/or old city halls, other landmarks, e.g., parks or city squares, may be considered using the thematic-based approach. Finally, the proposed approaches and/or scales should be verified for other cities and/or regions worldwide.
Acknowledgments
We wish to thank Mr. Saisai Zhao and Ms. Shijia Sun for their technical supports on data processing, and the anonymous reviewers whose comments have greatly improved this paper.
Additional information
Funding
Notes on contributors
Qi Zhou
Qi Zhou is an associate professor in School of Geography and Information Engineering, China University of Geosciences (Wuhan). He received his Ph.D. in the Department of Land Surveying and Geo-Informatics at Hong Kong Polytechnic University. His research interests include the assessment and use of VGI and open data in urban topics.
Mingjian Zhai
Mingjian Zhai is an undergraduate student in School of Geography and Information Engineering, China University of Geosciences (Wuhan).
Wenhao Yu
Wenhao Yu is an associate professor in School of Geography and Information Engineering, China University of Geosciences (Wuhan). His research interests include map generalization and data mining.
References
- Ayhan, I., and K. M. Cubukcu. 2010. “Explaining Historical Hrban Development Using the Locations of Mosques: A GIS/Spatial Statistics-Based Approach.” Applied Geography 30 (2): 229–238.
- Barrington-Leigh, C., and A. Millard-Ball. 2017. “The World’s User-Generated Road Map Is More Than 80% Complete.” PLoS One 12 (8): E0180698. doi:10.1371/journal.pone.0180698.
- Borruso, G., and A. Porceddu. 2009. “A Tale of Two Cities: Density Analysis of CBD on Two Midsize Urban Areas in Northeastern Italy.” In Geocomputation and Urban Planning. Studies in Computational Intelligence, edited by B. Murgante, G. Borruso, and A. Lapucci, 176. Berlin, Heidelberg: Springer.
- Cai, J., B. Huang, and Y. Song. 2017. “Using Multi-Source Geospatial Big Data to Identify the Structure of Polycentric Cities.” Remote Sensing of Environment 202: 210–221. doi:10.1016/j.rse.2017.06.039.
- Hao, J., J. Zhu, and R. Zhong. 2015. “The Rise of Big Data on Urban Studies and Planning Practices in China: Review and Open Research Issues.” Journal of Urban Management 4 (2): 92–124. doi:10.1016/j.jum.2015.11.002.
- Hollenstein, L., and R. Purves. 2010. “Exploring Place through User-Generated Content: Using Flickr Tags to Describe City Cores.” Journal of Spatial Information Science 1: 21–48.
- Hu, Y., S. Gao, K. Janowicz, B. Yu, W. Li, and S. Prasad. 2015. “Extracting and Understanding Urban Areas of Interest Using Geotagged Photos.” Computers, Environment and Urban Systems 54: 240–254. doi:10.1016/j.compenvurbsys.2015.09.001.
- Jiang, B., and X. Liu. 2012. “Scaling of Geographic Space from the Perspective of City and Field Blocks and Using Volunteered Geographic Information.” International Journal of Geographical Information Science 26 (2): 215–229. doi:10.1080/13658816.2011.575074.
- Jiang, S., A. Alves, F. Rodrigues, J. F. Jr, and F. C. Pereira. 2015. “Mining Point-Of-Interest Data from Social Networks for Urban Land Use Classification and Disaggregation.” Computers, Environment and Urban Systems 53: 36–46. doi:10.1016/j.compenvurbsys.2014.12.001.
- Keeratikasikom, C. 2018. “A Comparative Study on Four Major Cities in Northeastern Thailand Using Urban Land Density Function.” Geo-Spatial Information Science 21 (2): 93–101. doi:10.1080/10095020.2018.1455320.
- Li, J., Y. Long, and A. Dang. 2018. “Live-Work-Play Centers of Chinese Cities: Identification and Temporal Evolution with Emerging Data.” Computers, Environment and Urban Systems 71: 58–66. doi:10.1016/j.compenvurbsys.2018.04.002.
- Liu, X., and M. Wang. 2016. “How Polycentric Is Urban China and Why? A Case Study of 318 Cities.” Landscape and Urban Planning 151: 10–20. doi:10.1016/j.landurbplan.2016.03.007.
- Liu, Y., X. Liu, S. Gao, L. Gong, C. Kang, Y. Zhi, G. Chi, and L. Shi. 2015. “Social Sensing: A New Approach to Understanding Our Socioeconomic Environments.” Annals of the Association of American Geographers 105 (3): 512–530. doi:10.1080/00045608.2015.1018773.
- Liu, Z., and S. Liu. 2018. “Polycentric Development and the Role of Urban Polycentric Planning in China’s Mega Cities: An Examination of Beijing’s Metropolitan Area.” Sustainability 10 (5): 1–14. doi:10.3390/su10103546.
- Lüscher, P., and R. Weibel. 2013. “Exploiting Empirical Knowledge for Automatic Delineation of City Centres from Large-Scale Topographic Database.” Computers, Environment and Urban Systems 37: 18–34. doi:10.1016/j.compenvurbsys.2012.07.001.
- Pereira, R. H., V. Nadalin, L. Monasterio, and P. H. Albuquerque. 2013. “Urban Centrality: A Simple Index.” Geographical Analysis 45 (1): 77–89. doi:10.1111/gean.12002.
- Porta, S., P. Crucitti, and V. Latora. 2006. “The Network Analysis of Urban Streets: A Primal Approach.” Environment and Planning. B, Planning & Design 33 (5): 705–725. doi:10.1068/b32045.
- Roth, C., S. M. Kang, M. Batty, and M. BarthÉLemy. 2011. “Structure of Urban Movements: Polycentric Activity and Entangled Hierarchical Flows.” PloS One 6 (1): E15923. doi:10.1371/journal.pone.0015923.
- Sevtsuk, A., and M. Mekonnen. 2012. “Urban Network Analysis Toolbox. International.” Journal of Geomatics and Spatial Analysis 22 (2): 287–305.
- Sun, Y., H. Fan, M. Li, and A. Zipf. 2016. “Identifying City Center Using Human Travel Flows Generated from Location-Based Social Networking Data.” Environment and Planning. B, Planning & Design 43 (3): 480–498. doi:10.1177/0265813515617642.
- Taubenböck, H., M. Klotz, M. Wurm, A. Krehl, and S. Siedentop. 2013. “Delineation of Central Business Districts in Mega City Regions Using Remotely Sensed Data.” Remote Sensing of Environment 136: 386–401. doi:10.1016/j.rse.2013.05.019.
- Taubenböck, H., I. Standfuß, M. Wurm, A. Krehl, and S. Siedentop. 2017. “Measuring Morphological Polycentricity-A Comparative Analysis of Urban Mass Concentrations Using Remote Sensing Data.” Computers, Environment and Urban Systems 64: 42–56. doi:10.1016/j.compenvurbsys.2017.01.005.
- Thurstain-Goodwin, M., and D. Unwin. 2000. “Defining and Delineating the Central Areas of Towns for Statistical Monitoring Using Continuous Surface Representations.” Transactions in GIS 4 (4): 305–317. doi:10.1111/1467-9671.00058.
- Tian, Y., Q. Zhou, and X. Fu. 2019. “An Analysis of the Evolution, Completeness and Spatial Patterns of Openstreetmap Building Data in China.” ISPRS International Journal of Geo-Information 8 (1): 35. doi:10.3390/ijgi8010035.
- Yin, C., Y. Liu, X. Wei, and W. Chen. 2018. “Road Centrality and Urban Landscape Patterns in Wuhan City, China.” Journal of Urban Planning and Development 144 (2): 05018009. doi:10.1061/(ASCE)UP.1943-5444.0000441.
- Yin, J., A. Soliman, D. Yin, and S. Wang. 2017. “Depicting Urban Boundaries from A Mobility Network of Spatial Interactions: A Case Study of Great Britain with Geo-Located Twitter Data.” International Journal of Geographical Information Systems 31 (7): 1293–1313. doi:10.1080/13658816.2017.1282615.
- Yu, W., T. Ai, and S. Shao. 2015. “The Analysis and Delimitation of Central Business District Using Network Kernel Density Estimation.” Journal of Transport Geography 45: 32–47. doi:10.1016/j.jtrangeo.2015.04.008.
- Yue, W., Y. Liu, and P. Fan. 2010. “Polycentric Urban Development: The Case of Hangzhou.” Environment & Planning A 42 (3): 563–577. doi:10.1068/a42116.
- Zhen, F., Y. Cao, X. Qin, and B. Wang. 2017. “Delineation of an Urban Agglomeration Boundary Based on Sina Weibo Microblog ‘Check-in’ Data: A Case Study of the Yangtze River Delta.” Cities 60: 180–191. doi:10.1016/j.cities.2016.08.014.
- Zhou, Q. 2015. “Comparative Study of Approaches to Delineating Built-Up Areas Using Road Network Data.” Transactions in GIS 19 (6): 848–876. doi:10.1111/tgis.12135.
- Zhou, Q., and L. Guo. 2018. “Empirical Approach to Threshold Determination for the Delineation of Built-Up Areas with Road Network Data.” PLoS One 13 (3): E0194806. doi:10.1371/journal.pone.0194806.
- Zhou, Q., and Y. J. Tian. 2018. “The Use of Geometric Indicators to Estimate the Quantitative Completeness of Street Blocks in Openstreetmap.” Transactions in GIS 22 (6): 1550–1572. doi:10.1111/tgis.12486.
- Zhou, X., J. Liu, A. G. O. Yeh, Y. Yue, and W. Li. 2015. “The Uncertain Geographic Context Problem in Identifying Activity Centers Using Mobile Phone Positioning Data and Point of Interest Data..” In Advances in Spatial Data Handling and Analysis, edited by F. Harvey and Y. Leung, 107–119. Cham: Springer.
- Zhu, J., and Y. Sun. 2017. “Building an Urban Spatial Structure from Urban Land Use Data: An Example Using Automated Recognition of the City Centre.” International Journal of Geo-Information 6 (4): 122. doi:10.3390/ijgi6040122.