
ABSTRACT
Increasing population in urban areas and limitations of suitable lands for developing houses and urban infrastructure have led to the vertical development in cities. However, these developments are managed by a cadastral system which is mainly two-dimensional and cannot efficiently represent Rights, Restrictions, and Responsibilities (RRRs) in complex scenarios. In fact, a three-dimensional cadastre is required for efficiently registering and representing RRRs. In this paper, a 3D proximity analysis was proposed and implemented to determine RRRs and associated easement rights in non-topology-based data structures. This method can be used to investigate the surrounding spaces of a subject apartment unit or storage in a high-rise. The performance of the developed method was evaluated in a large complex high-rise in Tehran, Iran. The results confirmed that the proposed method can correctly identify the neighbor spaces in complex scenarios.
1. Introduction
Population growth and shortage of land are common challenges in urban areas that have led to increased development of high-rises and complex buildings above and below the ground surface. As property privatization initially began with the division of land by two-dimensional (2D) models, it became the basis for the land registry (Stoter Citation2004). In many countries, land and property information is stored in a 2D system (Shojaei et al. Citation2015), which leads to 2D land registration and representation methods, while the real world is three-dimensional (3D). Mapping the 3D world into a 2D model causes various limitations and inefficiencies (Shojaei Citation2014; Zhao, Yan, and Zhang Citation2018). For example, it is very hard for the public to understand their rights by looking at 2D cadastral plans. The relationship between the property object (e.g. parcels) and right-holder(s) is the basis of every land administration system. In addition to rights, there can also be restrictions or responsibilities between the property objects and the right-holder(s) (van Oosterom et al. Citation2006). This emphasizes the importance of having an efficient system for recording Rights, Restrictions and Responsibilities (RRRs).
A 3D digital cadastre can facilitate understanding and recording RRRs in complex buildings and structures. Furthermore, some 3D analysis tools can be built in a 3D digital cadastre to facilitate managing RRRs. For example, one of the difficult tasks in high-rises and complex buildings is finding neighbors and affected rights around a subject apartment unit in the design, develop and maintenance phases of a structure.
Defining RRRs in complex buildings is an error-prone process, which is conducted manually by surveyors for preparing cadastral plans. Due to the complexity of high-rises, finding the affected RRRs is not an easy task and requires lots of checking especially in easement cases. In these situations, benefited and burdened lots must be accurately identified in cadastral plans. For example, some parking spaces and storages might be very close to each other. Therefore, the rights of access might be required over a parking space. It means an easement right must be defined over the parking space to allow this accessibility. These rights might be difficult to identify in complex scenarios, therefore, the benefits of having some 3D analyses in a 3D cadastre system can facilitate identification, validation, and registration of RRRs in high-rises and complex buildings. Despite the extensive research carried out in the field of 3D analysis, there is a lack of research in this issue especially in the cadastral domain (Ellul and Haklay Citation2006; Biljecki et al. Citation2015; Zlatanova Citation2015; Li et al. Citation2016; Shojaei et al. Citation2017; Atazadeh et al. Citation2019).
Therefore, the research question underpinning this paper is how to facilitate finding neighbor 3D RRRs (e.g. easements) around other RRRs in high-rises for 3D cadastral purposes. To identify these RRRs, a 3D proximity analysis is required to identify neighbor RRRs in the proximity of a 3D space. However, there is a lack of research to use proximity analysis in 3D RRRs especially in the non-topology-based data structures. This study aimed to develop an innovative method for a 3D proximity analysis to detect neighbor RRRs in a 3D space in the domain of land administration. The outcome of this research can be used in other applications such as disaster management (Chen et al. Citation2014) to provide valuable information such as the location of building entry and neighbor spaces (Kwan and Lee Citation2005; Tashakkori, Rajabifard, and Kalantari Citation2015).
In order to design and develop an algorithm for 3D proximity analysis, a qualitative methodology was considered for describing, interpreting, and contextualizing this concept. First, a comprehensive literature review was conducted to review the previous relevant studies (Section 2) and an algorithm was proposed (Section 3). Then, a case study was defined for data collection, analyzing, and evaluation to identify the issues (Section 4). Finally, the conclusions derived through this study were addressed by presenting issues that require further research in Section 5.
2. An overview of relevant studies
3D proximity analysis was identified as a required analysis for 3D cadastral applications by Shojaei (Citation2014). However, its usage and the method of implementation have not been comprehensively investigated by researchers in the cadastral domain (Ying et al. Citation2011b).
3D GIS analyses have been categorized into four aspects into the context of virtual city models by Moser, Albrecht, and Kosar (Citation2010) including spread/flow analysis, 3D density, visibility analysis; and proximity or buffer analysis. Proximity or buffer analysis deals with identifying the surrounding area of a specific point or line. Moser, Albrecht, and Kosar (Citation2010) showed this analysis can help urban planners to propose a new station on the route of a subway in an urban area. Furthermore, Walenciak et al. (Citation2009) explained the implementation of a 3D buffer analysis in a web-based environment. The research was based on a 2D scenario and developed a new 3D-Web Processing Service (WPS) to process “BombThreatScenario3D”. It receives two input parameters, namely the location of the bomb in 3D coordinates and the explosive force in KG. The WPS creates two buffer zones, the security, and the danger zone, around the point.
In the context of 3D city models, sometimes buffer analysis is not sufficient and various 3D operations such as 3D intersection are required. For example, Chaturvedi (Citation2014) developed an on-the-fly 3D analysis. The emphasis is given to 3D buffer analysis techniques for preparing evacuation plans or doing other emergency scenarios in an urban area. Additionally, the functionality also includes the implementation of 3D operations such as 3D intersection, to determine the buildings, either completely inside or partially intersecting the buffer zones.
Spatial data structures have two types including topological and non-topological data structures. In a topological data structure, various researchers have investigated identifying neighbor objects based on topological relationships. For example: what 3D objects are located on top or under a certain 3D object? These analyses have been used in various domains such as noise, air pollution, and emergency situations (Lee and Zlatanova Citation2008).
In the cadastral domain, topological relationships can be utilized to identify relations among cadastral objects. Lee and Koh (Citation2007) proposed a conceptual 3D cadastral model in Korea to design a conceptual schema for a 3D cadastre. They performed topological analyses based on a 3D Network Data Model to identify spatial neighbors. They presented spatial queries based on topological relationships among 3D cadastre objects to access the adjacency information among apartment units.
Lee and Kwan (Citation2005) proposed an approach to find topological relationships among 3D objects such as buildings and their internal partitions. They proposed a combinatorial data model (CDM) which simplifies the topological relationships among 3D objects by a hierarchical network structure called the node-relation structure (NRS) using graph-theoretic formalisms.
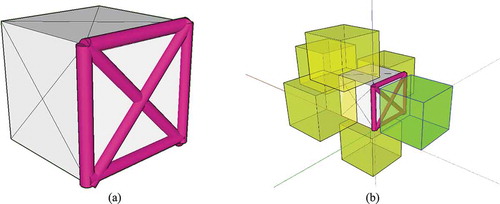
As shown in they applied spatial queries to detect neighbors within a building based on topological relationships. The query results are illustrated in ) which are the result of a spatial query to find adjacent rooms to TE210 which are sharing a vertical or horizontal wall with the TE210.
Figure 1. Adjacency relationships (Lee and Kwan Citation2005)
Lee and Zlatanova (Citation2008) also described some algorithms for 3D spatial data manipulation and analytics to implement a planning/decision-making process. They developed a 3D topological analysis (3D buffering) and an indoor navigation function to identify feasible and safe routes within a multi-level structure to navigate rescue personnel. They utilized spatial queries based on adjacency relationships among the 3D spatial units to find a 3D shortest route for evacuation from a building.
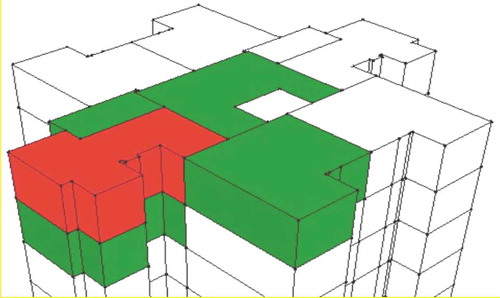
Ying et al. (Citation2011a) presented the design and development of a 3D cadastral prototype. They used a full 3D topological data structure and focused on how to build and represent the 3D cadastral objects by a solid model based on SketchUp. In this research, solid objects are represented by a set of planar faces as spatial boundaries, based on the Boundary Representation approach. Some editing operations such as splitting parcels and merging parcels are performed. Finally, they apply a query to the corresponding objects according to a 3D parcel to understand their neighbors. The red 3D property unit in is the selected one to query its neighbors through shared faces showed in green color.
Figure 2. Topological query (Ying et al. Citation2011a)
Finally, Emamgholian, Taleai, and Shojaei (Citation2017) proposed a novel approach for finding 3D neighbors in non-topological data. This approach, which is the initial result of their work, uses the coordinates of the corner of apartment units and by creating a 2D buffer around these points and finding the intersected apartment units, identifies the neighbor apartment units. However, this approach had some limitations to find all the 3D neighbors such as in a case that the target apartment unit was neighboring with more than one apartment unit. In this paper, their proposed approach was extended by using a 3D buffer around the edges (not only corner points) and mainly by exploring its application for finding the easement rights.
Despite the extensive research carried out in the last decade in the field of 3D spatial analysis, there is a lack of research on 3D proximity analysis based on non-topological data structures with a focus on 3D cadastre. According to the topology-based data structures, finding neighbor 3D objects can be easily identified by checking the common surfaces. However, for common 3D data formats such as Industry Foundation Classes (IFC), there is no proper topology in the data structure (Benner et al. Citation2010). Therefore, other methods are required to identify the neighbor 3D objects. The next section tackles this problem by designing and developing a method for 3D proximity analysis to identify neighbor RRRs around an object such as an apartment unit.
3. Designing a 3D proximity analysis
As discussed in the previous sections, finding neighbor 3D spaces in non-topology based data structures have not been comprehensively investigated. Therefore, a proper method to find neighbor 3D spaces is required especially in the 3D cadastre domain, which has specific requirements. This paper focuses on developing a method for 3D proximity analysis to identify neighbor RRRs around objects such as apartment units and storages.
To perform 3D analysis, the research focuses on 3D buffer analysis to create a buffer for finding neighbor lots and easement rights. It also aims to perform 3D operations such as 3D intersection to determine the 3D building objects, which are partially intersecting the created buffers. This implementation would be very helpful to automatically find neighbor RRRs.
In general, an apartment unit might have various neighbor units. presents all possible scenarios for the 3D neighborhood in voxel.
Figure 3. All possible proximity scenarios in voxel (Jjumba and Dragićević Citation2016)
However, the proximity scenarios in 3D cadastre might be very complex and some of the cases in might not be possible in the real world. Therefore, algorithms should be able to detect all possible situations. In the following section, the proposed method is presented.
3.1. 3D proximity analysis method
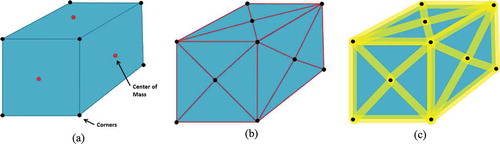
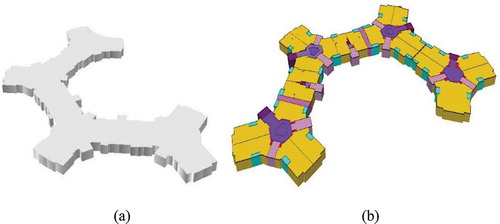
To find neighbor objects, a linear buffering method was utilized to detect the intersections. In this method, first, the subject apartment unit is selected. Then, the coordinates of all corners of the faces are extracted. Then, for each face, a center point (center of mass) is calculated (see )). This point is connected to the corners of each face. These center points help create more edges to detect the neighbor units which are not in the same size as the subject apartment unit ()).
Figure 4. (a) Calculating the center of mass of each face. (b) Creating edges by connecting the corners of each face to the center points. (c) Calculating buffers for each edge
By defining a 3D buffer around these edges and increasing the radius, intersecting units with this buffer could be determined as neighbor units ()). The amount of initial radius depends on the design of buildings and the spaces between the units.
To identify neighbor units in a specific location (e.g. below the apartment unit), edges are created by connecting the corners belong to the floor face to the center point. Then by creating a buffer around these edges and all edges of the floor face, intersecting units with the buffer are considered as lower neighbors. This process is repeated for all faces and all intersections are recorded. To visualize and store intersected apartment units, a unique code is added to the Geodatabase for apartment units.
As high-rises are usually complex, various scenarios might happen. As an example, in ), one face of one apartment unit is shown with a 3D buffer on the edges. Obviously, the size of the building’s elements e.g. slab, ceiling, roof, wall, etc. will affect the radius of the created buffer and the radius should be set based on the thickness of these elements. By increasing the radius of the buffer, other neighbor objects might intersect with these edges. As an example, some random apartment units are shown in ).
Figure 5. (a) A subject apartment unit with a face and buffered edges. (b) the same apartment unit with some random apartments around it
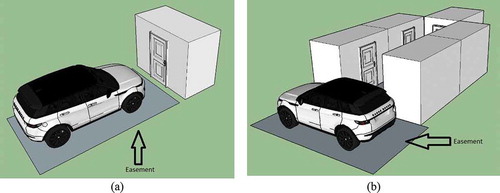
This method can also be used to identify affected RRRs around other RRRs. For example, in some cases, storages are not located in easily accessible locations in high-rises and tenants need to cross some parking spaces to access them or even the doors of these storages are opened by covering some spaces over the parking spaces. Therefore, in some countries (e.g. Iran) an easement right is defined over the parking spaces to provide this access. The proposed 3D proximity analysis can also be applied to these cases to detect these storages and define related easements on these parking spaces.
In this method, the storages are analyzed to make sure there is enough room to open their doors in the desired radius of 50 cm, which is a standard threshold for the right of access in Iranian Cadastral Regulations. If the door is very close (less than 50 cm) to the parking space, then an easement must be defined on the parking space to allow the owners to access their storage. In most cases, there are two possible situations:
In the first case, as shown in ), there is not enough space between the parking space and the door of the storage. Therefore, the owner of the storage needs to have access to the storage through the parking space. In this situation, an easement is defined on this space to allow accessing the storage.
In the second case, another common occurrence of easement rights between storages and parking spaces is when several storages are located in a corridor as shown in ). In this case, the owner of the storage needs to go through the parking space to have access to the storage.
Figure 6. (a) Easement on parking space for accessing the storage. (b) Easement on parking space to give access to a corridor including several storages
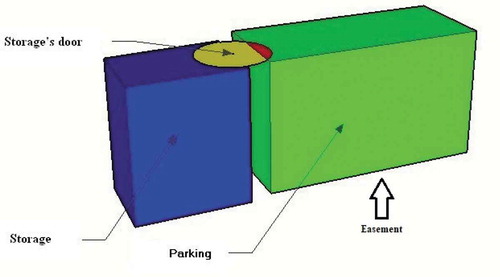
To identify storages in the first case, the position of their doors is modeled as a point geometry in the dataset to create a buffer (50 cm) around these points. If there is an intersection, the parking space is identified as an easement as shown in . If the parking space(s) owned by the same owner(s) as the storage, the owner of the storage has the right to use the parking space to open the storage door without defining an easement.
Figure 7. Storages close to parking spaces
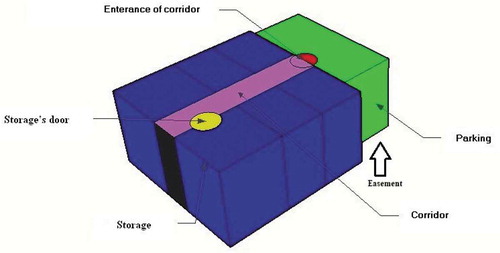
In the second case, as shown in ), the purpose is to identify parking spaces that block the corridors. To find these spaces, first, a buffer is created around the door of each storage to identify the corridors intersecting with them. Then, a buffer (50 cm) is created around the horizontal edges of the corridor spaces. If a parking space(s) is intersected with it and the parking space(s) has a different owner(s) from the storage lots, then the parking space(s) is defined as an easement to allow the owners of the storage(s) to have access to the storages through the parking space as shown in . After defining the easement right, the owner of parking space should allow the other owners to pass through the parking space to access their storage. This is a typical scenario in high-rises in Iran and the owner of the car park and storages need to collaborate to use these spaces. In this process, if none of the above-mentioned situations occurs, no easement right should be defined. To automate this method, a plug-in was developed which is discussed in the following section.
Figure 8. Identify parking spaces that block the corridor accessing the storages
3.2. Design and development of the 3D plug-in
The method (3D proximity and easement rights analysis) described in section 3.1 was designed and implemented in a plug-in in ArcScene (V10.2) using C# to analyze 3D RRRs. This plug-in can work on high-rises with the extrusion geometry modeling approach. The plug-in was implemented in three conceptual layers using ArcScene, Adobe Component and C# ().
Figure 9. Architectural framework (Arrows indicate the major data flow)
Based on , the data access layer provides required access to data formats (ESRI Shapefile, and PDF) for this plug-in. In the process layer, C# was chosen to provide a facility for developing the required functionalities and analyses. In the presentation layer, the ArcScene component visualizes the 3D model. ArcScene components can accurately represent 3D models and support MultiPatch geometry. In addition, the system can represent underground structures, support 3D measurement functionalities and visualize PDF data format, which is based on Adobe component. PDF file format is used for presenting the cadastral plans. Also, it provides administrative information regarding cadastral objects such as addresses, locations, and annotations.
The next section describes a case study to test the proposed method and the proficiency of the developed plug-in.
4. Case study implementation and evaluation
In Iran, the cadastre system is based on 2D plans. Registered surveyors are responsible for preparing building subdivision plans (Strata plans) and submitting them to the land registry in DWG format. Strata plans are prepared in a way that illustrates the distances and the areas of the properties for each floor separately. There is no roadmap for implementing a 3D digital cadastre in Iran at this stage. However, several researchers have investigated this possibility (Shirzad et al. Citation2014; Emamgholian, Taleai, and Shojaei Citation2017, Citation2018).
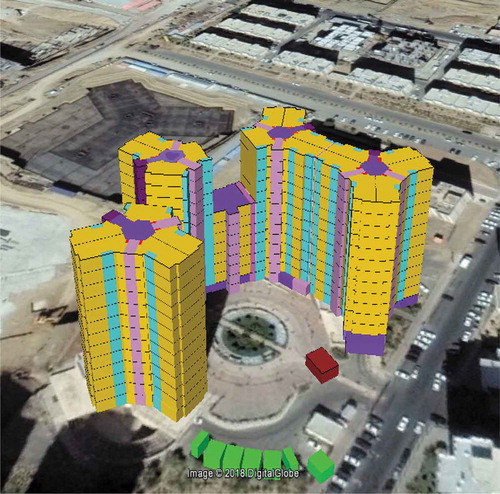
In order to test the proposed approach and evaluate the results, a complex high-rise building in Tehran, capital of Iran, was considered as a case study in this research. This high-rise includes 2360 spaces on 16 levels (3 underground basements) with 320 apartment units and 68 easements between car spaces and storages. This complex residential high-rise was selected as a case study to do a variety of evaluation scenarios. represents the case study.
Figure 10. A 3D model of the case study in ArcScene
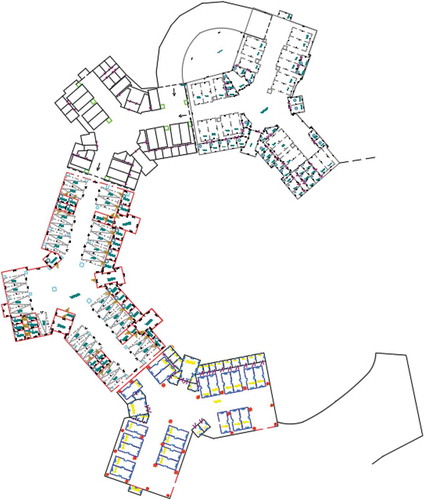
The cadastral plans of the case study in this paper were produced by a surveying company in DWG format as shown in .
Figure 11. Second basement in a 2D cadastral plan
After processing the two-dimensional cadastral plans (section 4.1), the spatial and descriptive information of the high-rise were imported into an ESRI Geodatabase (section 4.2). Then, the apartment units were visualized in ESRI ArcScene (section 4.3). In the next steps, the proposed methods, 3D proximity analysis, and easement rights analysis, were used (section 4.4) to identify RRRs around an apartment and also define easement rights. The following sections describe these further.
4.1. Processing 2D cadastral plans
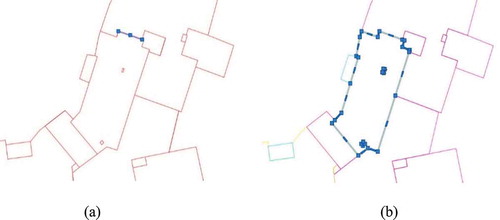
The cadastral plans in DWG format were imported into ESRI ArcScene for topological checks. These checks include (Ying, Li, and Guo Citation2011b): All polygons must be closed, The boundary of polygons must not self-intersect, Polygons must create a planar partition with no slivers or gaps between them (Emamgholian, Taleai, and Shojaei Citation2017), All lines must be connected and make 2D polygons () shows unconnected lines in the drawing which were fixed in ) after joining the corresponding lines to make a polygon), Each polygon has a specific height based on each level with related property information.
Figure 12. (a) Unconnected lines as part of a polygon in the cadastral plan (b) Related lines were connected to make a polygon after modification
4.2. Database creation
In this case study, ownership boundaries were defined in the ESRI Geodatabase in ArcScene. For simplicity of implementation, each level was defined separately in this Geodatabase. In addition, some descriptive fields, such as a unique code, were defined to facilitate the interaction between the programming language, the visualization software, and Geodatabase.
4.3. 3D visualization
To create 3D models, SketchUp and ArcScene were selected among the variety of 3D modeling tools. The reason for choosing these products is their flexibility to build 3D models and programming capabilities for required analyses in 3D.
Several methods exist for 3D object modeling including extrusion (Pouliot et al. Citation2011), Constructive Solid Geometry (CSG) (Jarroush and Even-Tzur Citation2004), Boundary Representation (B-rep) (Karki, Thompson, and McDougall Citation2010), Polyhedrons (Stoter Citation2004) and Regular Polytopes (Thompson Citation2007). In this paper, after the processing of 2D cadastral plans, the extrusion technique was considered to define 3D models for ownership rights. This technique was chosen as it can model most of the existing buildings in Iran according to their shape of ceilings and roofs. For example, a 3D object (such as an apartment lot) can be created by extruding the bottom polygon along the Z-axis for the defined height.
The subdivision plan was used to create RRRs. DWG files are all composed of discontinuous lines with different lengths. To use these drawings in the ArcScene the geometries were checked against the topological checks discussed in Section 4.1.
Also to make solid objects from the extruded footprints and also to have a better 3D visual perception for apartment units, extruded models were imported to Sketch Up and exported to Collada format and then added to ESRI ArcScene again as shown in .
Figure 13. (a) Extruded model. (b) Solid model of the Extruded footprints
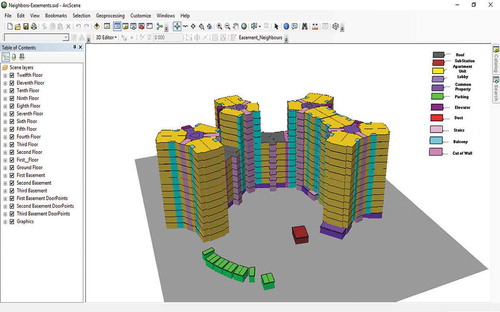
The final model of the high-rises with their underground basements is shown in . As this figure shows, the high-rises are very complex and have many overlapped RRRs which makes it a comprehensive case study for testing various scenarios. The next sections discuss the evaluation phase.
Figure 14. 3D model of high-rises in ArcScene
4.4. 3D proximity analysis evaluation
To evaluate the plug-in, in the first part, the 3D proximity analysis was tested in the case study. Then, in the second part, the easement identification analysis was evaluated in the same case-study to check the efficiency of the proposed approach in the plug-in. The identified easement rights and the results of the 3D proximity analysis were compared with the 2D cadastral plans.
In this step, to evaluate the proposed 3D proximity analysis method and the plug-in, several subject apartment units were selected to identify neighbor apartments at four directions (top, bottom, left and right). Then, the results were manually compared with the 2D cadastral plan as a source of truth to make sure the results are correct and accurate.
During the evaluation phase, in the initial step, the method could not find small spaces around the subject units without having the edges for the center points. The reason was, some small spaces were located above the base level of the subject units. Therefore, it was not possible to easily identify them using this method. To resolve this issue, the center point of each face was added to the method to create more buffers in the middle of the faces to bring accurate results.
Another improvement was distinguishing the type of RRRs after having 3D buffer intersections. For resolving this issue, a field was added to the Geodatabase to semantically define the entity type (parking space, apartment unit, and common property). Therefore, when 3D buffer intersects with those entities, their entity types are identified and reported.
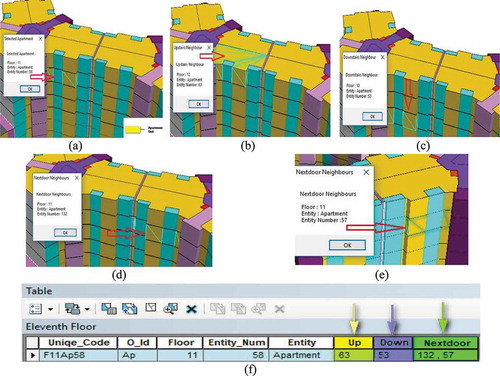
Since the thickness of the walls was not modeled in this case study due to limitations in accessing the architectural plans, the radius of the created buffer was set to 5 cm. ) shows the subject apartment, and ) to ) shows the results of determined neighbor apartment units. ) shows the recorded attributes in a table for future analysis. The comparison between the results which were stored in the database and the 2D imported cadastral plans confirms that the 3D plug-in is able to correctly detect the neighbors.
Figure 15. (a) Target apartment unit. (b), (c), (d) & (e) The upper, lower and adjacent neighbors. (f) Results stored in the associated table
4.5. Easement analysis evaluation
In the second phase of evaluation, the easement analysis was conducted to test the efficiency of the proposed method and the plug-in and the results were again compared with the 2D survey plan.
There are also four different cases for testing the easement rights between parking spaces and storages:
When a parking space is in front of a storage as an easement;
When two parking spaces are in front of a storage as two easements;
When a parking space is an easement in front of a corridor; and
When there is no parking space in front of the storages.
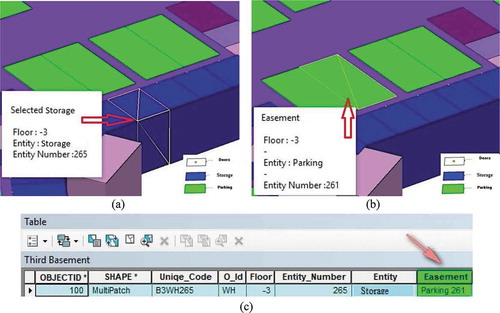
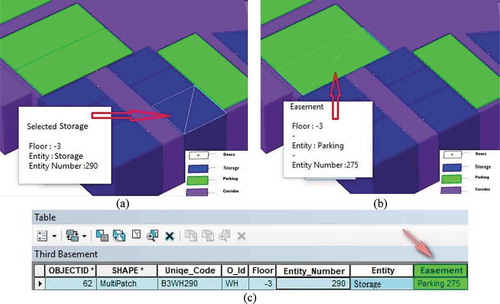
Using the developed tools, first, the locations of the storage doors were imported to the database and then, all the storage doors were tested to identify those which are close to the parking spaces or corridors. According to the results, 320 storage doors were identified and among them, the distance of 68 doors to the parking spaces was closer than the defied threshold (50 cm). In addition, two corridors were detected. Next, the easements were automatically assigned to the parking spaces. Finally, a report was created to list the affected parking spaces. This report was compared to the 2D cadastral plan. By fixing some minor data issues in the 3D model, all easements were identified using the developed plug-in and the results were compatible with the 2D cadastral plan. In ), a storage is selected, then using the developed plug-in the closest parking space was identified as shown in ), and as the distance of the parking space is less than the predefined threshold (50 cm) the easement right is stored in the table ()).
Figure 16. (a) Targeted storage. (b) Identified easement. (c) Results stored in the associated table
In addition, another scenario was presented in to test the applicability of the proposed method in a corridor. In this case ()), a storage at the end of a corridor was selected and the plug-in identified the parking space and assigned it as an easement as shown in (b and c) due to the distance of parking space and corridor.
Figure 17. (a) Target storage, (b) Identified easement, (c) Stored results in the associated table
Totally 320 neighborhood and 68 easement scenarios were tested to evaluate the proposed method and the plug-in. There was a parking space in front of a corridor and another side of the corridor was a common property. However, in the initial evaluation, the plug-in assigned an easement to this parking space. To tackle with this case, the method was refined in a way that if a buffer around the corridor intersects with a common property, there is no need to define an easement as there is direct access for the corridor through the common property.
5. Discussion and conclusion
After the evaluation of the plug-in in this case study some important points were identified which are discussed here further:
The proposed method worked well in this case study. This case study was significantly complex due to having many different scenarios in these high-rises. However, more high-rises can be tested to see the capability of this plug-in.
The thickness of the walls and ceilings were not considered in this case study due to limitations on accessing the architectural maps. However, having some initial tests showed the plug-in works fine in these scenarios. The threshold needs to be increased gradually to detect the intersections.
In Iran, shared walls are defined as median boundaries. In all apartment units in this case study, ownership boundaries were defined as the median.
In this case, study the data received in DWG format. However, the data can be in any format. The plug-in just needs to have the coordinates of the corners. The current accepted data format in Iran for cadastral plan submission is DWG. By considering a pathway toward a 3D cadastre in Iran, Building Information Modeling (BIM) is suggested to model the ownership boundaries as well as the physical structure of the building. This integration will facilitate the implementation of a 3D digital cadastre in Iran.
Defining easements on parking spaces brings limitations to these parking spaces in favor of other parties. This might affect the buyers of these units which have limitations on accessing their storages or parking spaces.
ArcScene has limitations on the size of the datasets. For massive datasets, ArcScene gets very slow to visualize and process the data. Therefore, other alternatives are required.
Due to increasing the number of overlapped multi-level developments, particularly in densely populated areas, there is a need for an effective and efficient 3D analysis for ownership boundaries. This paper highlights the importance of 3D analyses in a non-topological data structure intending to use 3D proximity to analyze neighborhood and easement rights in high-rises. In this research, the design and implementation of a 3D proximity analysis were discussed and two developed 3D analysis tools were presented and implemented as a plug-in in ArcScene. In this plug-in, 3D buffers are utilized to determine the neighbor units and car parks, partially intersecting with the buffers. Finally, the developed methods were tested using a case-study in various evaluation scenarios. The developed plug-in works on non-topological data structures based on coordinates of 3D objects. The plug-in can help surveyors and urban planners in their decisions for finding neighbor RRRs which is a manual and time-consuming task based on 2D cadastral plans in Iran.
The results show that the developed methods and tools are robust to investigate 3D spaces in complex apartments. These tools facilitate the identification of neighbor spaces and enhance the process of creating cadastral plans according to the regulations in Iran. The proposed method can be used at the design phase of building construction by providing a 3D model of the building and evaluating it before construction. This can benefit land surveyors and plan examiners to prepare and register strata plans respectively. Besides, it can be used by other stakeholders involved in the land administration process including developers, architects, property managers, and lawyers in various applications and scenarios. For example, architects can check their design by analyzing the accessibility of spaces by processing the common areas and spaces connected to them.
One of the challenges in this research was having access to proper 2D floor plans of buildings. This dataset was provided after contacting several surveying companies and discussing the research aim.
3D proximity analysis is also very important in various applications such as disaster management. For example, in the case of an emergency, it is essential to act quickly to find neighbor apartment units to mitigate the risk. Also, 3D proximity analysis can be used to determine the best positions for deploying ladders before firefighters enter an apartment unit.
Although there are many complexities in terms of apartments’ shape and their neighbors in this case study, some other case study models must be considered for testing the efficiency of this system as future work. In addition, further research is required to develop a proper data model for storing 3D subdivision plans. DWG format is a proprietary format and conversion is not simple. Therefore, the proposed data model also needs a data format for exchanging of cadastral plans according to the cadastral regulations in Iran. Furthermore, the cases presented in this paper to determine easement rights are based on horizontal analysis, doing a case to find easement rights in vertical direction could be considered in future works.
Additional information
Notes on contributors
Saeid Emamgholian
Saeid Emamgholian is Ph.D student in Geomatics Science at Université Laval, where he is working to develop a model that detects spatio-semantic conflicts among land-use regulations, especially those that comprise 3D components. His research interests are mainly 3D spatial analysis, 3D GIS, 3D cadastre, 3D city modeling, and 3D Geovisualization. He formerly was an M.Sc student at K. N. Toosi University of Technology.
Mohammad Taleai
Mohammad Taleai is Professor of GIS (Geo-Information) at Faculty of Geomatics, K. N. Toosi University of Technology, Tehran, Iran. His recent research focuses on the Deep Learning & Artificial Intelligence for Geospatial Applications, Volunteered Geographic Information (VGI), Location-Based Social Networks (LBSNs), 3D city modeling and BIM applications for Smart Cities. He has authored many articles in well-known journals in the field of GIS and geospatial science. He is the director of the Spatial Decision Making & Smart Cities Lab at the department of GIS. He has been engaged in the management of research/industry projects for government and private companies.
Davood Shojaei
Davood Shojaei has over 15 years of experience working on spatial projects. Currently, he is a lecturer at the University of Melbourne within the Department of Infrastructure Engineering in Melbourne, Australia. He has comprehensive practical and theoretical knowledge in the area of spatial data science, BIM, 3D Visualisation (Augmented and Virtual Reality), 3D GIS, 3D Cadastre and Digital Twin.
References
- Atazadeh, B., A. Rajabifard, Y. Zhang, and M. Barzegar. 2019. “Querying 3D Cadastral Information from BIM Models.” ISPRS International Journal of Geo-Information 8 (8): 329. doi:10.3390/ijgi8080329.
- Benner, J., A. Geiger, and K. H. Häfele. 2010. “Concept for Building Licensing Based on Standardized 3D Geoinformation.” International Archives of the Photogrammetry, Remote Sensing and Spatial Information Sciences, XXXVIII-4/W15 (2010), Paper presented at the 5th International 3D GeoInfo Conference, November 3-4. Berlin, Germany.
- Biljecki, F., J. Stoter, H. Ledoux, S. Zlatanova, and A. Çöltekin. 2015. “Applications of 3D City Models: State of the Art Review.” ISPRS International Journal of Geo-Information 4 (4): 2842–2889.
- Chaturvedi, K. 2014. “Web Based 3D Analysis and Visualization Using HTML5 and WebGL.” Thesis for: Master of Science in Geo-information Science and Earth Observation. University of Twente, Faculty of Geo-Information and Earth Observation (ITC).
- Chen, L. C., C. H. Wu, T. S. Shen, and C. C. Chou. 2014. “The Application of Geometric Network Models and Building Information Models in Geospatial Environments for Fire-fighting Simulations.” Computers, Environment and Urban Systems 45: 1–12.
- Ellul, C., and M. Haklay. 2006. “Requirements for Topology in 3D GIS.” Transactions in GIS 10 (2): 157–175.
- Emamgholian, S., M. Taleai, and D. Shojaei. 2017. “A Novel Approach for 3D Neighbourhood Analysis.” The International Archives of the Photogrammetry, Remote Sensing and Spatial Information Sciences XLII-2/W7, Paper presented at the ISPRS Geospatial Week 2017. Wuhan, China, September 18-22. doi: 10.5194/isprs-archives-XLII-2-W7-361-2017
- Emamgholian, S., M. Taleai, and D. Shojaei. 2018. “A Novel Approach for 3D Modeling and Geovisualization of Easement Rights in Apartments.” Journal of Geospatial Information Technology (In Persian) 6 (3): 173–185. doi:10.29252/jgit.6.3.173.
- Jarroush, J., and G. Even-Tzur. 2004. “Constructive Solid Geometry as the Basis of 3D Future Cadastre.” Paper presented at FIG Working Week, May 22-27. Athens, Greece.
- Jjumba, A., and S. Dragićević. 2016. “Towards a Voxel-based Geographic Automata for the Simulation of Geospatial Processes.” ISPRS Journal of Photogrammetry and Remote Sensing 117: 206–216.
- Karki, S., R. Thompson, and K. McDougall. 2010. “Data Validation in 3D Cadastre.” In Developments in 3D Geo-information Sciences, edited by T. Neutens and P. Maeyer, 92–122. Lecture Notes in Geoinformation and Cartography. Heidelberg, Dordrecht, London, New York: Springer.
- Kwan, M. P., and J. Lee. 2005. “Emergency Response after 9/11: The Potential of Real-time 3D GIS for Quick Emergency Response in Micro-spatial Environments.” Computers, Environment and Urban Systems 29 (2): 93–113.
- Lee, J., and S. Zlatanova. 2008. “A 3D Data Model and Topological Analyses for Emergency Response in Urban Areas.” In Geospatial Information Technology for Emergency Response, edited by S. Zlatanova and Jonathan, 159–184. London: Taylor & Francis Group.
- Lee, J., and M. Kwan. 2005. “A Combinatorial Data Model for Representing Topological Relations among 3D Geographical Features in Micro‐spatial Environments.” International Journal of Geographical Information Science 19 (10): 1039–1056.
- Lee, J. Y., and J. H. Koh. 2007. “A Conceptual Data Model for A 3D Cadastre in Korea.” Journal of the Korean Society of Surveying, Geodesy, Photogrammetry and Cartography 25 (6–1): 565–574.
- Li, L., F. Luo, H. Zhu, S. Ying, and Z. Zhao. 2016. “A Two-level Topological Model for 3D Features in CityGML.” Computers, Environment and Urban Systems 59: 11–24.
- Moser, J., F. Albrecht, and B. Kosar. 2010. “Beyond visualisation–3D GIS Analyses for Virtual City Models.” International Archives of the Photogrammetry, Remote Sensing and Spatial Information Sciences 38 (4): W15, Paper presented at the 5th International 3D GeoInfo Conference, Berlin, Germany, November 3- 4.
- Pouliot, J., T. Roy, G. Fouquet-Asselin, and J. Desgroseilliers. 2011. “3D Cadastre in the Province of Quebec: A First Experiment for the Construction of A Volumetric Representation.” In Advances in 3D Geo-Information Sciences, edited by H. K. Thomas, K. Gerhard, and N. Claus, 149–162. Berlin, Heidelberg: Springer-Verlag.
- Shirzad, M. R., H. A. Babaie, T. Kiani, M. Navi, H. Gholami, S. Arefipour, N. Fouladi, and K. Motevalli. 2014. “Framework and Modeling Structure of Exploration and Mining Cadastre System in Iran.” Earth Science Informatics 7 (2): 123–138.
- Shojaei, D. 2014. “3D Cadastral Visualisation: Understanding Users’ Requirements.” Thesis for Doctor of Philosophy, Centre for Spatial Data Infrastructures (SDIs) and Land Administration, Department of Infrastructure Engineering, School of Engineering, The University of Melbourne. http://hdl.handle.net/11343/45129.
- Shojaei, D., A. Rajabifard, M. Kalantari, I. D. Bishop, and A. Aien. 2015. “Design and Development of a Web-based 3D Cadastral Visualisation Prototype.” International Journal of Digital Earth 8 (7): 538–557.
- Shojaei, D., H. Olfat, S. I. Q. Faundez, M. Kalantari, A. Rajabifard, and M. Briffa. 2017. “Geometrical Data Validation in 3D Digital Cadastre− A Case Study for Victoria, Australia.” Land Use Policy 68: 638–648.
- Stoter, J. E. 2004. “3D Cadastre.” Thesis for Doctor of Philosophy, NCG, Netherlands Geodetic Commission, Delft, the Netherlands.
- Tashakkori, H., A. Rajabifard, and M. Kalantari. 2015. “A New 3D Indoor/outdoor Spatial Model for Indoor Emergency Response Facilitation.” Building and Environment 89: 170–182.
- Thompson, R. J. 2007. “Towards a Rigorous Logic for Spatial Data Representation.” Thesis for Doctor of Philosophy, Netherlands Geodetic Commission, Delft, the Netherlands.
- van Oosterom, P., C. Lemmen, T. Ingvarsson, P. van der Molen, H. Ploeger, W. Quak, J. Stoter, and J. Zevenbergen. 2006. “The Core Cadastral Domain Model.” Computers, Environment and Urban System 30 (5): 627–660.
- Walenciak, G., B. Stollberg, S. Neubauer, and A. Zipf. 2009. “Extending Spatial Data Infrastructures 3D by Geoprocessing Functionality, 3D Simulations in Disaster Management and Environmental Research.” In Paper Presented at the International Conference on Advanced Geographic Information Systems & Web Services, 40–44. IEEE. doi:10.1109/GEOWS.2009.16.
- Ying, S., R. Guo, L. Li, P. J. M. V. Oosterom, H. Ledoux, and J. E. Stoter. 2011a. “Design and Development of a 3D Cadastral Prototype Based on the LADM and 3D Topology.” Paper presented at the 2nd International Workshop on 3D Cadastres, November 16-18. Delft, The Netherlands.
- Ying, S., L. Li, and R. Guo. 2011b. “Building 3D Cadastral System Based on 2D Survey Plans with SketchUp.” Geo-spatial Information Science 14 (2): 129–136.
- Zhao, W., L. Yan, and Y. Zhang. 2018. “Geometric-constrained Multi-view Image Matching Method Based on Semi-global Optimization.” Geo-spatial Information Science 21 (2): 115–126.
- Zlatanova, S. 2015. “Topological Relationships and Their Use.” In Encyclopedia of GIS, edited by S. Shekhar, H. Xiong, and X. Zhou, 1–21. Springer International Publishing. doi:10.1007/978-3-319-23519-6_1548-1.