
 ?Mathematical formulae have been encoded as MathML and are displayed in this HTML version using MathJax in order to improve their display. Uncheck the box to turn MathJax off. This feature requires Javascript. Click on a formula to zoom.
ABSTRACT
Urbanization is one of the most impactful human activities across the world today affecting the quality of urban life and its sustainable development. Urbanization in Africa is occurring at an unprecedented rate and it threatens the attainment of Sustainable Development Goals (SDGs). Urban sprawl has resulted in unsustainable urban development patterns from social, environmental, and economic perspectives. This study is among the first examples of research in Africa to combine remote sensing data with social media data to determine urban sprawl from 2011 to 2017 in Morogoro urban municipality, Tanzania. Random Forest (RF) method was applied to accomplish imagery classification and location-based social media (Twitter usage) data were obtained through a Twitter Application Programming Interface (API). Morogoro urban municipality was classified into built-up, vegetation, agriculture, and water land cover classes while the classification results were validated by the generation of 480 random points. Using the Kernel function, the study measured the location of Twitter users within a 1 km buffer from the center of the city. The results indicate that, expansion of the city (built-up land use), which is primarily driven by population expansion, has negative impacts on ecosystem services because pristine grasslands and forests which provide essential ecosystem services such as carbon sequestration and support for biodiversity have been replaced by built-up land cover. In addition, social media usage data suggest that there is the concentration of Twitter usage within the city center while Twitter usage declines away from the city center with significant spatial and numerical increase in Twitter usage in the study area. The outcome of the study suggests that the combination of remote sensing, social sensing, and population data were useful as a proxy/inference for interpreting urban sprawl and status of access to urban services and infrastructure in Morogoro, and Africa city where data for urban planning is often unavailable, inaccurate, or stale.
1. Introduction
Urban sprawl is one of the major outcomes of transformations resulting from population agglomeration in urban centers (Cobbinah and Darkwah Citation2016; Mosammam et al. Citation2017; Xu et al. Citation2019a). Although it generally refers to the “unrestricted growth in many urban areas of housing, commercial development, and roads over large expanses of land, with little concern for urban planning” (Fouberg, Murphy, and DeBlij Citation2012), it has been defined by various scholars to reflect the purpose of their respective studies. At present, growth in urban populations worldwide is considered as the factor directly responsible for the unprecedented rate of urban sprawl being recorded majorly in cities within the global south. As the population of an urban center increases, its need for infrastructures such as transportation, water, sewage and facilities such as housing, commerce, health, schools, and recreation increases, most often resulting in the phenomenon known as urban sprawl (Fenta et al. Citation2017; Sumari et al. Citation2017; Tanveer et al. Citation2019; Ujoh, Igbawua, and Ogidi Paul Citation2019). Due to the rapid rise in urbanization levels in most countries across the world since 1950 (United Nations Citation2018), the monitoring and analysis of urban expansion have become a popular topic in geoscience applications in various regions around the world (Zhang et al. Citation2019a).
Recently, there have been considerable advances in techniques adopted via geospatial technologies that collectively enable urban planners and managers to study and monitor urban conditions and growth, hither to impossible to achieve (Huang, Wang, and Li Citation2018; Sumari et al. Citation2019a). In addition, the combination of remote sensing and Global Positioning Systems (GPS) have increased the precision with which urban sprawl can be measured and analyzed. Several studies have applied remote sensing data and GIS techniques to provide information of land use transformation and degradation. To track deforestation, changes in cultivation, ecosystem and land use transformation patterns, airborne and satellite remote sensing are very precise and useful (Fu et al. Citation2013; Ligate, Chen, and Wu Citation2018; Nzunda and Midtgaard Citation2019). Combining them with socioeconomic surveys, social sensing data, censuses, and other biophysical information collection methods have brought an improved understanding of land cover and use patterns and change detection as well as the factors driving these changes (Huang, Wang, and Li Citation2018). Using big Earth data technologies can accelerate scientific discovery and support global sustainable development. For example, extracting spatiotemporal data from social media based on ontology method have been used to resolve some problems affecting urban populations (Guo Citation2019; Li et al. Citation2014; Trinder and Liu Citation2020). Remote sensing is especially useful when researchers are looking to study populations. For instance, Zhang et al. (Citation2017) identifies three ways in which population estimates can be attained through remote sensing. These are individual dwelling units count, measuring urban extent, and climate change. Another instance would be the use of nighttime lights as proxies to estimate urban population and economy (Bennett and Smith Citation2017; Fu et al. Citation2017; Zhou et al. Citation2019). Google Street View images can also be used for automatic pedestrian counts and environment audits (Yin et al. Citation2015). All of these confirm the potentials of remote sensing and GIS in understanding different forms and patterns of urbanization in different parts of the world.
With respect to a pattern studies, social media data (Twitter) originates from users, which allow information from personal accounts to be geo-located through built-in GPS of users’ devices. This information is useful for activity pattern analysis as shown by (Dangermond and Goodchild Citation2020; Kainz Citation2020; Monsivais et al. Citation2017). Other studies in urban areas have utilized social media data and satellite imagery to gain insights on situational awareness of human activities (Zhang et al. Citation2017; Stefanidis et al. Citation2011), urban land use mapping (Hu et al. Citation2016); service-oriented architecture applications (Pashova and Bandrova Citation2017) spatiotemporal analysis in the urban environment impacted by human activities (Monsivais et al. Citation2017; Sumari et al. Citation2019b); and, determination of users’ locations, tweets, and home area from Twitter data to understand the patterns of social media usage (Hu et al. Citation2019; Lee et al. Citation2014; Sdoukopoulos et al. Citation2018; Tsou et al. Citation2015; Weiler, Grossniklaus, and Scholl Citation2016; Zhou and Zhang Citation2016).
The United Nations (UN) adopted the 2030 Agenda for sustainable development, which formed the bedrock for the 17 sustainable development goals (SDGs) and 230 indicators in 2015. According to United Nations (Citation2018), the SDGs along with their respective indicators are considered as products of society produced through cooperation and the common desire to achieve a balance between human development and environmental protection. And different indices for urban sustainable development can be established by these indicators from the society, economy and environmental aspects, which aim at revealing the modified spatial pattern of natural resources, and resulting economic and social development (Ding et al. Citation2016; Xu et al. Citation2019b; Zhilin et al. Citation2020). Therefore, it is necessary to understand the needs and concerns of different groups and individuals, especially in areas subject to ethical or political constraints. While social disciplines, such as psychology and economics, will undoubtedly play a decisive role in urban policymaking, satellite remote sensing images continue to provide useful information on a verifiable basis to support administrative decision-making in urban planning and management. It is increasingly becoming evident that social media data can also provide effective governance or guidance indications, which are found equally important in terms of urban planning and management.
From a sustainability context, the natural environment, and its ecosystems are the delivery medium for all products and services that humans rely on for survival but with the dynamic change in climate, these services have since been altered in terms of effectiveness and quality assurance (Korah and Cobbinah Citation2019). Ecosystem services are the benefits that ecosystems provide for both human societies and the earth itself with reference to regulation, provision, and cultural significance. These include provisioning services such as food, water, timber, and fiber; regulating services that affect climate, floods, disease, wastes, and water quality; cultural services that provide recreational, esthetic, and spiritual benefits; and supporting services such as soil formation, photosynthesis, and nutrient cycling (Huq et al. Citation2019; Sedami et al. Citation2015; Terfa et al. Citation2020; Twumasi et al. Citation2019; Zhang, Weng, and Shao Citation2017; Zhang et al. Citation2019b). Human beings depend on these ecosystem services because they are vital for human well-being. Conversely, ecosystem disservices, on the other hand, are perceived as negative effects of ecosystem degradation as a result of human activities (Lyytimäki and Sipilä Citation2009; Shao Citation2019; Von Döhren and Haase Citation2015). Maintaining ecosystem services is vital for the achievement of the SDGs (Shao et al. Citation2019), and considered a powerful tool that planners can use for land-use and environmental planning (de Groot et al. Citation2010; Musakwa and Van Niekerk Citation2014; Musakwa and Wang Citation2018). It is clearly necessary for planners and decision-makers to have a better understanding of the trade-offs between different development scenarios through the adoption of the SDG 11 (which generally focuses on making cities and human settlements inclusive, safe, resilient and sustainable) and SDG 15 which seeks to encourage and institute the protection, restoration, and promotion of sustainable use of terrestrial ecosystems, sustainably manage forests, combat desertification, and halt and reverse land degradation including halting of biodiversity loss (Chen et al. Citation2018; Osborn, Cutter, and Ullah Citation2015). For the purpose of this study, these two goals are considered relevant in terms of their applicability to the study area, implementability by the relevant planning authorities at Morogoro urban municipality and transformationalism by way of an improved and sustainable urban planning and management outcome for the study area through verifiable, target-specific indicators.
This study aims to integrate remote sensing satellite imagery and social media data for modeling location and direction of urban sprawl in the Morogoro urban municipality in order to: 1) identify urban sprawl in a synoptic spatial and temporal pattern from 2011 to 2017; 2) determine the impact of urban sprawl on sustainable urban development and in particular ecosystem services for the city. The study provides an understanding of spatial and temporal patterns of urban sprawl in Morogoro urban municipality using inferences from the location of Twitter usage activities as a yardstick for establishing the (non-)availability of telecommunications infrastructure upon which the Twitter platform operates. This study contributes to the discussion on the use of emerging technologies to address the real-time problem (i.e., rapid and unplanned urbanization) and its implication on sustainable development in developing countries. The expanding footprint of cities implies a greater expenditure on infrastructure provision to adjoining fringes, which is often not available in developing countries. It is, therefore, common to find that developed areas in the urban periphery are not provided with infrastructure, leading to the informal provision that can pose economic hardship and environmental hazards that can be categorized as short, medium and long term.
2. Materials and methods
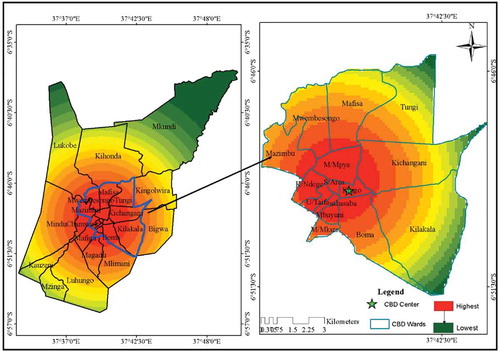
2.1. Study area
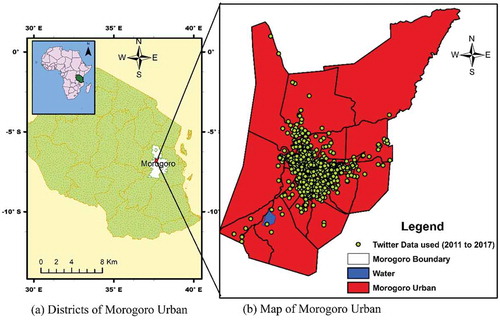
The study was conducted in the Morogoro urban municipality, which is the main district within the Morogoro Region, also known informally as “Mji kasoro bahari” which translates as “city short of an ocean/port” (URT Citation2009) in . The Morogoro urban municipality’s current vision is to have a community of people with highest standard of living and a sustainable socio-economic development regime. The Council’s Mission is to offer unique socio-economic services to residents and beyond while creating trust by managing its resource base effectively for the benefits of the Council’s residents and beyond (URT Citation2016a; Amade, Painho, and Oliveira Citation2018). The Morogoro urban municipality is located at longitude 37°00′E and latitude 4°48′S of the equator and its district borders Morogoro rural district on the East and the South; and to the north and west by Mvomero district.
Figure 1. Spatial distribution of Twitter data in Morogoro urban municipality
2.2. Data source
2.2.1. Remote sensing data extraction
We downloaded Landsat 7 images with 30 m spatial resolution from US Geological Survey (USGS) website (http://eartheplorer.usgs.gov/) through Google Earth Engine (GEE) platform. In GEE, we extracted time series imagery by the extent of the study area (Path/Row 167/65) and study period from the year 2011 to 2017 (2011, 2013, 2015 and 2017). Using ERDAS imagine version 2015 and ArcGIS version 10.4 softwares for processing the image data process, which include radiometric and geometric corrections and registered to Universal Transverse Mercator projection (UTM-Zone 37 South) in the World Geodetic System (WGS84) datum.
2.2.2. Twitter data extraction
Twitter is one of the most popular online news and social media networking platforms for interacting and sharing information with millions of users regarding breaking news, advertisements and locations sharing through messages known as “tweets”. Earlier, a Twitter message (tweet) contains a short message of up to 140 characters and metadata information such as time, hashtags, likes and the number of followers. This was doubled to 280 characters in November 2017.
The widespread availability of GPS equipped phones has made it possible for tweets to be geo-tagged, making such spatial information available for millions of users to see. From the Twitter account, two options are given to a user (Zhou and Zhang Citation2016). First is to set a location, which is automatically captured by a built-in GPS receiver in the mobile equipment, recording the user’s position in the form of longitude and latitude. The second option is that a user can select a location from a list of places provided by Twitter. In this case, Twitter records the estimated location of the mobile device or the Internet Protocol (IP) address, providing several possible locations (e.g., a building, a neighborhood, a city, even a country) based on geocodes for selection. However, the two options will differ in terms of the accuracy of the location. Location by the GPS itself has a relatively precise accuracy at a magnitude of several meters (Hu et al. Citation2019; Lee et al. Citation2014). Generally, the user selected location provided by Twitter will be accurate within 30 to 3000 m in general while the location generated by the IP address is also not precise with the positional accuracy depending on the method which is used to convert the IP address to coordinates (Lee et al. Citation2014). This study adopted the geotagged tweets that show longitude and latitude, as they are more accurate to generate both accessibility and spatial analysis using network analysis and to examine the distance of the user for a given radius from the city center. In this study, a total of 1597 geo-locations were extracted from users’ accounts from 2011 to 2017 within the study area boundary using Twitter Application Programming Interface (API) Stream (https://dev.Twitter.com/streaming) based on their account location mentioned in the user profiles. These processed tweets were stored and managed in a database.
2.3. Methods
After collecting all the data, we further processing was required for the extensive and detailed interpretation. shows the overview of research methodology adopted for the study. The workflow presents three major steps: 1) Remote sensing data and Twitter data pre-processing. 2) Image classification, land use change detection and validation. 3) Spatial patterns identified using classified results of land cover changes.
Figure 2. Overview of our research approach
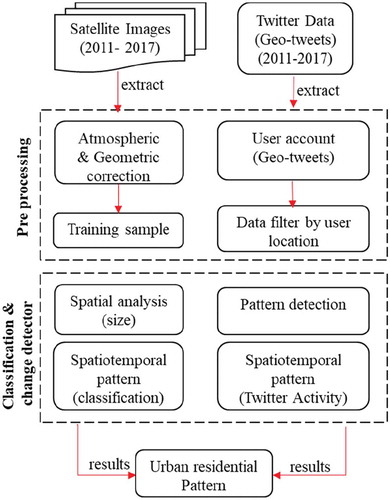
In pre-processing, the extraction of each data from remote sensing and Twitter were computed and analyzed using different methods of analysis to obtain an estimated “ground truth” of urban sprawl at specific location and times then we developed a kernel point density mapping model to allocate the extent of growth. Finally, we evaluated the model by comparing the remote sensing results with extracted points. Data generated during pre-processing helped in interpreting the primary data to achieve spatial distribution and its implication on sustainable development. Detailed procedures of the adopted method are described below.
2.3.1. Land use land cover classification
According to (Gislason, Benediktsson, and Sveinsson Citation2006) and (Ming et al. Citation2016), the Random Forest (RF) algorithm exhibits good robustness compared with other traditional methods in the classification of a remote sensing image because it requires fewer parameters, minimal manual intervention, and yields high classification accuracy, can also manage high-dimensional data and obtain classification results rapidly. This explains the adoption of RF in land cover classification using multispectral and hyperspectral satellite sensor imagery as shown in studies by (Ghimire, Rogan, and Miller Citation2010; Gislason, Benediktsson, and Sveinsson Citation2006; Nitze, Barrett, and Cawkwell Citation2015; Rodriguez-galiano et al. Citation2012) and data platforms and mapping such as LIDAR and radar image classifications, lithological mapping, as well as mineral prospectively prediction.
In classifying the LULC of Morogoro urban municipality, the Random Forest (RF) classifier was chosen to classify all the imageries by training pixel based on four classes: built-up, vegetation, agriculture and water. The random classification was chosen because of its robustness. The classification accuracy results were validated by generating 480 random points of class. After the LULC classification, the change in the transformation of each land cover was calculated from the year 2011 to 2017. The change was assessed whether it was positive or negative for ecosystem services using the report and classification according to the Millennium Ecosystem Assessment (Assessment Citation2005).
2.3.2. Twitter user pattern detection
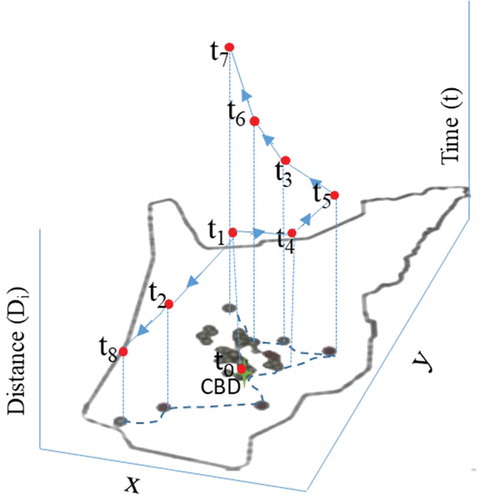
We identified the influence of social media data (tweeter) in urban expansion using the following model;
whereby each user contains account location (al) which denoted as (Þ x1; y1; t1), stores information about time (t) and location (latitude or x, longitude or y); n is the total number of a user within the study area, time (t) and Dn is a distance from years of reference of the used location. Urban expansion Twitter model (UET) is designed to show urban expansion using Twitter data showing the improvement of social infrastructure within the study area specifically the metrics formula for the model are n > 100, tn – t1 ≤ 360 days;
Based on the urban expansion Twitter model, the urban expansion is generated based on the increase of extension of building and improvement of social services infrastructure delivery within the area of our study ().
Figure 3. Overview of our research approach
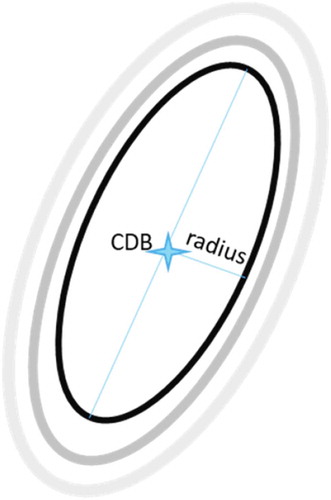
2.3.3. Kernel density function
The Kernel Density Function (KDF) was used to calculate the density of user’s after extracted urban land use, we analyzed the Kernel density function to measure the density of each location in order to assess and analyze quantitatively the differences in spatial expansion. We analyzed the Kernel density function to measure the density of each location. We adopted the quartic kernel function for point densities at described in (Silverman Citation1986) . The center of the Kernel surface was at the town center (CDB) and the buffer of 1 km.
Figure 4. Kernel surface fitted
The Kernel function was used to calculate the weighted Standard Distance (SD) of the users’ location and then a comparison of number of Twitter users with population of the Morogoro urban municipality was also done. The SD function is provided below as:
where i is a user location within the buffer distance of the location (x, y); is the population values; and
is the distance between the of user location at point 1, which is an optional parameter.
3. Results
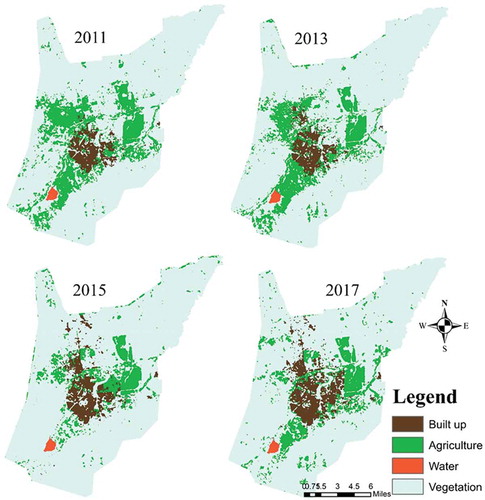
3.1. Urban sprawl and spatial pattern during 2011–2017
In order to understand urban sprawl and its spatial pattern in the Morogoro urban municipality (), a 30 m spatial resolution image of Landsat 7 for years 2011, 2013, 2015 and 2017 were classified into four classes: built-up, agriculture, water and vegetation. Quantifying the urban growth over the period is proportional to the measurement of the spatial expansion of the urban built-up area. However, the increase in built-up area is generally related to population growth, which is a significant driver for built-up area expansion. Comparison of growth rates of population and built-up area helped analyze the characteristics of urban growth in the Morogoro urban municipality. shows the growth recorded in each land cover class across the Morogoro urban municipality since 2011 through 2015 to 2017 as well as the corresponding impact on ecosystem services provision. Clearly, the statistics in reveal that highest rate of development was recorded during 2015 and 2017.
Table 1. Land cover n change in the Morogoro urban municipality and the impact on ecosystems services
Figure 5. Land cover distribution of Morogoro urban municipality
3.2. Analysis of social media (“Twitter”) data
GIS is among the most useful technology to measure spatial distribution of Twitter users as they contain the location needed for additionally useful analysis such as buffering. The buffer analyses were performed by setting 1 km buffer bands in order to analyze the number of Twitter users from the main Morogoro urban municipality of the city ().
Figure 6. Kernel distance value increasing of new user account and Tweets location for seven years
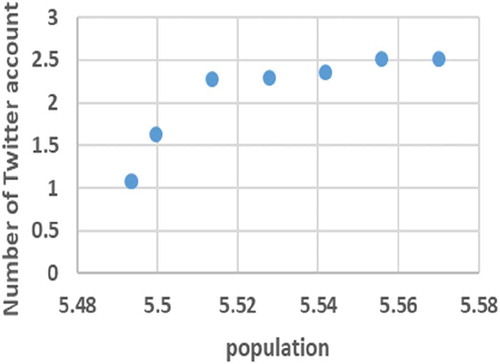
In the case of spatiotemporal pattern of Twitter usage, we analyzed each Twitter user and the location of the user’s profile information. We then retrieved all the Tweets sent from location(s) within the study area from 2011 to 2017 so that we can assess the top usage area of Twitter as inference for development while ground truth using handheld GPS ultimately confirms sprawl (). The results indicate that people tend to tweet more in the city center than outside the city center suggesting that there are more telecommunication infrastructure to support the Twitter platform within the city center than is the case on the city fringes. The status is same for both new Twitter accounts and actual tweets originating from within the study area. The correlation between Twitter accounts and population of the Morogoro urban municipality reveals a strong positive correlation () where population increase corresponds with increase in Twitter accounts in the Morogoro urban municipality.
Figure 7. A correlation between number of Twitter accounts and population in the area
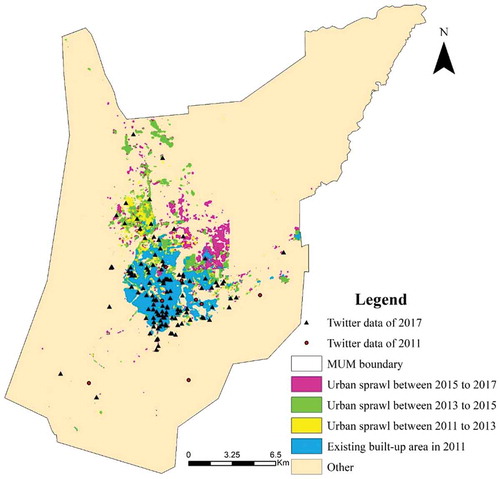
From integrating Tweets classified and remote sensing images from 2011 to 2017 in , the result shows that the center area of Morogoro urban is more developed but declines outward in a semi-radial form. The assumption is that telecommunication infrastructure and related internet connectivity services to support Twitter (as well as other social media platforms) can be found mostly in the city center, and less as one radiates out of the city center within the study area. Expectedly, a survey of the city shows that this pattern also applies to other infrastructure and services such as roads, public pipe-borne water supply, schools, health-care facilities, Solid Waste Management (SWM) services, etc.
Figure 8. Spatial distribution of urban land from 2011 to 2017, and Twitter data in 2011 and 2017
4. Discussions
4.1. Implication for social, economic and environmental sustainability
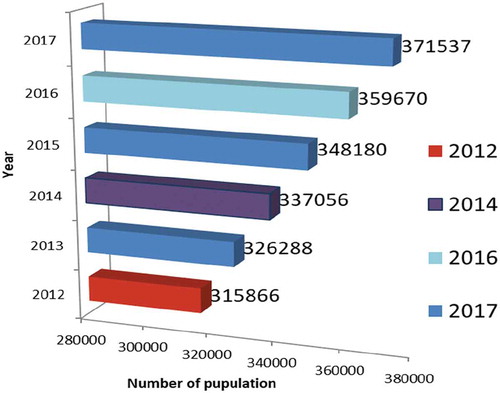
Population size is a crucial entity for socio-economic development (Bennett and Smith Citation2017; Zhang et al. Citation2019c) because it acts as a resource for labor provision during production as well as consumers of various products. Therefore, the size of the population is among the significant parameters for social, economic and environmental sustainability in any locality. In 2002, approximately 73% of the people in the Morogoro region resided in the rural area with only 27% residing in the urban area (URT Citation2016b; UN-Habitat Citation2009). By 2012, the urban population in the Morogoro region rose sluggishly to 29%. Although the next census is due in 2022, it is expected that the actual urban population of the Morogoro urban municipality must have leap-frogged given the rate of urban expansion recorded in this study other similar studies of the study area. Furthermore, shows that the population in Morogoro increased by 15% between 2012 and 2017.
Figure 9. Increased population from 2012 to 2017 in Morogoro
The rapid expansion and population growth of the urban area have affected the ecosystem in the area, both in terms of land degradation, water supply, and loss of agricultural land. Likewise, the urban population and built-up area growth collectively exert demand pressure on food, infrastructure and facilities (water, energy, roads, drainages, and health-care facilities). Furthermore, the growth leads to consumption of pristine forest, croplands, wetlands and other natural resources (Assessment Citation2005; Musakwa et al. Citation2020). Evidence has also shown that the high population, accompanied by poverty, often leads to increased incidences of environmental degradation. In addition, improving the quality of life of a population requires sufficient provision of social services like waste management and sanitation services, education, health, water, transport and housing. This implies that the growth in population has put additional pressure on financial resources of the Morogoro urban municipality council to serve the growing population. In reality, critical infrastructure has not been able to keep up with rapid urbanization in the Morogoro urban municipality (Fungo Citation2018; Mpembeni et al. Citation2018). The lack of basic infrastructure and services in the Morogoro urban municipality can be observed in the inadequacy of potable water supply, sanitation, electricity, and waste management services. Regulatory agencies are yet to reticulate piped potable water to 50% of the area and as a result, most people rely on boreholes and hand-dug wells. Exacerbating the issue, the majority of these facilities are located outside the households forcing the population to travel sometimes 200 m to access water. Most residents of the Morogoro urban municipality dispose of their solid waste using a centralized collection container, but they sometimes have to travel as far as 300 m to reach a solid waste collection point. This has led to some residents to dump their waste in unauthorized collection points. This, coupled with inadequate drainage facilities, has led to annual urban floods, while liquid waste is dumped in the open creating sanitation challenges. It clearly appears as if planning for the expanding fringes in the Morogoro urban municipality is not done prior to development.
The inability of Government authorities to adequately provide these critical infrastructures and facilities create a vicious cycle of extreme lack, poverty, and low quality of life. It is, therefore, potentially significant to control urban sprawl as a prerequisite to sustainable socio-economic, environmental and urban management. The uncontrolled urban sprawl has resulted in the loss of good agricultural land close to the city, thus affecting the source of livelihood of the vast population that depends on agriculture. With the current trajectory of urban sprawl, the Morogoro urban municipality is off-track toward achieving the SDG 11 (which aims to make cities and human settlements inclusive, safe, resilient and sustainable) by year 2030. To reverse the current unsustainable direction, some of the key targets and indicators are listed in while specific measurable suggestions are also made toward improving the status of each SDG target within the context of Morogoro urban municipality by the terminal year of 2030.
Table 2. SDG Goal 11: Make cities and human settlements inclusive, safe, resilient and sustainable
Table 3. SDG Goal 15: Protect, restore and promote sustainable use of terrestrial ecosystems, sustainably manage forests, combat desertification, and halt and reverse land degradation and halt biodiversity loss
4.2. Impact of urban sprawl on ecosystem services
shows a summary of land cover changes and their impacts on ecosystems services. The overall impact of built-up land cover changes in the Morogoro urban municipality is negative, ultimately resulting in ecosystem disservices. The increase in built-up areas is an ecosystem disservice because it has led to negative impacts such as massive road congestion, pollution, unsustainable land development, a decrease in public spaces/parks and increased pressure on public services. Consequently, residents of the Morogoro urban municipality are likely to experience health problems as a result of pollution, whereas the unsustainable land development and poor access to public spaces denies residents of cultural ecosystems services. Furthermore, other negative impacts of urbanization in the Morogoro urban municipality are the gradual disappearance of indigenous populations, lack of critical infrastructure and transformation of indigenous population’s livelihoods. These indigenous populations are often farmers, finding themselves locked out of the land market due to high prices and their livelihoods altered by residential or commercial developments leading to loss of farmland and livelihoods as well. However, in the Morogoro urban municipality, despite loss of farmland, urban agriculture is prevalent and promoted leading to a relatively minimal decrease in agricultural land from 105.11 km2 to 98.86 km2 between 2011 and 2017. This trend is as a result of the practice of urban agriculture which ensures food security as residents engage in agriculture on their plots and open spaces. There are also reserved land parcels by the government (north of Morogoro urban) for farming.
There was also a significant decrease of vegetation from 410 km2 in 2011 to 390 km2 in 2017. It is important to note that vegetation land cover provides important ecosystem services such as carbon sequestration and climate regulation (Olschewski, Klein, and Tscharntke Citation2010). Similarly, the destruction of vegetation (which means increase in other land covers such as bare land and built-up areas) alters the general esthetics of the Morogoro urban municipality and is a major cause of soil erosion that could lead to increase in suspended solids and deteriorating water quality in the Morogoro River and Mindu dam. This can increase the cost of water treatment for the Morogoro urban municipality and cost for de-silting the Mindu dam. Moreover, the Morogoro urban municipality is part of the Eastern Highlands of East Africa that already experience high soil erosion leading to land degradation (Ernest, Nduganda, and Kashaigili Citation2017). Furthermore, the vegetation destruction in the Morogoro urban municipality is cited as a major cause of habitat fragmentation and reduction in biodiversity (Kithakye, Mutashubirwa, and Kayani Citation2009; Sumari, Xu, et al. Citation2019a). The continued destruction of vegetation (forests and woodlands) around the fringes of the Morogoro urban municipality is a threat to achieving SDG 15 (with terminal year 2020), which is focused on protecting, restoring and promoting sustainable use of terrestrial ecosystems, sustainably manage forests, combat desertification, and halt and reverse land degradation and halt biodiversity loss. For example, the loss of vegetation reduces the study area’s capability to mitigate effects of climate change as heavy rains lead to extensive runoff which in turn results to landslides and loss of lives and properties (Ernest, Nduganda, and Kashaigili Citation2017; Kilawe et al. Citation2018; Mkonda and He Citation2017). Similarly, the role of vegetation in carbon sequestration is immensely inhibited with continued destruction of vegetation cover in the study area (Palilo Citation2014; Sumari et al. Citation2019b). As a response to this challenge, it is on record that the Morogoro urban municipality has started a tree-planting program to mitigate climate change effects. Specific SDG 15 targets and indicators are provided in along with suggested actions to reverse the current unsustainable pattern observed from this study and other documented sources.
Water bodies (including wetlands) in the Morogoro urban municipality have decreased insignificantly in terms of overall status from 2011 to 2017 (2.5 km2 to 2.4 km2 respectively) and this means well for environmental and biodiversity conservation, and climate change mitigation and adaptation ( and ). Additionally, wetlands provide services to human beings such as recharging groundwater, controlling floods, preventing eutrophication of rivers and lakes and supporting specific fragile but critical biota.
Generally, Twitter usage and accounts increased more within the Morogoro urban municipality city center. However, the fringes to the north of the study area saw more Twitter activities than any other fringe area of the Morogoro urban municipality. Urban expansion in the north of the Morogoro urban municipality occurred largely between 2013 and 2015, while the period between 2015 and 2017 witnessed urban sprawl recorded toward the north-east immediate fringes of the city center ().
5. Conclusions
This study focused on identifying the extent and pattern of urban sprawl in Morogoro urban municipality using remote sensing data from the Landsat platform, social sensing data from the Twitter platform and census population data within the study area with a temporal span of 2011 to 2017. The results show that the built-up area of the Morogoro urban municipality expanded during the study period as the sprawl corresponded with increase in population of the Morogoro urban municipality between 2012 and 2017. Similarly, the annual increase in population of the Morogoro urban municipality translated into an annual increase in Twitter accounts and also a significant spatial and numerical increase in Twitter usage across the Morogoro urban municipality between 2011 and 2017. The temporal and spatial land uses show an integration of remote sensing images, population data and Twitter usage data to model urban sprawl in an outwardly semi-radial form within the Morogoro urban municipality. While the existing trend shows significant loss in agricultural land cover as well as decline in ecosystem services, the pattern also implies that infrastructure (roads, pipe-borne water, etc.) and other critical municipal services (solid waste management, sewage and sanitation, security, etc.) are not adequately provided over the sprawl area. This is exemplified in the increase in Twitter usage within the city center whereas the rate of increase in Twitter usage at the adjoining fringes of the city is limited over the years particularly in Mkundi and Lukobe districts in the north, and Mzinga and Kauzeni districts in the south as well as parts of Tungi, Kichangala and Kilakala to the east of Morogoro urban municipality. Explicitly, this pattern of urban expansion has had significant impacts on poverty, living conditions and environmental quality within the sprawl areas of the Morogoro urban municipality; hence, the decline in ecosystem services in the area to support human and natural populations.
It is suggested that the Morogoro Strategic Plan should set out implementation strategies for providing key infrastructure in planned layouts on the outer fringes of the city, specifically in the districts of Mkundi, Lukobe, Mzinga, Kauzeni, Tungi, Kichangala and Kilakala. Infrastructure provision could be commercialized (where government is unable to provide same) so that residents enjoy high living standards while payment for these critical infrastructure and services are made over the land tenure period. This style of planning and regulation would lead to a planned and sustainable future that will be ecologically sensitive, support conservation and biodiversity, and provide a safe habitation for urban dwellers.
Although the combination of remote sensing, social sensing and population data was useful as a proxy for poverty and access to services, it is suggested that future studies should focus on improving the GPS accuracy of twitter users as the current locational accuracy of the tweets is dependent on the accuracy levels of the in-built GPS of the phones sending out the tweets, a factor beyond the control of this research. The GPS accuracy is, therefore, an aspect of the study that can be potentially improved upon through further studies. Therefore, the stand-alone social media data may not be a reliable indicator of urban growth as it may instead just be showing an increase in internet penetration, smartphone usage and social indicators like peer pressure. Nevertheless, the proposition delivered in this study provides an alternative inferential source for documenting urban sprawl where adequate cadastral data and resources are a major challenge.
Acknowledgments
The authors are sincerely grateful to the editors as well as the anonymous reviewers for their valuable suggestions and comments that helped us improve this paper significantly.
Additional information
Funding
Notes on contributors
Zhenfeng Shao
Zhenfeng Shao is a professor in the State Key Laboratory of Information Engineering in Surveying, Mapping and Remote Sensing, Wuhan University. He got his bachelor's and master's degrees from Wuhan Technical University of Surveying and Mapping, respectively, in 1998 and 2001, and received the PhD degree from Wuhan University in 2004. His research interest mainly focuses on urban remote sensing applications. The specific research directions include high-resolution remote sensing image processing and analysis, key technologies and applications from digital cities to smart cities and sponge cities.
Neema S. Sumari
Neema S. Sumari holds a PhD in Geo-Spatial Information Science, with specialization in Photogrammetry and Remote Sensing at LIESMARS (Laboratory of Information Engineering in Surveying, Mapping, and Remote Sensing), Wuhan University, China. She is also an affiliate member at Sokoine University of Agriculture (SUA), Morogoro, Tanzania. She obtained her MSc and BSc both in Computer Science at Alabama Agricultural and Mechanical University (AA&MU) in the United States of America. Her research interest includes spatial analysis with GIS and remote sensing applications, earth sciences and observation, land use studies, and software engineering.
Aleksei Portnov
Aleksei Portnov holds a PhD in cadastre, land use and GIS technology at Moscow State University of Geodesy and Cartography, Russia. Member of the Commission of the International cartographic Association (ICA), Vice-rector for scientific research at Moscow State University of Geodesy and Cartography. His research interests include remote sensing applications in land use, probabilistic models, and spatial data aggregation. He is also interested in state regulation of geodesic and cartographic activities.
Fanan Ujoh
Fanan Ujoh holds a PhD in Environmental Resources Planning from the University of Abuja, Nigeria. He is currently an Affiliate Member at the Center for Sustainability and Resilient Infrastructure and Communities (SaRIC), London South Bank University, London, UK. His research interest is in the application of geospatial science in resolving practical environmental problems in sub-Saharan Africa.
Walter Musakwa
Walter Musakwa holds a PhD in Geography and Environmental Studies from Stellenbosch University, South Africa, a Master in Urban and Regional Planning from University of Kwa Zulu-Natal, South Africa, and a BSc honors in Rural and Urban Planning from the University of Zimbabwe. His main research interests and publications are on societal applications of geo-spatial information technologies in urban planning, agriculture, and rural areas. He is also interested in smart cities, geolocation-based services, volunteered geographic information and their applications in developing countries. Walter is currently Associate Professor in the Department of Town and Regional Planning, University of Johannesburg, South Africa.
Paulo J. Mandela
Paulo J. Mandela is currently a Senior Town Planning Technician at the Morogoro Municipality. His main responsibilities are to identify well-located land for urban settlement. He also assisting in developing and maintaining of the project information database, developing land maps for the department and served as a spatial planner in various positions. He is holding a BSc in the field of urban infrastructure and planning management from Ardhi University, Dar-es-Salaam
References
- Amade, N., M. Painho, and T. Oliveira. 2018. “Geographic Information Technology Usage in Developing countries–A Case Study in Mozambique.” Geo-Spatial Information Science 21 (4): 331–345. doi:10.1080/10095020.2018.1523995.
- Assessment, M. E. 2005. “Ecosystems and Human Well-being: A Framework for Assessment.” Washington, DC. http://pdf.wri.org/ecosystems_human_wellbeing.pdf
- Bennett, M. M., and L. C. Smith. 2017. “Advances in Using Multitemporal Night-time Lights Satellite Imagery to Detect, Estimate, and Monitor Socioeconomic Dynamics.” Remote Sensing of Environment 192: 176–197. doi:10.1016/j.rse.2017.01.005.
- Chen, X., D. Wang, J. Chen, C. Wang, and M. Shen. 2018. “The Mixed Pixel Effect in Land Surface Phenology: A Simulation Study.” Remote Sensing of Environment 211: 338–344. doi:10.1016/j.rse.2018.04.030.
- Cobbinah, P. B., and R. M. Darkwah. 2016. “African Urbanism: The Geography of Urban Greenery.” Urban Forum 27 (2): 149–165. doi:10.1007/s12132-016-9274-z.
- Dangermond, J., and M. F. Goodchild. 2020. “Building Geospatial Infrastructure.” Geo-Spatial Information Science 23 (1): 1–9. doi:10.1080/10095020.2019.1698274.
- de Groot, R. S., R. Alkemade, L. Braat, L. Hein, and L. Willemen. 2010. “Challenges in Integrating the Concept of Ecosystem Services and Values in Landscape Planning, Management and Decision Making.” Ecological Complexity 7 (3): 260–272. doi:10.1016/j.ecocom.2009.10.006.
- Ding, L., Z. Shao, H. Zhang, C. Xu, and D. Wu. 2016. “A Comprehensive Evaluation of Urban Sustainable Development in China Based on the TOPSIS-Entropy Method.” Sustainability 8: 8. doi:10.3390/su8080746.
- Ernest, S., A. R. Nduganda, and J. J. Kashaigili. 2017. “Urban Climate Analysis with Remote Sensing and Climate Observations: A Case of Morogoro Municipality in Tanzania.” Advances in Remote Sensing 6 (2): 120–131. doi:10.4236/ars.2017.62009.
- Fenta, A. A., H. Yasuda, N. Haregeweyn, S. Belay, Z. Hadush, and M. A. Gebremedhin. 2017. “The Dynamics of Urban Expansion and Land Use/land Cover Changes Using Remote Sensing and Spatial Metrics: The Case of Mekelle City of Northern Ethiopia.” International Journal of Remote Sensing 38 (14): 4107–4129. doi:10.1080/01431161.2017.1317936.
- Fouberg, E. H., A. B. Murphy, and H. J. DeBlij. 2012. Human Geography: People, Place, and Culture. 10th ed. John Wiley & Sons Inc. ISBN-10: 1118514653.
- Fu, H., Z. Shao, P. Fu, and Q. Cheng. 2017. “The Dynamic Analysis between Urban Nighttime Economy and Urbanization Using the DMSP/OLS Nighttime Light Data in China from 1992 to 2012.” Remote Sensing 9: 5. doi:10.3390/rs9050416.
- Fu, Y., X. Lu, Y. Zhao, X. Zeng, and L. Xia. 2013. “Assessment Impacts of Weather and Land Use/Land Cover (LULC) Change on Urban Vegetation Net Primary Productivity (NPP): A Case Study in Guangzhou, China.” Remote Sensing 5 (8): 4125–4144. doi:10.3390/rs5084125.
- Fungo, E. 2018. “Road infrastructure improvement for efficient utilisation of the agricultural potential: a case study of Morogoro, Tanzania.” PhD diss., Stellenbosch University.
- Ghimire, B., J. Rogan, and J. Miller. 2010. “Contextual Land-cover Classification: Incorporating Spatial Dependence in Land-cover Classification Models Using Random Forests and the Getis Statistic.” Remote Sensing Letters 1 (1): 45–54. doi:10.1080/01431160903252327.
- Gislason, P. O., J. A. Benediktsson, and J. R. Sveinsson. 2006. “Random Forests for Land Cover Classification.” Pattern Recognition 27: 294–300. doi:10.1016/j.patrec.2005.08.011.
- Guo, H. 2019. “From Digital Earth to Big Earth Data: Accelerating Scientific Discovery and Supporting Global Sustainable Development.” International Journal of Digital Earth 8947: 2018–2019. doi:10.1080/17538947.2018.1559481.
- Hu, F., Z. Li, C. Yang, and Y. Jiang. 2019. “A Graph-based Approach to Detecting Tourist Movement Patterns Using Social Media Data.” Cartography and Geographic Information Science 46 (4): 368–382. doi:10.1080/15230406.2018.1496036.
- Hu, T., J. Yang, X. Li, and P. Gong. 2016. “Mapping Urban Land Use by Using Landsat Images and Open Social Data.” Remote Sensing 8 (2): 2. doi:10.3390/rs8020151.
- Huang, X., C. Wang, and Z. Li. 2018. “A near Real-time Flood-mapping Approach by Integrating Social Media and Post-event Satellite Imagery.” Annals of GIS 24 (2): 113–123. doi:10.1080/19475683.2018.1450787.
- Huq, E., S. Fahad, Z. Shao, M. Sinthia, A. A. Al-huqail, M. H. Siddiqui, M. Habib, et al. 2019. “High Arsenic Contamination and Presence of Other Trace Metals in Drinking Water of Kushtia District, Bangladesh.” Journal of Environmental Management 242:: 199–209. doi:10.1016/j.jenvman.2019.04.086.
- Kainz, W. 2020. “Cartography and the Others – Aspects of a Complicated Relationship.” Geo-Spatial Information Science 23 (1): 52–60. doi:10.1080/10095020.2020.1718000.
- Kilawe, C. J., O. Mertz, D. S. A. Silayo, T. Birch-Thomsen, and S. M. Maliondo. 2018. “Transformation of Shifting Cultivation: Extent, Driving Forces and Impacts on Livelihoods in Tanzania.” Applied Geography 94:: 84–94. doi:10.1016/j.apgeog.2018.03.002.
- Kithakye, D., P. Mutashubirwa, and L. Kayani. 2009. Tanzania: Dar Es Salaam City Profile. Prepared by Human Settlements Programme – UN-HABITAT. Nairobi, Kenya: UNON, Publishing Services Section.
- Korah, P. I., and P. B. Cobbinah. 2019. “Institutional Responses to Climate Change Adaptation: Flood Management at the Metropolitan Level in Accra, Ghana.” In The Geography of Climate Change Adaptation in Urban Africa, edited by P. B. Cobbinah and M. Addaney, 451–478. Springer International Publishing. doi:10.1007/978-3-030-04873-0_16.
- Lee, K., R. Ganti, M. Srivatsa, and L. Liu 2014. “When Twitter Meets Foursquare: Tweet Location Prediction Using Foursquare.” Proceedings of the 11th International Conference on Mobile and Ubiquitous Systems: Computing, Networking and Services 198–207. doi:10.4108/icst.mobiquitous.2014.258092.
- Li, D., Y. Yao, Z. Shao, and L. Wang. 2014. “From Digital Earth to Smart Earth.” Chinese Science Bulletin 59 (59): 722–733. doi:10.1007/s11434-013-0100-x.
- Ligate, E. J., C. Chen, and C. Wu. 2018. “Evaluation of Tropical Coastal Land Cover and Land Use Changes and Their Impacts on Ecosystem Service Values.” Ecosystem Health and Sustainability 4 (8): 188–204. doi:10.1080/20964129.2018.1512839.
- Lyytimäki, J., and M. Sipilä. 2009. “Hopping on One Leg - the Challenge of Ecosystem Disservices for Urban Green Management.” Urban Forestry and Urban Greening 8 (4): 309–315. doi:10.1016/j.ufug.2009.09.003.
- Ming, D., T. Zhou, M. Wang, and T. Tan. 2016. “Land Cover Classification Using Random Forest with Genetic Algorithm-based Parameter Optimization.” Journal of Applied Remote Sensing 10 (3): 1–16. doi:10.1117/1.JRS.10.035021.
- Mkonda, M. Y., and X. He. 2017. “Are Rainfall and Temperature Really Changing? Farmer’s Perceptions, Meteorological Data, and Policy Implications in the Tanzanian Semi-arid Zone.” Sustainability 9 (8): 1412. doi:10.3390/su9081412.
- Monsivais, D., A. Ghosh, K. Bhattacharya, R. I. M. Dunbar, and K. Kaski. 2017. “Tracking Urban Human Activity from Mobile Phone Calling Patterns.” PLoS Computational Biology 13 (11): 1–14. doi:10.1371/journal.pcbi.1005824.
- Mosammam, H. M., J. T. Nia, H. Khani, A. Teymouri, and M. Kazemi. 2017. “Monitoring Land Use Change and Measuring Urban Sprawl Based on Its Spatial Forms: The Case of Qom City.” Egyptian Journal of Remote Sensing and Space Science 20 (1): 103–116. doi:10.1016/j.ejrs.2016.08.002.
- Mpembeni, R., A. LeFevre, D. Mohan, D. Urassa, C. Kilewo, A. George, and A. B. A. Et. 2018. “Quality of Antenatal Care Counseling in Selected Health Centers in Morogoro Region, Tanzania.” East African Journal of Public Health 13 (1): 11–26.
- Musakwa, W., and A. Van Niekerk. 2014. “Monitoring Urban Sprawl and Sustainable Urban Development Using the Moran Index: A Case Study of Stellenbosch, South Africa.” International Journal of Applied Geospatial Research 5 (3): 1–20. doi:10.4018/ijagr.2014070101.
- Musakwa, W., and S. Wang. 2018. “Landscape Change and Its Drivers: A Southern African Perspective.” Current Opinion in Environmental Sustainability 33:: 80–86. doi:10.1016/j.cosust.2018.05.001.
- Musakwa, W., S. Wang, F. Wei, O. L. Malapane, W. Zhao, N. A. Nyathi, Z. E. Mashimbye, N. Poona, E. Fundisi, and V. Yeni-letsoko. 2020. “Survey of Community Livelihoods and Landscape Change along the Nzhelele and Levuvhu River Catchments in Limpopo Province, South Africa.” Land 9: 91. doi:10.3390/land9030091.
- Nitze, I., B. Barrett, and F. Cawkwell. 2015. “Temporal Optimisation of Image Acquisition for Land Cover Classification with Random Forest and MODIS Time-series.” International Journal of Applied Earth Observation and Geoinformation 34: 136–146. doi:10.1016/j.jag.2014.08.001.
- Nzunda, E. F., and F. Midtgaard. 2019. “Deforestation and Loss of Bushland and Grassland Primarily Due to Expansion of Cultivation in Mainland Tanzania (1995–2010).” Journal of Sustainable Forestry 38 (6): 509–525. doi:10.1080/10549811.2019.1598437.
- Olschewski, R., A. Klein, and T. Tscharntke. 2010. “Economic Trade-offs between Carbon Sequestration, Timber Production, and Crop Pollination in Tropical Forested Landscapes.” Ecological Complexity 7 (3): 314–319. doi:10.1016/j.ecocom.2010.01.002.
- Osborn, D., A. Cutter, and F. Ullah 2015. “Universal Sustainable Development Goals: Understanding the Transformational Challenges for Developed Countries”. Report of a study by Stakeholders Forum.
- Palilo, A. 2014. “Assessment Of Climate Change In Morogoro Urban District, Tanzania.” MSc Thesis, Sokoine University Of Agriculture.
- Pashova, L., and T. Bandrova. 2017. “A Brief Overview of Current Status of European Spatial Data Infrastructures − Relevant Developments and Perspectives for Bulgaria.” Geo-Spatial Information Science 5020:: 1–12. doi:10.1080/10095020.2017.1323524.
- Rodriguez-galiano, V. F., B. Ghimire, J. Rogan, M. Chica-olmo, and J. P. Rigol-sanchez. 2012. “An Assessment of the Effectiveness of a Random Forest Classifier for Land-cover Classification.” ISPRS Journal of Photogrammetry and Remote Sensing 67: 93–104. doi:10.1016/j.isprsjprs.2011.11.002.
- Sdoukopoulos, A., A. Nikolaidou, M. Pitsiava-Latinopoulou, and P. Papaioannou. 2018. “Use of Social Media for Assessing Sustainable Urban Mobility Indicators.” International Journal of Sustainable Development and Planning 13 (2): 338–348. doi:10.2495/SDP-V13-N2-338-348.
- Sedami, A., I. Yevide, W. U. Bingfang, Y. U. Xiubo, L. I. Xiaosong, L. I. U. Yu, and L. I. U. Jian. 2015. “Building African Ecosystem Research Network for Sustaining Local Ecosystem Goods and Services.” Chinese Geographical Science 25 (4): 414–425. doi:10.1007/s.
- Shao, Z. 2019. “Feature Matching for Illumination Variation Images.” Journal of Electronic Imaging 24 (3). doi:10.1117/1.JEI.24.3.033011.
- Shao, Z., H. Fu, D. Li, O. Altan, and T. Cheng. 2019. “Remote Sensing Monitoring of Multi-scale Watersheds Impermeability for Urban Hydrological Evaluation.” Remote Sensing of Environment 232: 111338. doi:10.1016/j.rse.2019.111338.
- Silverman, B. W. 1986. “Density Estimation for Statistics and Data Analysis.” Chapman and Hall 78 (2). doi:10.1002/bimj.4710300745.
- Stefanidis, A., A. Crooks, A. Stefanidis, and J. Radzikowski. 2011. “Harvesting Ambient Geospatial Information from Social Media Feeds.” GeoJournal 78 (2): 319–338. doi:10.1007/s10708-011-9438-2.
- Sumari, N., G. Xu, F. Ujoh, P. I. Korah, O. J. Ebohon, and N. N. Lyimo. 2019a. “A Geospatial Approach to Sustainable Urban Planning: Lessons for Morogoro Municipal Council, Tanzania.” Sustainability 11 (22): 6508. doi:10.3390/su11226508.
- Sumari, N. S., H. Tanveer, Z. Shao, and E. Simon 2019b. “Geospatial Distribution and Accessibility of Primary and Secondary Schools : A Case of Abbottabad City, Pakistan.” Proceedings of the International Cartographic Association 29th International Cartographic Conference (ICC 2019), Tokyo, Japan, July, 15–20. doi:10.5194/ica-proc-2-125-2019.
- Sumari, N. S., Z. Shao, M. Huang, C. A. Sanga, and J. L. Van Genderen. 2017. “Urban Expansion: A Geo-spatial Approach for Temporal Monitoring of Loss of Agricultural LAND.” International Archives of the Photogrammetry, Remote Sensing and Spatial Information Sciences - ISPRS Archives 42 XLII-2/W7 (2W7): 1349–1355. doi:10.5194/isprs-archives-XLII-2-W7-1349-2017.
- Tanveer, H., T. Balz, S. Sumari, and R. Shan. 2019. “Pattern Analysis of Substandard and Inadequate Distribution of Educational Resources in Urban–rural Areas of Abbottabad, Pakistan.” GeoJournal. doi:10.1007/s10708-019-10029-x.
- Terfa, B. K., N. Chen, X. Zhang, and D. Niyogi. 2020. “Urbanization in Small Cities and Their Significant Implications on Landscape Structures : The Case in Ethiopia.” Sustainability 12: 1235. doi:10.3390/su12031235.
- Trinder, J., and Q. Liu. 2020. “Assessing Environmental Impacts of Urban Growth Using Remote Sensing.” Geo-Spatial Information Science 23 (1): 20–39. doi:10.1080/10095020.2019.1710438.
- Tsou, M., H. Zhang, A. Nara, and S. Yeon. 2015. “Estimating Hourly Population Distribution Change at High Spatiotemporal Resolution in Urban Areas Using Geo-tagged Tweets, Land Use Data, and Dasymetric Maps.”
- Twumasi, N. Y. D., C. Chisenga, N. Saleem, N. N. Lyimo, and O. Altan. 2019. “Impact Quantification of Decentralization in Urban Growth by Extracting Impervious Surfaces Using ISEI in Model Maker.” Sustainability 12: 380. doi:10.3390/su12010380.
- Ujoh, F., T. Igbawua, and M. Ogidi Paul. 2019. “Suitability Mapping for Rice Cultivation in Benue State, Nigeria Using Satellite Data.” Geo-Spatial Information Science 22 (4): 332–344. doi:10.1080/10095020.2019.1637075.
- UN-Habitat. 2009. Tanzania : Morogoro PROFILE. United nations Human Settlements Programme. Nairobi, Kenya: UN-HABITAT.
- United Nations, Department of Economic and Social Affairs Population Division. 2018. World Urbanisation Prospects: The 2018 Revision. New York: United Nations.
- URT-The United Republic of Tanzania. 2009. “Tanzania-Agriculture Sample Census Survey 2007/08.”
- URT-The United Republic of Tanzania. 2016a. “2015 TANZANIA IN FIGURES National Bureau of Statistics Dar Es Salaam.”
- URT-The United Republic of Tanzania. 2016b. “Morogoro Region Basic Demographic and Socio-Economic Profile 2012 Population and Housing Census.” www.nbs.go.tz
- Von Döhren, P., and Haase, D. 2015. “Ecosystem Disservices Research: A Review of the State of the Art with A Focus on Cities.” Ecological Indicators 52: 490–497. doi:10.1016/j.ecolind.2014.12.027.
- Weiler, A., M. Grossniklaus, and M. H. Scholl. 2016. “Situation Monitoring of Urban Areas Using Social Media Data Streams.” Information Systems 57: 129–141. doi:10.1016/j.is.2015.09.004.
- Xu, G., L. Jiao, M. Yuan, T. Dong, B. Zhang, and C. Du. 2019b. “How Does Urban Population Density Decline over Time? An Exponential Model for Chinese Cities with International Comparisons.” Landscape and Urban Planning 183:: 59–67. doi:10.1016/j.landurbplan.2018.11.005.
- Xu, G., T. Dong, P. Brandful, L. Jiao, N. S. Sumari, B. Chai, and Y. Liu. 2019a. “Urban Expansion and Form Changes across African Cities with a Global Outlook: Spatiotemporal Analysis of Urban Land Densities.” Journal of Cleaner Production 224: 802–810. doi:10.1016/j.jclepro.2019.03.276.
- Yin, L., Q. Cheng, Z. Wang, and Z. Shao. 2015. “Big Data for Pedestrian Volume : Exploring the Use of Google Street View Images for Pedestrian Counts.” Applied Geography 63:: 337–345. doi:10.1016/j.apgeog.2015.07.010.
- Zhang, G., X. Guo, D. Li, and B. Jiang. 2019c. “Evaluating the Potential of LJ1-01 Nighttime Light Data for Modeling Socio-economic Parameters.” Sensors 19: 6. doi:10.3390/s19061465.
- Zhang, H., X. Ning, Z. Shao, and H. Wang. 2019a. “Spatiotemporal Pattern Analysis of China’s Cities Based on High-resolution Imagery from 2000 to 2015.” In ISPRS International Journal of Geo-Information 8: 241. doi:10.3390/ijgi8050241.
- Zhang, L., Q. Weng, and Z. Shao. 2017. “An Evaluation of Monthly Impervious Surface Dynamics by Fusing Landsat and MODIS Time Series in the Pearl River Delta, China, from 2000 to 2015.” Remote Sensing of Environment 201 (August): 99–114. doi:10.1016/j.rse.2017.08.036.
- Zhang, L., Z. Shao, J. Liu, and Q. Cheng. 2019b. “Deep Learning Based Retrieval of Forest Aboveground Biomass from Combined LiDAR and Landsat 8 Data.” Remote Sensing 11: 1459. doi:10.3390/rs11121459.
- Zhang, Y., Q. Li, H. Huang, W. Wu, X. Du, and H. Wang. 2017. “The Combined Use of Remote Sensing and Social Sensing Data in Fine-Grained Urban Land Use Mapping: A Case Study in Beijing, China.” Remote Sensing, no. 9: 865. doi:10.3390/rs9090865.
- Zhilin, L. I., X. Gong, J. Chen, J. Mills, L. I. Songnian, X. U. Zhu, T. I. Peng, and W. U. Hao. 2020. “Functional Requirements of Systems for Visualization of Sustainable Development Goal (SDG) Indicators.” Journal of Geovisualization and Spatial Analysis 4: 5. doi:10.1007/s41651-019-0046-x.
- Zhou, L., Q. Sun, X. Dang, and S. Wang. 2019. “Comparison on Multi-Scale Urban Expansion Derived from Nightlight Imagery between China and India.” Sustainability 11: 4509. doi:10.3390/su11164509.
- Zhou, X., and L. Zhang. 2016. “Crowdsourcing Functions of the Living City from Twitter and Foursquare Data.” Cartography and Geographic Information Science 43 (5): 393–404. doi:10.1080/15230406.2015.1128852.