
 ?Mathematical formulae have been encoded as MathML and are displayed in this HTML version using MathJax in order to improve their display. Uncheck the box to turn MathJax off. This feature requires Javascript. Click on a formula to zoom.
ABSTRACT
The demand for tree height derivation is increasing year by year, especially for large plantation and forest area. The conventional method needs a long time to complete tree measurement for large forest area, especially when using a pole, measuring tape, rangefinder, clinometer, and tree climbing. This study aims to evaluate the height of oil palm tree based on crown diameter by using a multi-rotor Unmanned Aerial Vehicle (UAV). Digital Elevation Model (DEM) and orthophoto were generated by using Agisoft software, while oil palm tree crown diameter was delineated by using seed generation with Quantum Geographic Information System (QGIS) and Seeded Region Growing (SRG) segmentation methods in the System for Automated Geoscientific Analysis (SAGA). The study validates the results between the actual tree height and tree height estimated from UAV. The results showed that the orthophoto was successfully generated with a Ground Sampling Distance (GSD) of 2.95 cm and 129 tree crowns were successfully analyzed. The accuracy of the tree height as compared to the actual measurement was 57.7 cm. In conclusion, UAV images are capable of determining the tree height after going through the correct procedure to help foresters in their daily task.
1. Introduction
The biomass, growing stock, stand growth, and carbon stock are important parameters to determine site quality of the specific area in which qualitative description of trees can be verified from tree height (Balenovi et al. Citation2015). The survival of the tree depends on the competition for sunlight to identify whether it will grow well, be suppressed, or eventually die. Logically, a tall tree will get more sunlight and vice versa (Birdal, Avdan, and Türk Citation2017). Tree height determination is important to reflect the productivity of species grown on a particular site (Blomley et al. Citation2017). This study focussed on oil palm trees which have a homogeneous pattern and are scientifically known as Elaeis guineensis Jacquin. Oil palm is a “golden crop” in Malaysia, which is the second largest oil yield producer amongst seed crops in the world. In Malaysia, about 16% of land cover was planted with oil palm trees (Pohl, Kanniah, and Loong Citation2018). The forecast on global demand shows a global increase from 12 to 19 million hectares by 2050.
Traditionally, handheld apparatus such as measuring poles or hypsometers is used by trained technicians to determine vegetation height. The other method to determine tree height is by using remote sensing. Technologies such as Light Detection And Ranging (LiDAR) and Aerial Laser Scanning (ALS) could estimate tree height after going through several processes. Previously, LiDAR sensor was attached on manned helicopter or manned plane (Cabo et al. Citation2018). Terrestrial Laser Scanning (TLS) is also one of the sensors to acquire tree height data from the ground and it can provide millimetre accuracy level (Chu et al. Citation2017). The combination of ALS and TLS can even extract the individual tree height (Dyce and Voogt Citation2018). The LiDAR, ALS and TLS are very expensive sensors and they are only suitable for huge project or coverage. These sensors are unsuitable for low budget projects.
Another emerging technique that is used nowadays is Unmanned Aerial Vehicle (UAV) or also known as Unmanned Aircraft System (UAS). Typically, UAS consists of UAV and ground equipment which contains at least a computer workstation for designing and transferring flight course to the UAV. Typically, UAV that is used for agricultural or forestry remote sensing application is much smaller than the conventional aircraft and covers diminutive areas. It is more economical as it consumes less fuel or electrical energy and often needs less sustenance. Due to its higher flexibility as compared to conventional aircraft, UAS has immense potential for diverse remote sensing applications that are tailored to customer needs (Gatziolis et al. Citation2015; Iersel et al. Citation2018; Li et al. Citation2016; Lisein et al. Citation2015; Matese, Di Gennaro, and Berton Citation2017).
Modern UAS approach in the civilian market has encouraged fresh possibilities to map and calculate forest biophysical properties (Miller, Morgenroth, and Gomez Citation2015). The main drawback is its short flight time, and thus a relatively diminutive-sensed area (Mohan et al. Citation2017). Several studies were conducted by using ALS and hyperspectral and multi-spectral images to estimate the canopy heights based on LiDAR platform (Ok and Ozdarici-ok Citation2017; Nugroho et al. Citation2015; Panagiotidis et al. Citation2017). There are not many research studies on tree heights calculation based on crown diameters, especially in Malaysia. Because Malaysia has abundant plantations, forests, and mangroves, information on tree height can be very valuable in the future (Puliti et al. Citation2017).
Therefore, in the last few decades, there were many studies on Canopy Height Model (CHM) by using UAV to explore the capability of UAV to identify tree characteristics at a specific forest (Stone et al. Citation2016). In a recent study, UAV was used with consumer–grade onboard system to estimate tree heights and crowns by using different sensors (Suhardiman, Tsuyuki, and Setiawan Citation2016). The study area was in the urban forest of Eskisehir City, Turkey. The forest was approximately 15 ha and the site selection was roughly 1 ha of the forest area. Trees in the forest were mostly black and Scots pines, which made a coniferous forest. A lightweight UAV platform (eBee) was used throughout the study. Then, the UAV was flown over the study area for 28 minutes and afterward took the Ground Control Point (GCP) measurements. Next, at the ground measurement stage, 53 trees were measured based on their clarity to be identified in nadir imagery. The point cloud was classified into ground points or non-ground points. Triangular Irregular Network (TIN) was created based on these ground points.
Another recent study used high spatial temporal imagery to model floodplain vegetation which covered about 116 ha. The study had determined the greenness of the growing season at the selected vegetation whereby field plots of about 15 m × 15 m of which average different low vegetation height, terrain height, and vegetation greenness were selected. It was found that the closest vegetation element can be identified within 0.1 m radius.
Traditional techniques of measuring tree height, such as by using a pole, measuring tape, rangefinder, clinometer, and tree climbing are tedious and need a long time to complete, especially when a large forest area is involved (Rosca et al. Citation2018). Most of the areas have rugged terrain and are difficult to access, and thus could jeopardize workers safety. Therefore, the conventional method is time consuming, exhausting, uneconomical, and unideal for the current situation (Surový, Ribeiro, and Panagiotidis Citation2018; Tuominen et al. Citation2015; Webster et al. Citation2018).
In this study, method of estimating tree heights based on crown diameter was introduced. There is still a lack of study on tree heights estimation based on crown diameter, and thus this study presents the methods in overcoming tree heights estimation problem to compensate other studies in this field. The aim of this study is to evaluate tree heights based on crown diameter by using a multi-rotor UAV.
2. Materials and methods
In this study, data acquisition was conducted on 8 October 2018 at Jalan Kapar Setia, Kapar, Selangor. The study area was roughly located at 3° 8ʹ 7.84” N and 101° 23ʹ 17.39” E. The data acquired were on a plot of plantation land, which was beside a residential area and in front of a main road. The study area was approximately 3 ha. The study was focused only on oil palm trees, specifically of Elaeis guineensis Jacquin. There are two species in Elaeis genus, which are Elaeis guineensis (African oil palm) and Elaeis oleifera (American oil palm). A total of 235 oil palm trees on the site were analyzed in this study. Oil palm tree has crown spread that is uniform and not too insignificant with each other, and its height is not too tall to measure. The age of these oil palm trees is about 19 to 20 years old. shows the study area location. In photogrammetry, calibration is needed before doing any data acquisition. The calibrations included in this study were camera and UAV.
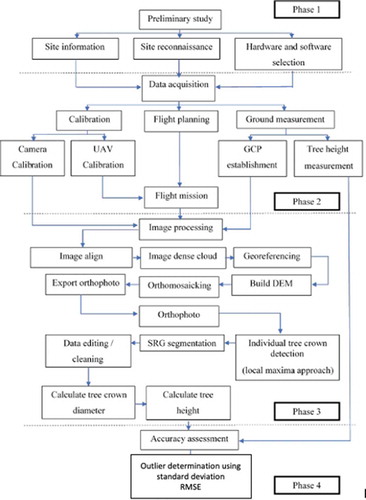
illustrates the study methodology workflow. Camera calibration is an important process in photogrammetry. It is the initial step in many machine visions and photogrammetric applications. Camera calibration is the process of determining the characteristics of a camera that can be used as a measurement tool. It is also provided with several camera parameters that are used as inputs in flight planning and photogrammetric processing. The camera calibration parameters were obtained from PhotoModeler standard version 2017 software which was developed by PhotoModeler Technologies. PhotoModeler can utilize the photographs taken by different types of camera. PhotoModeler uses the image information in a photograph, which are necessary values for several specific camera parameters. The elements of interior orientation in camera calibration are such as focal length, principal point, lens distortion, and lens resolution.
Figure 1. Study area.
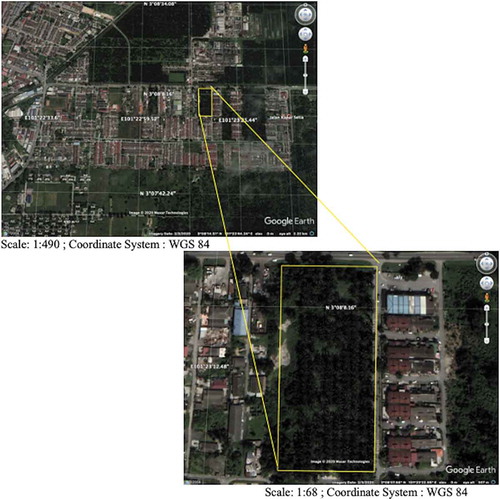
Figure 2. Methodology workflow.
Both commercial and consumer drones will facilitate the use of sophisticated technologies. For flight planning, the coverage area of the image captured must be enough to cover the whole plantation area. For this purpose, the Altizure application was used. Altizure provides users with easy settings and procedure for any photogrammetry aerial work. In , the flight planning of the study is shown to automatically cover the study area. Users can set to regulate the forward overlap and side overlap for image capture and set the drone speed. In this study, a forward overlap of 80% and side overlap of 65% were chosen because they were the minimum requirements for producing a high accuracy orthophoto. The flying height was set at 70 m so as to cover enough of the study area. describes the specification of UAV camera used in this study.
Figure 3. Flight planning covering the study area using Altizure.
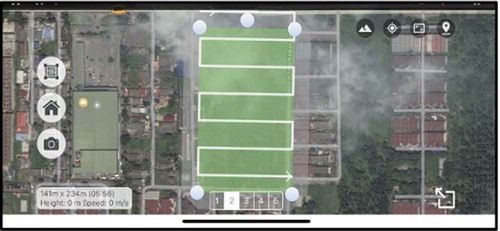
Table 1. Specification of UAV camera.
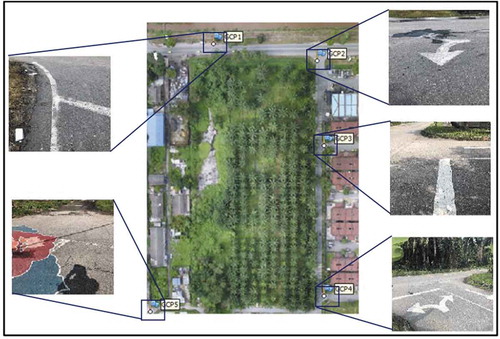
The ground measurement for this study was divided into two. Firstly, survey to obtain the coordinates and height of each GCP allocated throughout the study area. In this study, real-time kinematic was used for positioning application. Five GCPs were established to surround the study area. shows the GCP positions surrounding the study area.
Figure 4. GCP allocation.
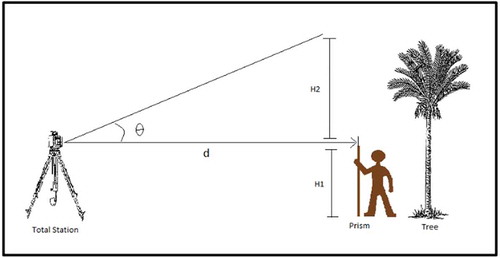
The tree heights were measured by using a total station and a prism. Trigonometric calculation was used to derive the tree heights. The trigonometric calculation can be done as the ground used for measurement was flat. The actual tree height can be determined by using the method as illustrated in .
Figure 5. On site measurement of tree height using total station.
Before the data analysis, data processing phase was first done. The steps involved were image pre-processing which included the production of orthophoto that was segmented. Second was by using the local maxima approach in the QGIS Standalone Version 3.10 developed by the QGIS Development Team and Seeded Region Growing (SRG) in SAGA GIS software Version 6 developed by the Institute of Geography, Section of Physical Geography in the Klima Campus of Hamburg University, Germany to delineate the tree crown. Third, was the calculation of tree crown diameter by using ArcGIS field calculation. Then, a specific equation was used to calculate the tree height from crown diameter.
2.1. Image preprocessing
To produce the orthophoto, Agisoft PhotoScan Pro Version 1.3.1 developed by Agisoft LLC was used. There were certain steps needed to achieve a good quality orthophoto. The main aim of image pre–processing was to produce a georeferenced 3D-point cloud to handle irregular and overlapping aerial image data. A software to generate a 3D-point cloud, such as the Agisoft PhotoScan was used in this study. The software is advanced in UAV applications and will generate the DSM and orthophoto. After image acquisitions were completed, the selection of good quality images was needed. Many images were captured, but not all can be used in data processing. In this study, the images were selected based on their position, view, brightness, and angle. The second stage was to align the photostock to estimate the camera position for each photo, find the matching points in overlapping images, and generate a sparse point cloud. In this process, high was chosen for accuracy, generic was chosen for pair preselection, and default was set in the advanced setting.
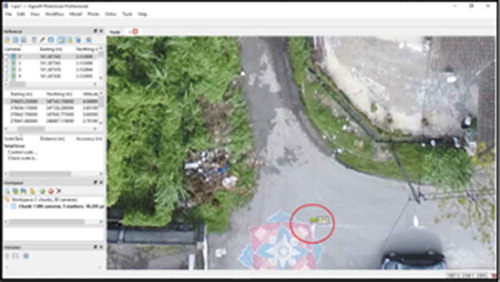
The third stage was to place markers. The use of markers was to optimize the camera positions and orientation data, which will improve the referencing results. First was to choose a photo of which GCP was visible in the Photo View. Second was to place markers to zoom in to pin-point the GCP on the photo and then place a marker in the corresponding point of the image by using Add Marker command by double clicking at the photo context. The previous step was repeated for every GCP that was needed for location. shows the GCP that was placed and set.
Figure 6. Marker placed in Agisoft.
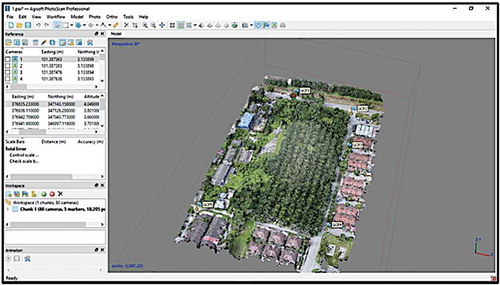
The fourth stage was to optimize camera alignments. Optimizing the camera is crucial to achieve a high accuracy in calculating the cameras’ external and internal parameters and to control possible distortion. The “Optimize” button on the “Reference” pane toolbar was used. Camera parameters such as focal length (f), principal points x and y (cx, cy), radial lens distortion (k1, k2, k3), tangential lens distortion (p1, p2), scale factor (b1), and affinity (b2) were chosen in this study. The fifth stage was to build a dense point cloud. In this process, high quality was chosen. Under advanced setting, “aggressive filtering” and proceed to the next step. shows the result of the image dense cloud.
Figure 7. Dense cloud result.
The sixth stage was to build DEM to represent the Earth’s surface and include all objects on it. It gave the impression of surrounding area height that was covered by this study. In “Build DEM” wizard, “Dense Cloud” was chosen as the source of data and other settings were kept in default. The final stage was to produce orthophoto through the process of orthomosaicking. DEM was used as an input to create orthophoto.
2.2. Image segmentation
In this study, the tree crown delineation by using segmentation was not a straightforward process. It involved two software, namely QGIS and SAGA to get the segmentation results. shows the flow of getting the segmentation result. The red fill shows that it was done by using QGIS, while the blue fill shows that it was done by using SAGA.
Figure 8. Workflow in segmentation process.
The orthophoto was imported in the QGIS to be analyzed. Seed point generation was used as the first tool to conduct this process. By using this tool, the software will create vector points on each pixel of the image on which each point has attributes according to the spectral value of each pixel in the orthophoto. For this study, only the local maxima approach was used to generate seed points for identifying tree tops. The “Local Maxima” and “minima tools” in the processing toolbox were chosen in the QGIS. The orthophoto was imported and the directory was chosen for the file to be saved. The saved file was in vector form (points). After the seed points were generated, the seeds were filtered by choosing only the seed point values that corresponded to the tree crown or tree top. The “Features” was selected by using an expression tool in the table that was created after the previous step. The values were mostly identical and had much distinction than the seed point values from the object on ground. This step was done manually and carefully, as choosing the wrong value can mislead the segmentation process. The pixel values that corresponded to the tree top were chosen.
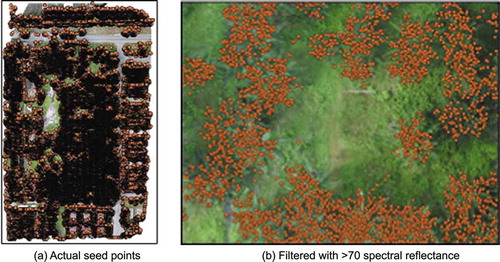
Seed generation is a very important step, as it determines the growing region for the SRG segmentation method. By using QGIS, the seed points were generated by using local maxima method. The seed points generated were in every pixel of the image based on the spectral reflectance of each pixel. Then, the points were filtered by only the points that were inside the study area. The points were also filtered further to choose the reflectance value above the specified value of tree tops. In this case, it was >70 because that was the minimum reflectance value on tree top which was going higher. The other reflectance values were low enough to be considered as tree tops. ) shows the actual seed points of the whole study area, while ) shows a zoomed view of the points after filtration. It also shows the filtered points which were not considered as tree tops.
Figure 9. Seed points.
After the seed points were filtered, the seed points in the region growing algorithm were used in the SAGA. It had to be converted from a vector file to a raster file. The “Rasterize” module from the GDAL conversion is in QGIS. It is critical to create a raster file that contains only the “seed points” and “no-data”. Therefore, every pixel outside the seed points has to be “no-data”. It is also critical that the rasterized vector image has the exact same CRS (Coordinate Reference System), extent, and pixel size as the single band images. It happens regularly whereby the extent and pixel size of the rasterized vector file did not match the split band images 100% although the previous steps were meticulously followed. In this case, the “OTB Superimpose Vector” tool in the “Processing” toolbox was used. The result was very much the same as the first rasterized vector in which the extent and pixel size were now 100% the same as in the split band images.
After the seed points were generated by using the local maxima method, the next step was to segment the resulting seed points in the SAGA software Version 6. Before the seed points were used to segment, they were rasterized to be used in the SAGA. Seed points that were rasterized were not in the same extent as the orthophoto. The image needed to be superimposed with the same extent as the orthophoto so that it could be displayed in the SAGA along with the orthophoto that was segmented. It was very important to import the two images in the same canvas, as the SRG method really emphasized on the seed points and orthophoto to determine the growing region of the segmentation. SAGA was used to segment the tree crown by using the SRG segmentation tool. This method produced polygon for every feature in the image.
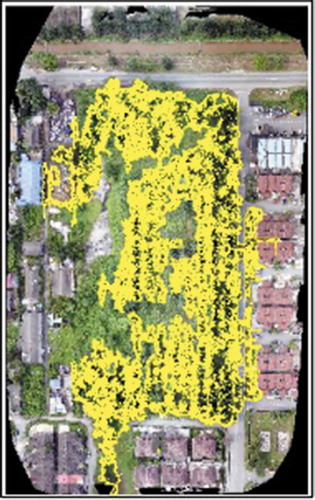
After the image was segmented (), the raster layer was converted into polygon layer. The next step was to convert the layer from raster into vector (polygon). More information was extracted from the polygon layer whereby it provided attribute table (information) and was easy to analyze. The weakness of SRG was that all polygon outputs did not represent the tree crowns, and thus data cleaning had to be done manually by using the “Editor Tools” in ArcMap to clear unnecessary polygons or features that were unneeded for this study. This was called over segmentation. The over segmentation was not due to the classic problem of image nature, but it was due to the complex tree crowns which did not conform to the assumption.
Figure 10. SRG displayed in ArcMap.
After that, seeded “region growing segment” tool was used in the imagery-segmentation toolset. This segmentation delineated the tree canopy. The “Find and Run” tool was proceeded in SAGA. The “vectorizing grid” was typed in and the “Vectorizing Grid Classes” was selected. This created polygons in a shapefile format that can then be opened in ArcGIS.
2.3. Tree crown diameter calculation
The tree crown diameter, which is a circle that encloses the projection of a tree crown, is essential for understanding the ecosystems. It can be varied when viewed from a distance and therefore can be argued. The tree crown diameter could determine a certain degree of tree spread. The measurements are usually conducted with an average of two perpendicular directions which are both centred on top of a tree and which means the average of the longest and the shortest spread of a tree. Generally, crown diameter is measured by using terrestrial measurements. The easiest way to calculate the crown diameter is to take two measurements of the widest at 90 degrees of which the perpendicular measurement is at the shortest and longest spread of tree (Yilmaz et al. Citation2017).
After segmentation, the tree crown was segmented as an irregular polygon with a unique ID. Each polygon area can be calculated by using “Calculate geometry” and then selecting “Area” in ArcGIS. To calculate the tree crown diameter, the formula to calculate the area of a circle can be used of which the formula had to be rearranged to get the radius of the tree crown, which can later be used to calculate its diameter. This formula could be used for homogeneous tree pattern because the crown diameter of homogeneous tree has almost the same pattern, and thus it is easy to derive the tree crown diameter. Therefore, the formula can be rearranged as shown in EquationEquation (1)(1)
(1) .
where r is radius of tree crown.
Next, multiply the radius by two (2) to get the diameter of the tree crown.
2.4. Tree height from tree crown diameter
For the calculation of tree height, the formula adapted from Tiede, Hochleitner, and Blaschke (Citation2005) was used, as shown in EquationEquation (2)(2)
(2) .
where CD is diameter of a tree crown, TH is tree height, a is smallest detectable crown width, and b is diameter at breast height.
From the formula, the considered variables are as follows:
1) Smallest detectable crown width: a.
The width of a tree crown can be measured from edge–to–edge through the crown centre. However, that depends on the axis whether the crown have regular or irregular shape. Therefore, the smallest crown width needs to be identified for the tree crown detection ().
Figure 11. Tree crown width measurement.
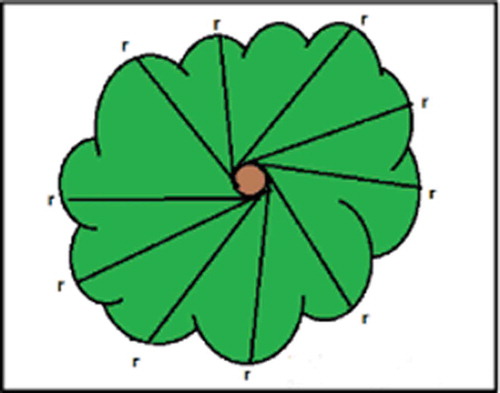
The width measurements were averaged by using the most common arithmetical mean, as described in EquationEquation (3)(3)
(3) .
where aarithmetic is crown width using arithmetic mean, r is radius of each tree crown spread, and n is total number of tree crown spread.
In this study, a total of 235 trees were measured on the site. The width of each tree from the 235 trees measured was 2.75 m, which was the smallest detectable crown width in the study area.
2) Diameter at breast height: b.
Diameter at Breast Height (DBH) is one of the parameters needed for tree crown detection. DBH measures the diameter of standing tree trunk. It usually measures 1.3–1.4 m from ground, depending on the types of tree and forest. In this study, the DBH was at 1.4 m above ground level according to the standard Malaysian DBH measurement. This was also one of the most tiresome processes in this study. By using a diameter tape to cover the tree trunk, the diameter was then calculated by using the formula for circumference. A total of 235 trees were calculated for their DBH on site, and it was found that the values were consistent from the lowest at 0.30 m to the highest at 0.33 m.
Next, the tree height calculation was done by using the “Field Calculator” function in the ArcGIS. In this study, it was assumed that the highest tree has a bigger crown width, depending on the forest density and different climate change, which will effect the crown width coherence. Due to the very heterogeneous forest structure, the formula was more robustly compromised and was not calibrated for special species or specific structures. To do this, the “Field Calculator” was clicked, “DBH” field was added, and the respective DBH for each tree was entered according the tree ID. Next, the field calculator was used and EquationEquation (2)(2)
(2) was entered and rearranged to calculate the tree height, as shown in EquationEquation (4)
(4)
(4) .
After all the steps were completed, the tree height from the crown diameter could be achieved.
3. Results and discussions
The coordinates of all ground control points were executed by using GPS method with MyRTKnet observation that consisted of five (5) ground control points. Therefore, all the northing, easting, and height were measured by the method. The result of the coordinates and height was achieved for each ground control points based on MyRTKnet (GDM2000) and the final coordinates were converted into RSO projection for photogrammetry work, as shown in .
Table 2. Coordinates of GCPs in RSO projection.
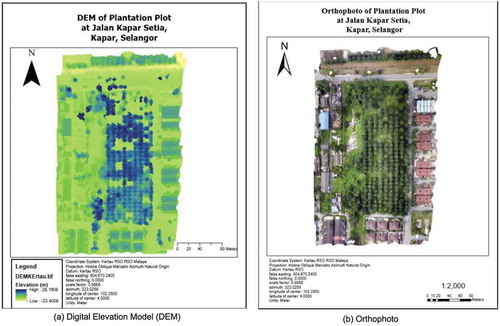
By using Agisoft PhotoScan, the software was able to generate DEM for the production of orthophoto that was needed for the segmentation process. ) shows the DEM obtained from the study area, while ) shows the orthophoto obtained after preprocessing was completed in the Agisoft PhotoScan. The orthophoto processed had a GSD of 2.95 cm/pixel.
Figure 12. Photogrammetric results at the study area.
The results showed that all the tree crowns were delineated, but there were a few tree crown segmentation that encroached each other and merged with the neighbouring tree as one polygon. This made the number of tree crowns delineated not as accurate as the number of trees on ground. This often happens to tree crowns that are close to other features, such as roads, buildings, or small buildings. The manual cleaning of data was needed to avoid the assumption that these polygons were tree crowns. Also, not all tree crowns were segmented successfully, as there were a few tree crowns that were not segmented correctly, and thus showing irregular polygons that did not encroach the tree crown. This data was exempted from the analysis part, and thus lessening the analysis of tree. At the end of the data cleaning and managing, only a total of 202 tree crown was successfully segmented. Editing the ID in the attribute table to match with the tree ID assigned on ground also had to be done for accuracy assessment. This made data managing step the longest and most tiring part of the study. Future studies have to find ways to overcome this weakness.
This segmentation is one of the various segmentation and classification methods available in SAGA. Each segmentation method needs different parameters and can produce different outcomes according to the study needs. From the result, it could be observed that the SRG also delineated the surrounding buildings and low vegetation. This could be overcome by using a mask to delineate only the area that needed to be segmented. To overcome the results such as the merging of segmented tree crown, trial and error in assigning the parameters, such as variance in feature space, variance in position, and similarity threshold could be done to get a much more reliable result.
3.1. Tree height from crown diameter
The calculation of tree crown was done by using the area and field calculator in ArcGIS. After each polygon of the tree crown was delineated in SAGA, the result was in raster layer. It had to be converted into vector layer by using a “vectorizing grid classes” tool in SAGA. The result can then be exported into ArcGIS and displayed according to the needs of this study. Most of the created tree crown layers were in the form of polygons from which the area was calculated. The diameter of the tree crown could be calculated by using EquationEquation (1)(1)
(1) in the field calculator. The tree height could be obtained by using EquationEquation (4)
(4)
(4) . The field area was calculated by using the “calculate geometry” function in ArcGIS. The tool would automatically calculate the area of the most irregular polygons achieved by segmentation. After the area of the polygon was calculated, the next step was to calculate the diameter by using EquationEquation (2)
(2)
(2) . From this formula, the tree crown radius would be obtained. Then, to get the diameter of tree crown, the radius values were multiplied by 2.
After the diameter of the crown was calculated, the next step was to use EquationEquation (3)(3)
(3) . The variables that needed to be calibrated were a is smallest detectable crown width and b is diameter at breast height. The tree crown width referred to the horizontal width of the crown, which was taken from dripline to dripline as one moved around the crown and averaged these values to get the crown width. From there, each tree crown needs to be measured by using Agisoft to determine which had the smallest crown width. This made the data collection even longer on ground. Future studies have to make a remark about this formula, as it is flexible, can be compromised, and must be calibrated according to the study area and the types of tree that are chosen to calculate its height, as different trees will give different values.
3.2. Statistics and data validation
Based on the results obtained, the comparison between measured or surveyed tree height and estimated tree height by using UAV was evaluated. First, the errors were calculated between the tree height obtained from the total station and the tree height from UAV. Next, outliers were determined and removed for RMSE calculation. In statistics, outlier is an observation point that is distant from other observations. The outliers in this study were determined by using the standard deviation range. The outlier determined from the standard deviation range was from – 0.385 m to 1.296 m. The errors outside this range were considered as outliers and were excluded from further analysis. shows the graph of all observation data that were within and exceeded the outlier range.
Figure 13. Error graph and outliers range.
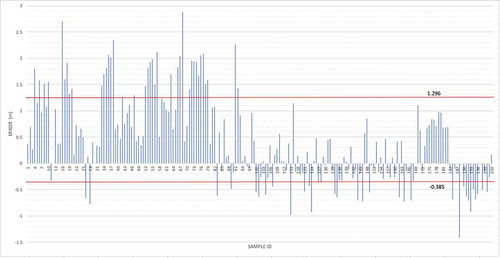
From the 202 raw observation data, 73 were considered as outliers, leaving only 129 data or 64% of the data within the acceptable range. The analysis of the sample included error, standard deviation, and RMSE calculation. A total of 202 trees are chosen as samples for validation. The validation was calculated and evaluated between the actual value and estimated value. It also showed the mean of measurement before outliers, standard deviation of measurement before outliers, and RMSE of measurements after eliminating outliers. There are a total of 129 trees chosen for accuracy assessment analysis after the outliers were removed. Next, the value within the acceptable range was calculated for its RMSE, which was 0.577 m.
Previous studies such as by Balenovi et al. (Citation2015) had tree height RMSE of 3.55 m and 3.42 m on average, Birdal, Avdan, and Türk (Citation2017) had RMSE of 0.28 m, with GSD of 6.41 cm, and another study by Lim et al. (Citation2015) had RMSE of 0.84 m, with GSD of 1.85 cm. In contrast, this study had RMSE outcome of 0.577 m, with GSD of 2.95 cm. From previous studies, it can be seen that it was difficult to achieve a millimetre accuracy level. An RMSE of centimetre-level or metre was quite common in previous studies, as the estimation of tree heights did not need to be highly accurate. However, instead of using sophisticated and high-cost instruments, such as LiDAR and high-end UAV, this study provided a cost-effective way of estimating tree height with the same result by using a commercial UAV which was affordable and can achieve the same or better result.
The RMSE value could also be caused by the tree crown segmentation effect. The tree crown delineation had to be done perfectly to get the closest value of tree crown diameter, however there was weakness in the SRG segmentation method, which made some tree crowns unperfectly delineated or were not wholly in the shape of the tree crown. This will affect the calculation of the tree crown diameter which was used to estimate the tree height. Moreover, this study gave a new method in estimating tree heights based on crown diameter. It was shown in the data collected that there was a relation between tree height and crown diameter. This relation was hinted at this study, as the bigger the crown diameter, the higher the tree were. This relation could and should be explored further in future studies.
The detection of the tree crown was done by using the vector of the feature. All the features in the image can be automatically detected by the software and turned into polygons; hence, the step for this method was needed to mask the study area so that other trees in the masking area were not included.
4. Conclusions and recommendations
The analysis was conducted by using QGIS and SAGA software. The analysis was conducted on an oil palm plot. The local maxima approach and SRG techniques were used to delineate the tree crown. The steps included point generation by using local maxima, point filtering, point rasterization, superimposing, segmentation, and vectorization of raster layer. The result showed that a total of 202 tree crowns (oil palms) were delineated successfully from a total of 235 tree crowns (oil palms) available on site. The initial result showed that the segmented region consisted of tree tops, buildings, roads, and low vegetation in the vector (polygon) layers. Most of the segmented regions of the tree crowns were encroached with non-tree crown features, such as roads and buildings that were close to them. Other than that, some tree crowns were also segmented together as a result. This required manual data cleaning and editing to divide the polygon into its unique tree crown attribute. This was because the segmented technique was according to the point generated from the local maxima that gave a value based on the spectral reflectance of features on the image. The SRG technique segmented the region based on these generated points. Therefore, the polygon created encroached the neighbouring region close to the tree tops that had closer points. This technique could be improved with detailed parameter settings during the point generation. Nevertheless, the SRG technique gave a satisfactory segmentation of the tree crowns. The main purpose of this study is to calculate tree height based on tree crown diameter in order to see whether there existed any relation between tree height and crown diameter or vice versa. The analysis of this objective was achieved through the formula adapted from Tiede, Hochleitner, and Blaschke (Citation2005) that was used to calculate the tree crown diameter based on the tree height. The estimations of tree height based on crown diameter were achieved through formula rearrangement. The result showed that the formula achieved the calculation of tree height based on the crown diameter.
The validation of the estimated data had to follow the steps in order to analyze whether or not the surveyed data that used UAV were reliable for future studies. The data that were first calculated were residual by subtracting the mean error with the difference in value between measured and estimated values. The residual data were then excluded from the outliers by using the range standard deviation. A total of 202 raw estimated data were obtained from the UAV measurement. From these values, 129 data were within the standard deviation range and used for further analysis. The next step was to calculate the RMSE of the residual, and the calculated result was 0.577 m. The value obtained accounted of many reasons, such as high GSD of the orthophoto, the tree crown segmentation effects, and other random errors related in the study, such as manual data cleaning and site measurement. Comparing with previous studies, this value was considered normal, as tree height measurement does not need to be high in accuracy.
This study demonstrated that UAV images capable to determine tree crown and tree height after specific image processing. The estimations of tree height based on crown diameter were achieved in this study. This could open new doors to UAV usage for future studies in order to collect various forest spatial information. As tree height is one of the most important attributes in town planning and management of trees, this study could be vital in making estimation much easier and cost-saving by using UAV rather than the traditional methods.
Moreover, the recommendation is to improve the technique presented in this study for future work. Therefore, it is recommended to carry out this matter to improve the method, such as the estimation of tree height in this study, which is relatively in the early stage. Future studies need to look up to a more detailed and easy way to conduct the processing. Processing such as segmentation could take up so much time and space. The SRG segmentation used in this study has a weakness, such as it needed to detect the seed points accurately to perform a better region growing segmentation. Poor point allocations can lead to poor segmentation results. Although the formula used in this study is flexible, it has to be calibrated according to the type of tree needed to be analyzed. Future studies have to find better ways in estimating tree heights other than relying on one single formula. It was also exhausting to collect the data needed to fulfil the formula.
Acknowledgments
The authors would also like to thank the people who were directly or indirectly involved in this research.
Additional information
Funding
Notes on contributors
Muhamad Farid Ramli
Muhamad Farid Ramli is a graduate student in Centre of Studies for Surveying Science and Geomatics, Univesiti Teknologi MARA. His research interests include Unmanned Aerial Vehicle (UAV) for mapping, photogrammetry and modeling.
Khairul Nizam Tahar
Khairul Nizam Tahar is a senior lecturer in Centre of Studies for Surveying Science and Geomatics, Univesiti Teknologi MARA. He received his Ph.D in Department of Geoinformatics, Universiti Teknologi Malaysia. His research interests include drone for mapping, photogrammetry, geomatics and Geographical Information System (GIS).
References
- Balenovi, I., A. Seletkovi, R. Pernar, and A. Jazbec. 2015. “Estimation of the Mean Tree Height of Forest Stands by Photogrammetric Measurement Using Digital Aerial Images of High Spatial Resolution.” Annals of Forest Research 58 (1): 125–143.
- Birdal, A. C., U. Avdan, and T. Türk. 2017. “Estimating Tree Heights with Images from an Unmanned Aerial Vehicle.” Geomatics, Natural Hazards and Risk 8 (2): 1144–1156. doi:10.1080/19475705.2017.1300608.
- Blomley, R., A. Hovi, M. Weinmann, S. Hinz, I. Korpela, and B. Jutzi. 2017. “Tree Species Classification Using within Crown Localization of Waveform LiDAR Attributes.” ISPRS Journal of Photogrammetry and Remote Sensing 133: 142–156. doi:10.1016/j.isprsjprs.2017.08.013.
- Cabo, C., C. Ordóñez, C. A. López–sánchez, and J. Armesto. 2018. “Automatic Dendrometry: Tree Detection, Tree Height and Diameter Estimation Using Terrestrial Laser Scanning.” International Journal of Applied Earth Observation and Geoinformation 69: 164–174. doi:10.1016/j.jag.2018.01.011.
- Chu, T., M. J. Starek, M. J. Brewer, and C. S. Murray. 2017. “Multi-platform UAS Imaging for Crop Height Estimation: Performance Analysis over an Experimental Maize Field.” IGARSS 1: 4338–4341.
- Dyce, D. R., and J. A. Voogt. 2018. “The Influence of Tree Crowns on Urban Thermal Effective Anisotropy.” Urban Climate 23: 91–113. doi:10.1016/j.uclim.2017.02.006.
- Gatziolis, D., J. F. Lienard, A. Vogs, and N. S. Strigul. 2015. “3D Tree Dimensionality Assessment Using Photogrammetry and Small Unmanned Aerial Vehicles.” Plos One 10 (9): 1–21. doi:10.1371/journal.pone.0137765.
- Iersel, W., M. Van Straatsma, E. Addink, and H. Middelkoop. 2018. “Monitoring Height and Greenness of Non-woody Floodplain Vegetation with UAV Time Series.” ISPRS Journal of Photogrammetry and Remote Sensing 141: 112–123. doi:10.1016/j.isprsjprs.2018.04.011.
- Li, W., Z. Niu, H. Chen, D. Li, M. Wu, and W. Zhao. 2016. “Remote Estimation of Canopy Height and Aboveground Biomass of Maize Using High-Resolution Stereo Images from a Low-cost Unmanned Aerial Vehicle System.” Ecological Indicators 67: 637–648. doi:10.1016/j.ecolind.2016.03.036.
- Lim, Y. S., P. H. La, J. S. Park, M. H. Lee, M. W. Pyeon, and J.-I. Kim. 2015. “Calculation of Tree Height and Canopy Crown from Drone Images Using Segmentation.” Journal of the Korean Society of Surveying, Geodesy, Photogrammetry and Cartography 33(6): 605–614. doi:10.7848/ksgpc.2015.33.6.605.
- Lisein, J., A. Michez, H. Claessens, and P. Lejeune. 2015. “Discrimination of Deciduous Tree Species from Time Series of Unmanned Aerial System Imagery.” Plos One 10 (11): 1–20. doi:10.1371/journal.pone.0141006.
- Matese, A., S. F. Di Gennaro, and A. Berton. 2017. “Assessment of a Canopy Height Model (CHM) in a Vineyard Using UAV-based Multispectral Imaging.” International Journal of Remote Sensing 38 (8): 2150–2160. doi:10.1080/01431161.2016.1226002.
- Miller, J., J. Morgenroth, and C. Gomez. 2015. “3D Modelling of Individual Trees Using a Handheld Camera: Accuracy of Height, Diameter and Volume Estimates.” Urban Forestry & Urban Greening 14 (4): 932–940. doi:10.1016/j.ufug.2015.09.001.
- Mohan, M., C. A. Silva, C. Klauberg, P. Jat, G. Catts, A. Cardil, A. T. Hudak, and M. Dia. 2017. “Individual Tree Detection from Unmanned Aerial Vehicle (UAV) Derived Canopy Height Model in an Open Canopy Mixed Conifer Forest.” Forests 8 (9): 1–17. doi:10.3390/f8090340.
- Nugroho, G., Z. Taha, T. S. Nugraha, and H. Hadsanggeni. 2015. “Development of a Fixed Wing Unmanned Aerial Vehicle (UAV) for Disaster Area Monitoring and Mapping.” Journal of Mechatronics, Electrical Power, and Vehicular Technology 6 (2): 83–88. doi:10.14203/j.mev.2015.v6.83-88.
- Ok, A. O., and A. Ozdarici-ok. 2017. “2-D Delineation of Individual Citrus Trees from UAV-based Dense Photogrammetric Surface Models.” IJDE 11 (6): 583–608.
- Panagiotidis, D., A. Abdollahnejad, P. Surový, and V. Chiteculo. 2017. “Determining Tree Height and Crown Diameter from High-resolution UAV Imagery.” International Journal of Remote Sensing 38 (8): 2392–2410. doi:10.1080/01431161.2016.1264028.
- Pohl, C., K. D. Kanniah, and C. K. Loong. 2018. “Monitoring Oil Palm Plantations in Malaysia.” IEEE International Geoscience and Remote Sensing Symposium, IGARSS 1: 2556–2559.
- Puliti, S., T. Gobakken, H. O. Ørka, and E. Næsset. 2017. “Assessing 3D Point Clouds from Aerial Photographs for Species-Specific Forest Inventories.” Scandinavian Journal of Forest Research 32 (1): 68–79. doi:10.1080/02827581.2016.1186727.
- Rosca, S., J. Suomalainen, H. Bartholomeus, and M. Herold. 2018. “Comparing Terrestrial Laser Scanning and Unmanned Aerial Vehicle Structure from Motion to Assess Top of Canopy Structure in Tropical Forests.” Interface Focus 8 (2): 1–11. doi:10.1098/rsfs.2017.0038.
- Stone, C., M. Webster, J. Osborn, and I. Iqbal. 2016. “Alternatives to LiDAR-derived Canopy Height Models for Softwood Plantations: A Review and Example Using Photogrammetry.” Australian Forestry 79 (4): 271–282. doi:10.1080/00049158.2016.1241134.
- Suhardiman, A., S. Tsuyuki, and Y. Setiawan. 2016. “”Estimating Mean Tree Crown Diameter of Mangrove Stands Using Aerial Photo”.” Procedia Environmental Sciences 33: 416–427. doi:10.1016/j.proenv.2016.03.092.
- Surový, P., N. A. Ribeiro, and D. Panagiotidis. 2018. “Estimation of Positions and Heights from UAV-sensed Imagery in Tree Plantations in Agrosilvopastoral Systems.” International Journal of Remote Sensing 39 (14): 4786–4800. doi:10.1080/01431161.2018.1434329.
- Tiede, D., G. Hochleitner, and T. Blaschke. 2005. “A Full GIS-based Workflow for Tree Identification and Tree Crown Delineation Using Laser Scanning.” CMRT05, IAPRS 36 (3): 9–14.
- Tuominen, S., A. Balazs, H. Saari, I. Pölönen, J. Sarkeala, and R. Viitala. 2015. “Unmanned Aerial System Imagery and Photogrammetric Canopy Height Data in Area-based Estimation of Forest Variables.” Silva Fennica 49 (5): 1–19. doi:10.14214/sf.1348.
- Webster, C., M. Westoby, N. Rutter, and T. Jonas. 2018. “Three-dimensional Thermal Characterization of Forest Canopies Using UAV Photogrammetry.” Remote Sensing of Environment 209: 835–847. doi:10.1016/j.rse.2017.09.033.
- Yilmaz, V., C. Serifoglu Yilmaz, L. Tasci, and O. Gungor. 2017. “Determination of Tree Crown Diameters with Segmentation of a UAS-based Canopy Height Model.” IPSI BGD Transactions on Internet Research 13 (2): 63–67.