
 ?Mathematical formulae have been encoded as MathML and are displayed in this HTML version using MathJax in order to improve their display. Uncheck the box to turn MathJax off. This feature requires Javascript. Click on a formula to zoom.
ABSTRACT
Streets and physical layouts can be inherent in a sustainable city by emphasizing the use of space with planned strategies by promoting the movement of people and social behaviors for enhancing an economic structure. An analysis of the space layout is beneficial for defining the urban areas that can affect street behavior. A GIS incorporated with a space syntax can help to propagate the effectiveness of a spatial analysis in a study on urban spaces. The integration of the computational pieces of both a GIS analytical tool and space syntax parameters will stimulate research oriented urban systems and spatial morphologies combined with a spatial database. However, the development of livability can be affected by a set of parameters that define the used space. Thus, this paper was aimed at examining the space syntax parameters for space visualization to evaluate street behavior using the GIS processing and space syntax methods. In this study, a spatial analysis was used to generate spatial information on traffic volume, while a space syntax was used to test the street behavior. Also, a predictive analysis was conducted to identify the correlation between traffic behavior and a set of parameters. The results showed that integration and direct visibility were significant to the traffic volume. Most of the streets that were linked to the commercial area showed high integration and direct visibility, which increased by more than half, compared with the unlinked areas. Based on the statistical analysis, both parameters recorded aprobability of less than 5%. The results showed that any space designed with a continuous, direct and clear traffic volume will lead to increased integration and direct visibility, thus influencing a natural vehicle movement.
1. Introduction
Spatial analysis is a crucial feature that distinguishes GIS from other mapping information systems. This uniqueness has led to many recent studies and applications focusing on the sophistication of analytical techniques for studying spatial patterns and processes in a variety of fields. However, the use of GIS requires the integration of cross-disciplinary expertise and modeling methods to broaden its use in the fields of environmental and urban planning. Recently, GIS analytical tools have been in demand for a broad range of applications, including urban planning studies, analysis focused on urban and regional systems, as well as in environmental and safety studies utilizing the theory of urban planning. The space syntax theory has added computational knowledge to urban systems and spatial morphological studies as it combines the use of spatial databases and approaches that are closer to urban planning. Monokrousou and Giannopoulou (Citation2016) used a space syntax analysis to interpret and predict the movement of pedestrians in public spaces in Athens. Space syntax helps to identify which urban layout can promote pedestrian movement, while at the same time, limiting the excessive use of vehicles.
A study conducted by Summers and Johnson (Citation2017) revealed that with the use of space syntax, the relationship between street configuration, movement and crime canbe identified. The results showed that streets with a higher level of integration and choice recorded at least one crime event. In contrast, connectivity was negatively associated with the occurrence of crime. This was because the index of connectivity was calculated by counting the connected segments of each street without considering those that were indirectly connected. The index ignored the positions of street segments in the more extensive networks, leaving them out of the integration and choice, instead of considering them as indirect connections of each segment. Besides, the connectivity did not represent a reasonable estimate of the general movement of people through a street segment to act as guardians against crime in the neighborhood.
A study on street configurations was also conducted by Patterson (Citation2016) for traffic modeling in urban areas. It used spatial analysis modeling procedures based on a space syntax to investigate a potential aggregate model for traffic flow on an urban scale. The study showed that modeling was useful in representing traffic networkson an urban scale. McCormack et al. (Citation2019) also agreed that more integrated streets can improve human mobility and movement, thereby leading to a sustainable city. Space syntax is used to describe human behavior and social activities, and to explain the morphogenesis of spatial patterns from a spatial configuration point of view, besides providing original opinions in terms of space. From a computational point of view, it is used to model an urban system by contemplating the free space. Boundaries exist between streets and the built environment, and create differences between open spaces and spatial obstacles. Therefore, the integration of a space syntax and GIS will stimulate research that is oriented toward analysis in relation to urban systems.
A method using an integration of space syntax and GIS is suitable for analyzing streets and pedestrian behaviors in urban systems because both are significant in identifying the use of space in urban areas. For example, in the analysis of urban structures and human behaviors, a space syntax is more effective for analyzing spatial layouts and human activity patterns in public spaces, while it can test behaviors using several appropriate measures. A street network with a good spatial layout and structure is essential for creating vitality and diversity in an urban space. In a study conducted by Lee and Seo (Citation2013), it was explained that the street network in Hankou has a multi-hierarchical structure, based on an evaluation of the space syntax, and produces a lively space. The integration of a space syntax and GIS is worth showing for the large-scale demolition of a living urban space. Selected space syntax parameters, such as integration and choice, and the road density can generate and identify the behaviors for a liveable space. Besides, the use of GIS for refining land-use databases further reinforces its ability to analyze space. A study conducted by Pappu (Citation2018) stated that the integration of a space syntax and GIS can be used to analyze the spatial structure of a street network for the purpose of considering the mobility pattern and land use. The finding indicated that the use of different measurements, such as integration and choice, revealed a unique pattern of mobility in the Indian city of Mysore, where a higher integration of streets resulted in a high volume of mobility.
A higher street integration comes with high connectivity. Therefore, most businesses are located in a commercial area because access to the entire area is facilitated by higher integrated spaces. A study conducted by Jeong and Ban (Citation2020) revealed that along street with high integration attracts people, and it is greatly linked to preserving and sustaining the economic livability between the traditional markets and new commercial areas in South Korea. They also analyzed the attributes of the space based on its accessibility through the street network of Cheongju and the markets ringing it. In addition, the use of space syntax parameters to test the characteristics of a spatial configuration can foster the vitality of traditional markets. The purpose is to identify those areas that are most vulnerable to mobility. Also, excellent visibility will influence the volume of mobility in an area as drivers will feel safer and more comfortable to use high-visibility roads (Jeong and Ban Citation2020).
Studies have shown that the integration of GIS and a space syntax operates as a useful tool for the evaluation of space based on spatial attributes. According to Lee and Seo (Citation2013), the integration of GIS and a space syntax for analyzing street networks carries ethical implications for determining the relationship between land use and street networks. Besides, they proposed that the incorporation of each method still has a high potential for the analysis of pedestrian and walking activities. According to Telega (Citation2016), the integrated method is a requisite for urban studies on street network systems. The study stressed that GIS is an essential analytical tool for analyzing the spatial locations of different street networks, while space syntax parameters are used to express behavior. The study implied that there is a need to explore new analytical techniques for modeling urban spaces by using a space syntax and GIS to design spatial configurations for studying urban structures and human behaviors.
Many urban studies are backed by a rich integration of spatial data, analysis and visualizations produced by GIS. Meanwhile, the use of a space syntax can enhance the modeling capabilities of GIS in terms of recent advances in spatial analysis through disseminations and experiments. The integration can be valuable for GIS users involved in the management and planning of urban systems. Like GIS, a space syntax helps the application by conducting analytical processing that focuses on space visualizations. Many theories can be associated to a space that leads to a change in social behavior. Thus, isovist has been invented to help access the use of space in line with the theory and application of a space syntax. Likewise, it helps to serve the unique views of the model space with the use of the urban system within GIS.
Visibility should always be considered when designing or planning a space. Some human-made designs compel the sightline to be precise; for example, sudden changes of grade on walkways can also create a blind spot that can become an entrapment area. Other than that, street designs and configurations also impact visibility. However, several of the variables employed to determine the use of the space can influence the traffic. Therefore, this paper was aimed at examining the variables of space visualization of street behaviors using the GIS processing and space syntax method. The objectives were (1) to calculate the traffic volume at selected junctions; (2) to verify the space visualization and differentiate between several variables, and (3) to develop a comparative analysis of the space syntax parameters and traffic volume.
2. Research background
2.1. Space visualization
People use roads as their daily mobility routine. This is not limited to any action and reaction, but is also essential for the generation of proximity communication among people. As such, the street is a crucial element of public space for daily living, especially in the city. This element has a significant impact on human behavior in the event of any changes to the street space – every street is connected to a junction, and this is known as connectivity. Besides, in space syntax studies, a road is described as a straight-line that connects each node as a junction. Thus, the reaction of the human movement through a street network will be affected by the street connectivity. A well-designed street network is one in which there is proper connectivity within the available space, thereby stimulating movement.
The response will encourage the use of space in an area with direct visibility because this has a high impact on the spatial behavior of a city. Besides, the visibility parameter plays a significant role in the theoretical grounding of the spatial partitioning of nuclear elements. As mentioned, convex spaces provide inter-visibility, while axial lines and movements provide long lines of sight (Al-Sayed et al. Citation2014). The elements are managed according to the spatial analysis, which is comprised of theories linked to urban planning and space.
2.2. Space syntax parameters
The use of a space syntax for interpreting the use of space based on an urban planning background is well known. As an extension, the powerful tools of a GIS add geospatial information and databases to the space visibility. In a space syntax, the spatial analysis of the built environment implies the passage from a path analysis to a graph analysis, whereby the configurational or visibility flooding can be explored through different measurements to explain different space behaviors. Visibility flooding propagates a cascade from a single point of origin in the subject plan to all the other subject points. As a result, several individual measurements that are suitable for human behavior can be derived, including connectivity, choice, integration, and visibility. These parameters are for visualizing with different grades, and they lead to various explanations on the use of space. Connectivity is the most probable spatial behavior, and it is defined as the number of nodes linked to each node in a connectivity graph. In notation form, the calculation for connectivity,is expressed by McElhinney (Citation2018) as:
where is the coordinate of the nearest radial intersection,V is the coordinate of the radial origin location, and n is the total number of radial samples.
The second parameter is the choice value, which expresses the linking line nodes, while the degree of choice represents the more natural way for immediate neighbors to move directly. In notation form, the calculation for choice () is expressed as:
where is the isovist area within which point V falls, and n is the total number of isovist samples.
As for the third parameter, integration, it is the value that indicates the degree to which a node is integrated or segregated from a whole system (global integration) or a partial system (local integration). Therefore, these parameters can be used for either local or global properties in the sense of integration or segregation. Each space is said to produce a high integration value if it is highly accessible. In notation form, the calculation for the integration parameter, is formulated as:
where k is the total number of units of the subject area, as defined by the user’s scale of settings.
The final parameter is the visibility, which expresses how often any given subject point is seen from a defined sample region. The visibility parameter is correlated to the connectivity when the viewed space precisely matches the sample region, but it significantly varies once the sample region is restricted. The result is then derived and divided by the isovist value to generate a mean value. The calculation for the visibility, is:
where is either 0 or 1, depending on where the point V falls, and n is the total number of isovist samples.
3. Research methodology
It is vital to access the visualization of the enclosed space of the street based on a systematic process and approach to ensure the quality of the data. This study utilized a combination of a two- and three-dimensional layout design analysis based on relevant individual space syntax parameters. The integration of a GIS database and space syntax for the visibility of the space in the housing layout created an additional level of accuracy for direct visibility. Meanwhile, the space syntax parameters helped to explore the utilization of the space for the behavioral study. Traffic volume, as a movement behavior, was secured through manual counting, and was applied to correlate with the topological space.
3.1. Observation of traffic volume and movement
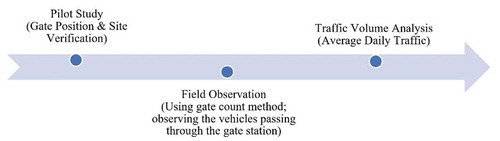
The efficient management of the data collection process is necessary when conducting quantitative studies because it affects the validity of the secured data. Therefore, a pilot study was conducted to obtain the primary data by means of a vehicle movement counting activity, as shown in . The pilot survey was carried out in early 2019, and it involved a gate count station, features verification, and accessible routes and junctions. The purpose was to determine the average volume of traffic in a specific period. The results were then matched with a spatial configuration to determine the relationship between the variables.
Figure 1. Traffic volume assessment process.
3.1.1. Data collection
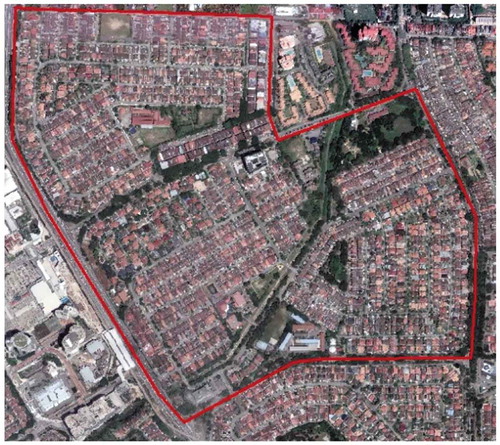
The data collection was performed in a neighborhood located within the municipality of Segambut, Kuala Lumpur (). The variety of street designs and land uses affected the movement of vehicles within a total area of 160 hectares. However, the study only focused on an area with an upper middle-class background. A total of 27 reasonable gate positions were chosen to cover all the junctions (residential and commercial areas) in the neighborhood.
Figure 2. Neighborhood with an upper middle-class background.
3.1.2. Field observations
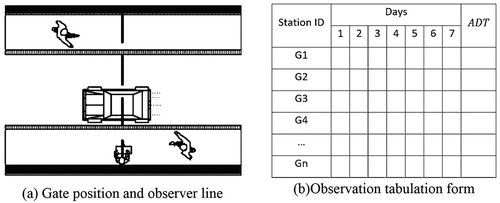
The data collection for traffic volume was conducted using the gate count method. As shown in , a reasonable “gate” position was chosen. Due to time constraints and the lack of observers, the observations were carried out every 15 minutes for each one-hour interval session from 8:00 a.m. to 7:00 p.m. over a short duration of only 7 days. The vehicles crossing each observer line were counted and recorded precisely. The data were recorded and tabulated to obtain the average volume of daily traffic.
Figure 3. Example of observer line and observation tabulation form (Al-Sayed et al. Citation2014). (a) Gate position and observer line. (b)Observation tabulation form.
3.1.3. Average daily traffic
Average Daily Traffic (ADT) is the most basic unit used for forecasting traffic volume per day. It provides an aggregate measurement of traffic volume based on the total number of daily observations. The traffic volume is calculated based on the number of vehicles traveling through a specific point of a road over a short duration of time. It is estimated by dividing the total daily volume during the specified time with the number of days in the period. Since only the average volume of traffic was essentially involved in this study, no specific vehicle classes were measured. The total cumulative volume at the temporary station was based on all types of vehicles passing through the gate. The temporary traffic counting station measured the traffic volume based on the ADT formula:
where is the daily volume on the ith day, and n is the number of whole days.
3.2. Spatial analysis and layout modeling
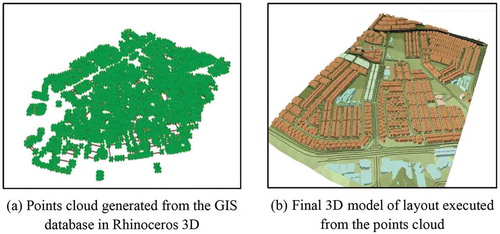
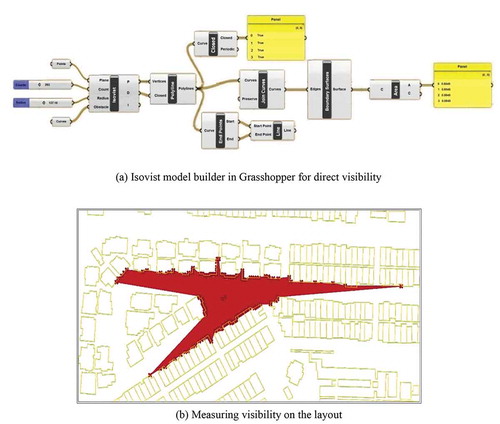
A spatial analysis was performed to determine the volume of vehicle movement using the Line Density Estimation (LDE) method in GIS. This method calculates the magnitude-per-unit area from the poly line features that fall within a radius around each cell (ESRI Citation2017). The dataset on traffic volume was analyzed in sub-categories from the highest to lowest traffic volume per street level. This study employed different two and three-dimensional modeling for the space and visibility evaluations. The two-dimensional modeling was tested using space syntax parameters, including integration, connectivity and control using the DepthmapX software (DepthmapX development team Citation2017). Meanwhile, the three-dimensional modeling, as shown in , was tested with the isovist method for direct visibility using Rhinoceros 3D, a powerful and versatile 3D modeling software that includes the Grasshopper plug-in for algorithmic modeling(Rhinoceros 3D development team Citation2018).
Figure 4. Process of generating 3D modeling using GIS and Rhinoceros 3D. (a) #Points cloud generated from the GIS database in Rhinoceros 3D. (b) #Final 3D#model of layout executed from the points cloud.
Rhinoceros 3D was adopted to develop and simulate direct visibility based on human vision capabilities. The degree of visibility from point to point was identified using the isovist in the Grasshopper model builder, as shown in . The setup for the Grasshopper model builder is based on the suitability of human vision such as the earlier theory of environmental planning (Spreiregen Citation1965). Byun and Ha (Citation2016) noted that the vision of the human eye is limited to a distance of 4000 feet, while the maximum length for seeing body gestures is up to 450 feet. Therefore, the isovist radius was set to both ranges to obtain multiple visual readings. To complete the analysis, the flooding visibility and traffic volume dataset were visually interpreted and correlated with each other to illustrate how the layout affected human behavior.
Figure 5. Measuring direct visibility using isovist model builder in Grasshopper. (a) Isovist model builder in Grasshopper for direct visibility. (b) Measuring visibility on the layout.
3.3. Predictive analysis of traffic volume and neighborhood space
A predictive analysis was conducted in this study to analyze the relationship between traffic volume and the space syntax parameters. According to Xia et al. (Citation2019), the accuracy of the data can be increased by correlating the multiple variables. Due to the variability of the model and how it affects the relationship between the data, this study exploited the multivariate regression method to understand the behavior of the space toward the configuration of the layout in the neighborhood. The data were analyzed and interpreted using a statistical correlation.
4. Results and analysis
4.1. Evaluation of traffic volume and space analysis
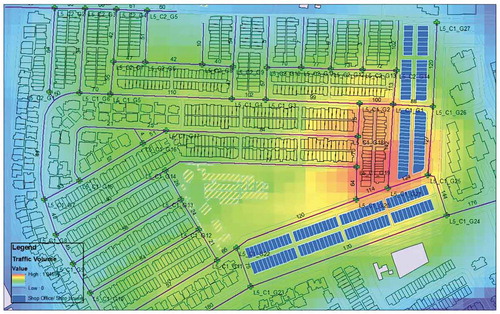
A total of 27 observation “gates” were pre-posed in the surrounding study area for the purpose of observing the traffic volume, as shown in . As a result, the commercial areas recorded a higher number of vehicles in contrast to the residential areas. Also, the units that were located away from or were not connected to the commercial areas had a lower traffic volume. Theoretically, each vehicle movement would be accompanied by a routine activity. The higher movement of vehicles to the commercial areas was probably for regular events. Most of the observation gates in the commercial spaces such as G1, G21, and G23–G27 recorded total volumes of over 100 vehicles compared to the roads that were away from the business areas. Meanwhile, the lowest traffic volume was recorded by G16 (station at dead-end area) with an average of 12 vehicles per day. A total of 79 vehicles were listed for the station for the entire observation period.
Figure 6. Areas with higher concentration of traffic.
To determine whether there was a significant relationship between space and street volume, one of the two neighborhoods was analyzed. The results of the study showed that the degree of integration (InHH-DoV) and 2D-direct visibility (DvA-2D)# has a significant relationship with the volume of traffic (VoT). The increase in traffic volume, as seen from the findings, was analyzed based on the space syntax parameters ( and ). It was shown that the higher integration value for a specific space imposed a higher traffic volume. Besides, for direct visibility, the open and continuous space,which was traversed by inherently multiple axial lines (high visualization), recorded a higher average daily traffic volume. However, some areas that illustrated other parameters, such as choice and connectivity, also showed a high affinity but were not globally set. shows the space visualization based on a specific parameter for the residential areas. The traffic volume was determined based on the number of observation stations, which were labeled using the Stn-ID for easier clarification.
Table 1. Degree of visibility of each parameter for residential land use.
Table 2. Degree of visibility of each parameter for commercial land use.
Several parameter values were calculated based on the layout configuration, namely choice (Ch-DoV), connectivity (Cn-Dov), integration (InHH-Dov), 2D-direct visibility (DvA-2D), and 3D-direct visibility (DvA-3D). Each parameter was classified into three sub-groups comprised of high, medium, and low. Each group was then classified based on the average number of space parameters. In addition, the axial value was calculated based on the axial lines that traversed each space in the layout; while, the degree of visibility parameter was the adjusted axial value, with an emphasis on the traffic volume. As a result, only three stations, G2–G4, recorded a high degree of visibility for each of the parameters. These stations were located in those commercial areas that had a direct and continuous street design. The obvious values were highlighted at station G2, which showed visibility values of Ch = 11.83, Cn = 12.74, InHH = 1.33, DvA-2D = 4.67, and DvA-3D = 6.57. Other than that, Stations G3 and G4, which were linked and located beside G2 (), also had constant and high visibility values.
G10–G13 were the only stations that had a street with a dead-end design. As a result, these stations generated low values for choice, which were recorded as < 3.00. The model brought about an unnatural way and space for the immediate neighbors to move. In the meantime, the average traffic volume, VoTavg = 40, indicated the number of vehicles for the entire observation session. It proved that these areas, which were not connected to the other areas, produced a low rate of movement. The connectivity for these areas also showed that the space covered a minimum of natural movement when the connectivity showed a total value of < 3.00, with an average value of Cnavg = 1.70. Overall, the neighborhood offered an integrated space with a recorded degree of InHH from 0.4 to 0.8, while there was some turnover for high values of InHH > 0.8. Also, varying degrees of direct visibility were shown in several areas around the neighborhood. As explained before, this parameter expresses how often any subject point is viewed from a defined space to obtain a so-called clearer view. This value can vary once the sample region or space configuration is restricted, for example, the distance, area, or the condition of the space for it to be accessible. Based on , stations G12, G13, G15, #and G16 showed lower values of direct visibility in both 2D and 3D, namely, DvA-2D = 1.3 and DvA-3D = 1.7, which placed them in a lower category. It was observed that these stations were on streets that had a low connectivity, small and curved street pattern, and a short-distance space. In addition, station G16 posted the lowest visibilities of DvA-2D = 0.33 and DvA-3D = 0.42. It also reported lower values for choice, connectivity, integration and traffic volume of Ch = 0.12, Cn = 0.48, InHH = 0.12, and VoT = 12, respectively.
It was noted that the degree of visibility was inconsistent with different land uses. shows the visibility for commercial land in the same neighborhood. Most of the stations showed high values for the parameters, while the only station that recorded a medium rate of choice was G20, with a value of Ch = 4.95. The average choice value recorded for this land use was Chavg = 17.71, which was higher compared to average choice valuein the residential area, with Chavg = 2.86. Although the street covered by station G20 had high connectivity and integration, the results showed that it was moderately used as a natural way of movement. Also, station G24 recorded the highest values for the parameters among the stations.
4.2. Interpretation of spatial visualization
The findings showed that the spatial visualization of integration, connectivity, choice, and direct visibility provided a unique interpretation of each space within a similar layout. It was able to determine, in a continuous open space, an ample area that was covered by many connections, and displayed all potential movements. The interpretation, which was based on the multiple concentration values of the axial lines that passed through the convex area, gave high values for integration and choice. It represented the more natural way for the immediate neighbors to move directly, and the integrated layout. Likewise, the connectivity showed a high value, but was more focused on the number of street connections throughout the continuous open space. Therefore, terraced housing areas with a grid layout pattern will always generate a higher connectivity value. The reason is that each line must at least be connected to another to provide a progressive value, where a top junction will promote a high connectivity value.
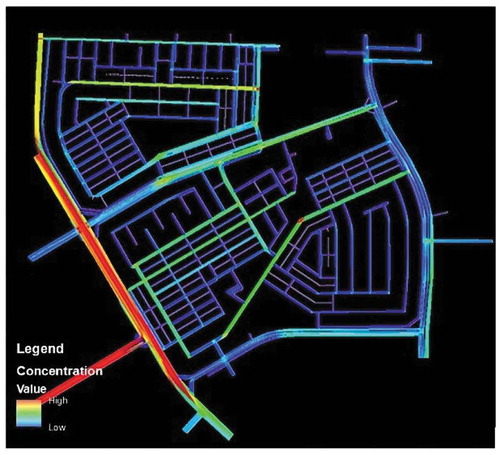
As illustrated in and , the major road dividing the two neighborhoods showed high integration and connectivity. It was also predicted to have the highest value for choice, which was the best way for the user and connected the two neighborhoods (). The areas with more straight forward and continuous open spaces produced higher values for each parameter. Besides, the street that was connected to the major road and commercial areas denoted a high concentration value of integration and connectivity. Also, the space with more depth from the primary access in contrast promoted low mobility. In terms of direct visibility, illustrates some regions that recorded a higher degree of visibility, specifically on the major roads, while narrow spaces, such as back lanes, showed lower values – the space configurations linked to the traffic volume in the area. Generally, movement takes place in a way that is easier to access and is more secure. Besides, clear visibility of space also favors any form of business that encourages a higher social mobility.
Direct visibility was carried out in 2D (), concentrating on street space, and in 3D, which was closer to human vision using the theory of Spreiregen (Citation1965). Measuring direct visibility in 2D and 3D produces a distinct set of degree values, where the 3D visibility includes the elevation. However, a comparison of visibility to traffic volume is a key to discovering how closely related they are. In this study, both the analysis showed the unique value of visibility. It was settled in the statistical analysis, where the 3D visibility analysis gave a higher value than the 2D visibility analysis for traffic volume. The 3D visibility provided a significant value in reference to the traffic volume for all the observation stations. The commercial land in this neighborhood featured a layout design with high integration into the entire system, and increased the natural movement. This was also illustrated by the high volume of traffic recorded. In contrast, based on the layout design, the commercial area was designed with a direct and clear continuous space, and promoted a natural movement compared to the space in the residential land.
Figure 7. Concentration simulation of integration.
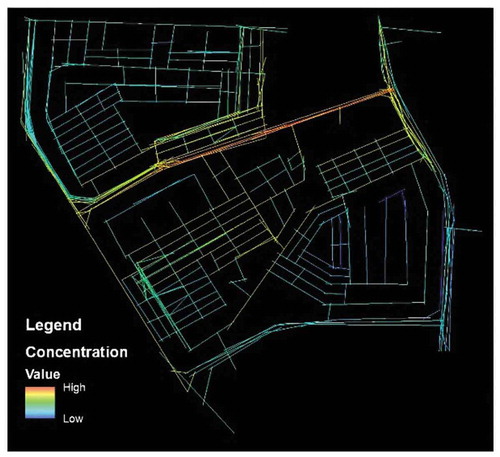
Figure 8. Concentration simulation of connectivity.
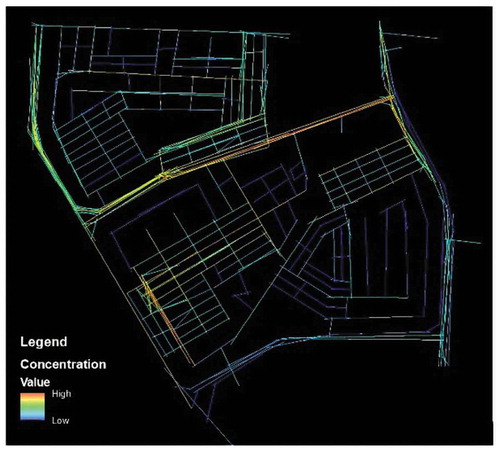
Figure 9. Concentration simulation of choice.
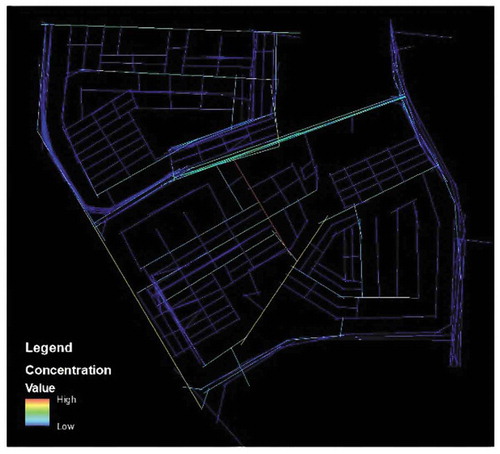
Figure 10. Concentration simulation of direct visibility.
4.3. Multiple regression analysis
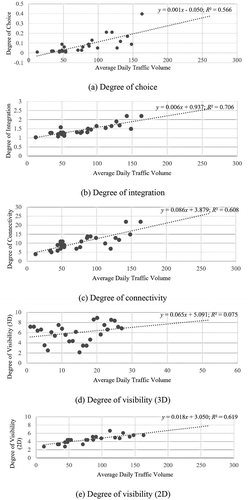
Multiple regressions were conducted to determine the relationship between the space parameters and the average daily traffic volume (). A dependent variable was analyzed against the independent variables, such as integration, choice, connectivity, and direct visibility. As a result, the integration and direct visibility (2D) revealed a significant relationship to the movement frequencies, with both showing a shred of reliable evidence against the null hypothesis with a probability of less than 5% (p-value < 0.05). The integration parameter recorded was 0.02 < 0.05, and the direct visibility was 0.01 < 0.05, thereby hinting that the test hypothesis should be rejected. In addition, the parameters of choice, connectivity, and direct visibility (3D) exceeded the significant p-value. Both the significant dependent variables were then analyzed to determine how well the model explained the data. Using the R-square statistical value, as shown in , the integration and 2D visibility showed that the model explained over 60% of the variability. Besides, the connectivity and choice suggested an excellent explanation by the model, with R2 = 0.61 and R2 = 0.57, respectively, but both recorded less than 5% for the significant p-value. However, the multiple regression analysis showed that the dependent variable was explained well in the statistical analysis, with a p-value = 0.003 and R2 = 0.84.
Figure 11. Multiple regression analysis between space parameters and average daily traffic volume. (a) Degree of choice. (b) Degree of integration. (c) Degree of connectivity. (d) Degree of visibility (3D). (e) Degree of visibility (2D).
5. Research discussion
The use of integration was closely linked to the connectivity of the layout and the street design. Usually, a higher integration of the street will develop good connectivity, where the street will be linked to the whole neighborhood system. A higher linking of the street will develop multiple choices for street users to move safely. In this study, integration was believed to have increased the traffic volume. Most of the streets that recorded a high integration had promoted mobility, especially in the commercial area. This reinforced the finding of Pappu (Citation2018) that integration of a street rises with an increase in the volume of mobility. The study also found that streets with a long design and direction have a high integration and traffic volume, the reason being that long streets provide greater accessibility and act as connections between two spaces. Street design is important to create a successful community and public space that enable a mixture of activities to attract more people. In this study, the commercial area created a high traffic volume daily. The main reason was because the street was designed with high integration and recorded good visibility compared to others. According to Davies (Citation2000), streets in commercial areas should be designed to enable users to get to the shops and cross the roads, and with good visualization to promote businesses. Promoting street connectivity for easy access can improve human mobility and movement, thereby, leading to a sustainable city.
Street configurations are modeled using a space syntax to explain the morphogenesis of the spatial pattern from a spatial configuration point of view besides providing original opinions in terms of space. According to Patterson (Citation2016), a potential aggregate model of traffic flow on an urban scale can be developed using multiple space syntax parameters. The parameters are stipulated based on spatial modeling for the purpose of traffic flow. McCormack et al. (Citation2019) suggested that integration can develop more social activities when a space is served with better connectivity and accessibility. Besides, when immediate neighbors move directly in a natural way, they will develop the same pattern of movement behavior. According to Li et al. (Citation2015), the livability of a space can be developed from the choice. A more natural choice of space was able to influence the road density of Hankou. However, it contradicted the finding of this study, where the natural way did not significantly influence the average traffic volume. The natural way in a space syntax was analyzed using the choice parameter, and it was shown that in several parts of the space a highly natural traffic movement was promoted. Usually, a higher degree of choice can be identified at the main street, with direct connections to other parts of the neighborhood.
Choice and integration provide high accessibility in different ways. According to Jeong and Ban (Citation2020), integration with a highly accessible layout will provide better visibility to manage the increased traffic in an area. This is because users often feel more comfortable and safer in using the road than when there is low visibility. The use of space remains a critical issue in the maximization of visibility for a city street and neighborhood area. It is a crucial design process that is rapidly developing nowadays, especially in urban areas where human vision can deteriorate. Physical features and the environment such as contours, vegetation, and the height and shape of buildings are among the contributing factors. This recommendation was supported by Schroeder and Saboya (Citation2015), who felt that changes to the height of the environment or to the surface topography will allow researchers to study urban spaces more accurately in the future.
In this study, a higher visibility was recorded mostly with a direct street design that had a high integration value. Two methods were implemented for analyzing the visibility level based on a study review. The first method was an analysis in 2D, which is frequently applied in many space syntax studies. The second method involved analyzing using GIS by capturing the elevation of features, since the space syntax is limited to 2D model analysis only. It is good to observe the effects of elevation on the visibility level of any space. Based on the findings, the capturing of direct visibility in 2D rather than in 3D logically had a greater effect on the average traffic volume, as it was most probably suited to human vision. This explains why people prefer to use streets with high visibility according to the viewed distance without considering the factor of elevation. Long streets with direct accessibility will increase visibility and have the opportunity to attract mobility.
The integration of GIS and a space syntax as an analytical tool for analyzing street networks carries ethical implications for determining the relationship between the street network and traffic volume. Nevertheless, the incorporation of each method still has a high potential for analyzing the use of space involving traffic behavior. Many studies have suggested the incorporation of a space syntax and GIS to analyze the spatial location of different street networks, and the use of space syntax parameters to express the behavior (Telega Citation2016). Specifically, in this study, the GIS ensured that the traffic volume was mapped for a clear interpretation using spatial analysis. Besides, the GIS also helped to record the spatial features of the attribute databases, especially for roads and buildings for the 3D visualization process. Meanwhile, the space syntax was used the most to analyze street configurations to show how they influence traffic volume. The integration of GIS and a space syntax for analyzing street networks carries ethical implications for demonstrating the relationship between land use and street networks. The efficiency of both methods as analytical tools in experiments has been proven in the measurement of traffic volume, making them suitable, therefore, for urban studies.
6. Conclusions
In conclusion, an integrated GIS and space syntax is a suitable tool for the analysis of space. In this study, GIS was used for the analysis of space regarding a database on traffic volume arising from a traffic count conducted on-site. Besides, it also helpedin the development of a 3D model for a visibility analysis based on the perspective of human vision. The space syntax was applied to describe the space of the housing layout based on an urban planning background. Space affects the behavior of a city and the neighborhood. The relationship between the space syntax parameters, visibility and traffic volume was investigated in this study to analyze how space adds to changes in the traffic volume. The results of the regression analysis showed that integration and direct visibility are significantly related to traffic volume. Permeable layouts, with good connections and depth, will provide a propensity for vehicle movements onroads. It was also observed that the different land uses also affected the traffic volume.
The visibility of a space also needs to be recovered using 2D analysis by capturing the elevation for better accuracy. This is because of the inconsistency between the interpretations of both 3D and 2D visualizations. The difference in the visibility values determined by 3D visualization and by using GIS projections based on human vision was significant in terms of traffic volume, without the exception of the elevation feature. Thus, the use of GIS was more proper compared to the 2D visibility in the space syntax method. Besides, the 3D visibility proved to be a valuable measurement of traffic volume in a continuous street space. It is recommended that urbanism can be sustainable if the livability of a space is identified using an integrated space syntax and GIS method. The integration of these analytical tools is useful for measuring and predicting how space is being used and helps to explore the livability of the space for sustainable development, and to see how different methods interpret the visualization of space.
Acknowledgments
The authors would like to thank Universiti Teknologi MARA (UiTM) for its support and partial funding of the study through the FRGS Grant (600-IRMI/FRGS/3(205/2019)). The authors would also like to thank all the staff members of the Surveying Science and Geomatics Department for the post-processing equipment support, and the individuals who were involved in and contributed to this study.
Additional information
Funding
Notes on contributors
Fazzami Othman
Fazzami Othman is a recent PhD student from the Surveying Science and Geomatics Department at Universiti Teknologi MARA (Uitm) Shah Alam, Malaysia. He holds a Master’s of Science in Built Environment from the same institution. His current research interests are the use of geospatial science tools and urban space methods for visualizing, monitoring and management, with an emphasis on social and criminal behavior.
Zaharah M. Yusoff
Zaharah M. Yusoff is a senior lecturer at Universiti Teknologi MARA (UiTM) Shah Alam, Malaysia. Currently, she is the coordinator of a research programme handling PhD and MSc students of Built Environment studies. Her educational background lies around town and regional planning, land development and administration and affordability studies concerning transportation and mobility. Empirically, her research work focuses on contexts ranging from physical and economic studies exploring spatial GIS techniques as analytical tools, other than qualitative and quantitative methods.
Siti Aekbal Salleh
Siti Aekbal Salleh is an Associate Professor at the Centre of Studies for Surveying Science and Geomatics. She has been an active researcher in the fields of GIS, remote sensing modeling and numerical simulation applications in urban studies. Her research interests lie in the field of geo-informatics technology, particularly in applied remote sensing and GIS. She is also very keen in exploring the areas of change assessments, the impacts of land surface processes, and their biophysical responses toward global, regional, and local climate conditions, including climate-terrestrial ecosystem interactions.
References
- Al-Sayed, K., A. Turner, B. Lida, and A. Penn. 2014. Space Syntax Methodology. London, UK: Barlett School of Architecture, UCL.
- Byun, G., and M. Ha. 2016. “Factors of a Surveillance Environment that Affect Burglaries in Commercial Districts.” Journal of Asian Architecture and Building Engineering 15 (1): 73–80. doi:10.3130/jaabe.15.73.
- Davies, L. 2000. Urban Design Compendium. London: English Partnership UK.
- DepthmapX development team. 2017. “Depthmapx (Version 0.55b).” http://github.com/SpaceGroupUCL/depthmapX/
- ESRI. 2017, January 14. ArcGIS Desktop: Release 10. Redlands, CA: Environmental Systems Research Institute, United States of America.
- Jeong, S. K., and Y. U. Ban. 2020. “Spatial Configuration for the Revitalisation of a Traditional Market: The Case of Yukgeori Market in Cheongju, South Korea.” Journal of Sustainability 12 (7): 1–17.
- Lee, S., and K. W. Seo. 2013. “Combining Space Syntax with GIS-Based Built Environment Measure in Pedestrian Walking Activity.” In 9th International Space Syntax Symposium, SSS 2013 (pp. 1–14). Seoul, Korea: Sejong University Press.
- Li, X., Z. Zheng, C. Zhong, I. H. Hijazi, and S. Cheng. 2015. Assessment of Lively Street Network Based on the Geographic Information System and Space Syntax. New York: Springer.
- McCormack, G. R., M. J. Koohsari, L. Turley, T. Nakaya, A. Shibata, K. Ishii, and K. Oka. 2019. “Evidence for Urban Design and Public Health Policy and Practice: Space Syntax Metrics and Neighbourhood Walking.” Journal of Health and Place 102277. doi:10.1016/j.healthplace.2019.102277.
- McElhinney, S. 2018. “Isovist_2.1: A Basic User Guide, V1.4.” http://www.isovists.org/user_guide/
- Monokrousou, K., and M. Giannopoulou. 2016. “Interpreting and Predicting Pedestrian Movement in Public Space through Space Syntax Analysis.” Procedia - Social and Behavioural Science 223: 509–514. doi:10.1016/j.sbspro.2016.05.312.
- Pappu, H. 2018. “Analysing the Spatial Structure of the Street Network to Understand the Mobility Pattern and Land Use - A Case of an Indian City, Mysore.” Journal of Land Use, Mobility and Environment 11 (2): 231–246.
- Patterson, J. L. 2016. “Traffic Modelling in Cities - Validation of Space Syntax at an Urban Scale.” Indoor Built Environment 25 (7): 1163–1178. doi:10.1177/1420326X16657675.
- Rhinoceros 3D development team. 2018. “Rhino3d: Rhino, Version 6.” Accessed 10 February 2020. http://www.rhino3d.com/
- Schroeder, T., and R. T. Saboya. 2015. “Configurational Characteristics of Sociospatial Segregation in Brazilian Cities.” In K. Sailer, T. Bolton, L. Vaughan, K. Karimi and G. Palaiologou (Eds.), Proceedings of the 10th International Space Syntax Symposium (pp. 1–14). Space Syntax Laboratory, The Bartlett School of Architecture, University College London.
- Spreiregen, P. D. 1965. Urban Design: The Architecture of Towns and Cities. USA: Mcgraw-Hill.
- Summers, L., and S. D. Johnson. 2017. “Does the Configuration of the Street Network Influence Where Outdoor Serious Violence Takes Place? Using Space Syntax to Test Crime Pattern Theory.” Journal of Quantitative Criminology 33 (2): 397–420. doi:10.1007/s10940-016-9306-9.
- Telega, A. 2016. “Urban Street Network Analysis Using Space Syntax in GIS - Cracow Case Study”. Proceeding of Baltic Geodetic Congress (BGC Geomatics) (pp. 282–287), Gdansk, Poland, 2–4 June 2016.
- Xia, C., A. Zhang, H. Wang, and A. G. Yeah. 2019. “Predicting the Expansion of Urban Boundary Using Space Syntax and Multivariate Regression Model.” Journal of Habitat International 86: 126–134. doi:10.1016/j.habitatint.2019.03.001.