
ABSTRACT
We live in an era of rapid urbanization as many cities are experiencing an unprecedented rate of population growth and congestion. Public transport is playing an increasingly important role in urban mobility with a need to move people and goods efficiently around the city. With such pressures on existing public transportation systems, this paper investigates the opportunities to use social media to more effectively engage with citizens and customers using such services. This research forms a case study of the use of passively collected forms of big data in cities – focusing on Sydney, Australia. Firstly, it examines social media data (Tweets) related to public transport performance. Secondly, it joins this to longitudinal big data – delay information continuously broadcast by the network over a year, thus forming hundreds of millions of data artifacts. Topics, tones, and sentiment are modeled using machine learning and Natural Language Processing (NLP) techniques. These resulting data, and models, are compared to opinions derived from a citizen survey among users. The validity of such data and models versus the intentions of users, in the context of systems that monitor and improve transport performance, are discussed. As such, key recommendations for developing Smart Cities were formed in an applied research context based on these data and techniques.
1. Introduction
With the advent of social media, individuals can express their opinions on a subject instantaneously and, on many social networks, in a highly public manner. When such data are continuously collected, general public perceptions on topics are traceable as they fluctuate in response to news events, disruptions, or thoughts and experiences in the digital and physical world around them. In the field of urban planning, this has tangible potential benefits as a form of passive participation, whereby those who design and provide services for the city can have an increased pool of information that could support decision-making.
In urban public transportation, network customers are increasingly using their digital voice to communicate both positive comments and concerns about conditions of service – such as timeliness, safety, crowdedness, cost of travel and comfort. Further, they are using this voice to communicate their sentiment toward specific news events such as union strikes, making high-level political commentary and responding to announcements of future infrastructure services. The promise of the Smart City is that these digital traces can be identified, captured, categorized, collated, and visualized to underpin evidence toward informed policy development, enacting new modes of governance and empowering those citizens who choose to volunteer this information.
Thus, it is seen that the potential that social media data holds for the transport sector is that, if effectively harvested, these data can potentially enhance, complement, or even replace existing data collection and participation techniques. However, although this data is freely available – the process of computing high volumes of short, unstructured messages into tangible metrics for planners and decision-makers comes at a cost, both in terms of financing, ownership, and resources, as well as posing significant challenges, given the nature of language as well as in the ways that people interact online.
Given the potential of this medium, there have been, to date, limited examples of how government transportation agencies realistically exploit these new forms of data. Further, studies on citizen motivations for using these platforms, their preferences, awareness, and their expectations in this context on how their data traces are used, is limited. This research thus forms a case study that examines social media data, passively collected transport performance big data, and survey data together. This contributes to a holistic evaluation of the current opportunities and challenges of this medium in the context of big data to inform operational transport planning in the city of Sydney, Australia.
The objective of this work is specifically to analyze the use of Twitter as a tool capable of measuring historic and real-time feedback and satisfaction among public transport users in Sydney. A Mixed Methods approach combining qualitative and quantitative survey questions with data mining and machine learning/natural language processing techniques achieves this objective in relation to five Research Questions (RQs) formulated as:
RQ1–To what extent is Twitter used as a platform for expressing dissatisfaction with the transport network in Sydney?
RQ2–What are the most prominent topics and issues generally talked about on Twitter in regard to transport and can these be grouped computationally?
RQ3–Is there a relationship between transport-related Tweets and actual transport performance derived from big data?
RQ4–What inherent bias is there is measuring satisfaction levels of Sydney transport users through this medium?
RQ5–To what extent are users satisfied with traditional feedback channels, and is mining Tweets an appropriate channel?
Key recommendations focus on how such data can be used, analyzed, and combined to represent citizen feedback concerning the public transport system, accurately. Further, a discussion considers the readiness of such technologies for uptake in real-world urban transport planning contexts.
2. Related work
Understanding the properties and characteristics of urban things to gain operational insight through big data feeds is a key objective and motivation behind the Smart City. Big data represents a profound transformation in the relative volume, variety, and accessibility of information available to governments, organizations, and the public at large. Social media content, such as geolocated Tweets or those referring to geographic phenomena, such as transport, is a form of Volunteered Geographic Information (VGI). VGI has appeared in geographic literature for over a decade now, with Goodchild (Citation2007) arguing that such forms of contributed data can broaden the number and type of people playing a role in the design of cities; empowering citizens as “sensors” augments existing government datasets to provide more information for more collaborative decision-making.
VGI forms an attractive form of passive civic participation in this regard for cities, for corporations and for more busy citizens – in a world where active forms of participation such as public hearings and citizen panels, seem less relevant given the ubiquity of information communication technologies. Tenney and Sieber (Citation2016) discuss some of the broader contractions of this – and their research suggests VGI holds abundant opportunities to enable public participation, however for these to be adopted with restraint until more transparent forms of underpinning algorithmic processes for such information are more widely available. In a similar vein, Kitchin, Lauriault, and Gavin (Citation2015) review indicators, urban benchmarking, and urban dashboard initiatives. They highlight that these are not simple data assemblages, but rather ”complex, politically-infused, socio-technical systems that, rather than reflecting cities, actively frame and produce them” (ibid., Citation2015, 1).
A significant body of literature on Twitter use by citizens to assist in government services falls under the category of real-time disaster information for emergency management (Panagiotopoulos et al. Citation2016). This might be a form of co-production – where citizens volunteer information, amplify a civic service, to provide a civic good. Real-time information system process data and allow continuous sentiment analysis, which can also be used to detect incidents (Tasoulis et al. Citation2018).
Beyond detection of disasters – traffic events, congestion, and accidents are also highly popular research applications of social media data in the transport field – see for examples (Gong and Sinnott Citation2015; Gu, Qian, and Chen Citation2016; Salas et al. Citation2017; Tejaswin, Kumar, and Gupta Citation2015; D. Wang et al. Citation2014). Increasingly researchers are applying more sophisticated machine learning techniques (Zhang et al. Citation2018).
Numerous studies employ sentiment analysis techniques on social media data. Social media content has allowed monitoring of the well-being of individuals, as well as of entire communities (Quercia et al. Citation2012). Beyond detecting events, work such as the “geography of happiness” allows measurements that give insights into types of content posted and their relationship between high-level population-scale demographic metrics (Mitchell et al. Citation2013). Limited studies, however, link such well-being derived through social media with sensor data from infrastructure assets – for example, how do deficiencies in transport provision relate to decreased social media well-being?
Schweitzer (Citation2014) studied how stigma is generated through social media (Twitter) on public transport. The authors discuss the role planners may have in maintaining a civil dialogue by deeper engagement with citizens on these platforms. The importance of using Twitter as an additional source of transport-related information is discussed by Kuflik et al. (Citation2017). These authors identify several challenges with the use of data mining techniques such as those in natural language processing. The authors note that improving data mining techniques for Twitter data has implications to public participation and is strong field for further work. Studies such as that by Collins, Hasan, and Ukkusuri (Citation2013) acknowledge that performance metrics generally represent interests of business without focusing on the customer and that an increasing body of work should reflect performance indicators that include end users.
Sentiment analysis, specifically applied to transport, has been employed by Saragih and Girsang (Citation2018) using Facebook and Twitter to more accurately understand opinions on transport. The authors note that while this kind of opinion mining is popular in business, it is less popular in government organizations, such as transport authorities in Indonesia. Bruno et al. (Citation2019) use data mining techniques to understand the tourism industry and travel behavior in Bamako, Mali. Mendez et al. (Citation2019) engaged in both sentiment analysis and topic modeling in order to capture bus user experiences on the network in Santiago, Chile. The authors found these techniques effective for representing the opinions of bus commuters in this context.
As the volume of social media data increases – so does the volume of data generated by the transportation network. The volume and distribution of transport data are growing due to the widespread deployment of sensors in vehicles, mobile phones, and other devices. Limited work to date has looked at directly comparing these datasets, which is an important omission to consider, as they are generated simultaneously. In a recent review of the use of big data in public transportation, Welch and Widita (Citation2019) suggest that public transport research could indeed benefit from further pairing of transport big data sources (such as GPS, smart cards) with social media data to infer customer satisfaction and confirm assumptions about demographics and travel behavior. As such, this work aims to make a valuable contribution in terms of validating (or invalidating) assumptions of patterns within social media data using modern openly available computational techniques.
3. Method
The following section describes the data collection and analysis methods used to address the five proposed research questions. The data sources and models used in this study are open-source and represent what is freely available to governments, researchers, and citizen scientists. illustrates this workflow.
Figure 1. Pipeline for collecting and processing data for this study
3.1. Data collection
3.1.1. Tweets
A Tweet is a message displayed on a user’s profile page on the social media platform Twitter, which is publicly visible by default, and shared with all his or her “followers”. Tweets are, at the time of writing, limited to 280 characters and may include URLs, tags (where another user is specified with the “@” symbol, implying a form of dialogue with that user), and hashtags (where a particular topic is denoted and traceable through the “#” symbol).
In order to obtain a sample of Sydney transport-related content on the platform, Tweets were collected continuously for over a year using the Twitter Search API to form a longitudinal sample from January 2018 to April 2019. This is a freely available service, which has limitations when not continuously collected. For example, these are only available in 7-day time windows, potentially reducing the number of results shown. These limitations are ameliorated by using very specific search terms, separating queries, and querying continuously over time to create comprehensive data samples.
A manual review of keywords used by Sydney transport users and commentators on the network prior to collection, indicated a number of official accounts run by the State government transport body, Transport for NSW (hereafter, TfNSW). These are regularly used to communicate with and between the public in Sydney (such as @TrainsInfo, @T1SydneyTrains, @BusesInnerWest), as well as a set of regular hashtags used less formally (#sydneytrains, #sydneybuses, #nswtransport, #sydneytransport & #transportfornsw). This review led to creation of 26 key search terms to identify Tweets related to expressing an opinion about transport in Sydney as outlined in Appendix A.
It was also found, early on and notably, that geolocated Tweets related to public transport (i.e. using these tags and hashtags) were an extremely small (<1%) sample of Tweets and thus geographic coordinates did not form a component of this study. Approximately 55,000 unique Tweets were used as the sample for this study; representing the activity of approximately 13,200 unique usernames; 34,000 additional Tweets were collected in the form retweets, which were not used. While the study did not use geographic coordinates, this information still contains a rich source of geographic information – such as placenames, which describe train stations, bus stops and event locations, and service names, which describe individual routes and lines and denote specific geographic areas.
3.1.2. Transport performance
High-volume data feeds related to transport performance were processed to ascertain the relationship between peak Twitter activity and public transportation disruptions. The General Transit Feed Specification – Real-Time (hereafter, GTFS-RT) was collected from the TfNSW API that provides this feed as open to the public. This is accessible through the TfNSW Open Data Hub and Developer Portal (TfNSW Citation2019). The GTFS-RT is an extension of the GTFS, which contains static timetable information, and also includes real-time fleet updates to application developers. This real-time fleet information was collected for a period of 12 months from April 2018 to April 2019 from a combination of two TfNSW API services – the “Vehicle Positions API” and the “Public Transport – Real-time Alerts API”.
The data from both APIs were joined based on their trip identifiers and matching timestamp information. This provides a comprehensive inventory of where services are located at a regular interval and their performance information. These APIs were queried every minute for the study period. This approximates to around 525,000 individual snapshots of the entire network in NSW – leading to over 500 million individual GPS points embedded with additional metadata which include performance information. Additional studies highlight the visual analytics of the geographic information found in such volumetric transport data (Lock, Bednarz, and Pettit Citation2019). An open-source sub-set of this data has been made available by the authors (Lock Citation2020).
3.1.3. User survey
An online survey captured demographic information, comments, and motivations by Twitter users to post about transport performance. Participants were selected from the pool of collected Tweets A research account was created on the Twitter platform to manually send Direct Messages (DMs) to these users. DMs are an opt-in service for users, so not every identified account could be contacted. The target pool of survey results was 100 respondents, the survey was closed when 114 responses were obtained. The web survey ran from November 9, 2018 to January 28, 2019. Survey questions can be found in Appendix B.
The questions of the survey, in summary, captured the following information:
Validation, demographics, eligibility – did the user indeed post on social media related to transport performance in the last 12 months? What are some basic characteristics of the respondent – age and employment?
Existing knowledge – how much do users already know about social media, Sydney, transport, and politics?
Communication platforms – where does the user usually express their positive or negative experiences of transport?
Motivation – why did the user choose to Tweet about this in the last 12 months?
Self-efficacy – does the user feel as if services can be influenced in a meaningful way? This factor relates to their both willingness and ability to participate.
Satisfaction – are they satisfied with this form of participating? Are they satisfied with the current transport performance?
Preferred participation – Which best describes the way they personally want to engage in improving everyday public transport services?
Open-ended questions – do users have any other comments, stories?
3.2. Analysis methods
3.2.1. Sentiment analysis
Sentiment analysis is receiving increased interest in the cities domain in ascertaining public responses to the provision of civic services through social media. Sentiment analysis is a challenging task, which aims to deduct the polarity of text and capture meanings and opinions – despite the potential lack of contextual information, as well as spelling and grammar mistakes. Such analysis is further problematic on social media, as there is an inclination to use abbreviated language as well as slang, irony, or sarcasm.
Sentiment analysis for this study was undertaken using natural language toolkit “nltk” (Bird, Klein, and Loper Citation2009). Specifically, the open-source VADER (Valence Aware Dictionary for sEntiment Reasoning) rule-based model for sentiment analysis for social media text was used (Hutto and Gilbert Citation2014).
VADER was specifically adjusted for sentiment in social media contexts (such as Twitter). VADER receives sentences as input and provides three values – for positive, neutral, and negative sentiments. These were transformed into a fourth, compound value, representing the overall polarity of a sentence. Examples of relevant studies using VADER include detecting public sentiment about the Great Barrier Reef (Becken et al. Citation2017) and creating training data sets for more sophisticated machine learning algorithms to predict election results (Ramteke et al. Citation2017).
A small sample of open-source VADER results was also compared with results from IBM Watson Tone Analyzer (IBM Citation2019), representing a “Smart City” vendor product which, at present, is free for small users but more costly for larger-scale organizations. Tone Analyzer detects “joy, fear, sadness, anger, analytical, confident and tentative” tone in text using supervised machine learning techniques (ibid.,Citation2019).
3.2.2. Topic modeling
Topic modeling is a statistical modeling technique for identifying abstract “topics” that occur in groups of “documents” (here, Tweets). This study uses Latent Dirichlet Allocation (LDA) as a topic extraction model. This is an unsupervised machine learning model developed by Blei, Ng, and Jordan (Citation2003). Using this technique, words that appear many times together in the same document are assumed to be related, and therefore are more likely to be assigned to the same topic. Co-occurring words are placed into topics through a clustering process. This is known as a “bag-of-words” model.
A mixture of topics is produced for every document. For example, a document can be 20% topic A, 40% topic B and 40% topic C. This is in contrast to other clustering algorithms (such as k-means and DBSCAN), which assign each object to one distinct group. The open-source Gensim library (Rehurek and Sojka Citation2010) was used to perform the LDA. To prepare for LDA, Tweet text undergoes a text normalization process – including removal of stop words, punctuation, lemmatization, and being made lower case (Loria et al. Citation2014).
This technique is generally applied to news items and long written works. Its application on short and informal documents like Tweets is increasingly being applied for detecting and analyzing events. Examples include in disasters (Huang et al. Citation2015; Kireyev, Palen, and Anderson Citation2009) and crime (Wang, Gerber, and Brown Citation2012). In the context of urban planning and management, Lansley and Longley (Citation2016a) have applied the LDA method to study the spatial and temporal distribution of unique Tweet topics in the city of London. The authors demonstrated that these data and method reveal insights useful to the study of urban dynamics such as land-use and activity patterns. Here we use this technique to investigate the daily interests (topics) of those using certain keywords related to public transport in the city of Sydney.
4. Results
4.1. RQ1 – Expressing content or discontent
This first section investigates the use of sentiment and tone analysis techniques in understanding the levels of satisfaction reported by public transport users on social media inherently communicated through their use of language. Using the VADER natural language processing method on the full sample of Tweets, it was found approximately 36% of all Tweets were found to express a negative sentiment, 29% a neutral sentiment and 35% positive sentiment. Based on this, there is no conclusive majority was identified using this method. Manual scans of these results indicate that in many cases, content that could be interpreted as sarcastic was not picked up as negative sentiment, but rather as positive.
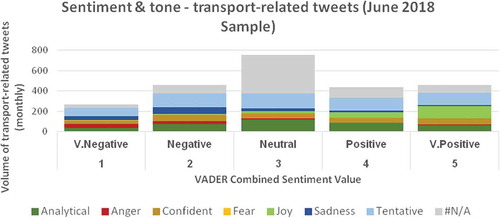
The IBM Watson Tone Analyzer was used for this sample, for the month of June. Due to the cost of using this service, analysis was limited to this time. The results identified just over a quarter (26%) of the Tweets as having the strongest tone as “Tentative”, followed by 16% “Analytical”, 11% “Confident”, 9% Joy, 6% Sadness, 4% “Anger” and less than 1% “Fear”. A large proportion, 28%’, could not be given a tone, flagged as “#N/A”.
By comparing both methods, we can observe where positive emotions (such as “joy”) and negative (such as “fear” and “sadness”) detected using the trained models from IBM Watson Tone Analyzer are also detected through the VADER derived sentiment values. When comparing VADER sentiment values to tone for the same month, the “Tentative” tone appears at high volume across all VADER sentiment values. Tentative comments using VADER are labeled as “questionable” and “doubtful” in nature. “Joy” appears almost exclusively in the positive VADER categories, and “Anger” and “Sadness” also, almost exclusively in the negative categories. This gives an indication of confidence about results and presence of false positives or negatives, the results appear in .
Consider a question such as “Can you please confirm, will my train be very, or just slightly delayed? It’s been a joy waiting”. This is an example of a message that would be marked as “tentative” and “positive” using these techniques, though our intuition of this context would tell us this message is negative and sarcastic.
Figure 2. Volume of tweets in June 2018, categorized by both Sentiment (VADER, 1 to 5) and Tone (from IBM Watson Tone Analyzer)
The user survey results indicate a much clearer expression of discontent from the majority of citizens. They also highlight the mixed and multiple reasons why these people have chosen to post on social media. When asked, 77% of survey participants highlighted several reasons, their reason to post was “to complain” (described as “using their opinion to highlight bad or undesirable services”) represented the most popular response. Further, participants also stated they also used social media “to vent” (68%), “to understand” (54%), “to suggest” (54%) and “to praise” (39%).
As such, a post containing multiple motives such as both “to complain” and “to suggest” cannot be sufficiently summarized through sentiment alone; but perhaps, through multiple techniques such as above – “negative” and “analytical” in tone. Further details of the survey results can be found in Appendix C.
Results indicate that, although there are high volumes of dissatisfaction expressed about the public transport system, this would be an oversimplification. Through survey results, 77% highlighted one of their main reasons of posting to complain. Automated approaches such as VADER captured 36% negative sentiment, and Tone Analyzer a highly similar value of 36% for tentative, anger, fear, and sadness tones combined. The results show that open-source methods of natural language processing (such as VADER) are useful techniques but limited in understanding nuances such as sarcasm. By using a multiple model approach (exploring results of VADER and IBM Watson Tone Analyzer combined), a more balanced understanding of the sentiment of these messages can potentially be made.
4.2. RQ2 – Topic analysis
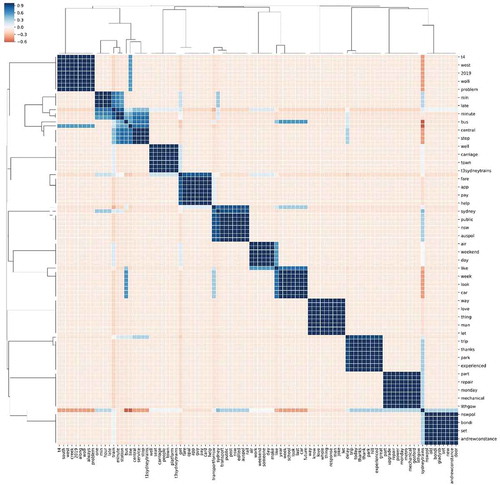
In this section, the LDA Topic Model approach ascertained an overview of topics derived from the full sample of Tweets. By iteratively assessing the results, 12 (k = 12) clusters were found to be useful in providing a salient overview of themes. The topics ranged from issues with individual services (topics 2,3,5,8,11), about the train experience (topics 5,12) automated or semi-automated reporting on service delays (topic 1), responses to news events (topics 2,4,10,12) as well as disgruntled messages with limited context (5,9). The following table highlights the most common 20 words that were co-located for each of the modeled topics, as well as an interpretation based on viewing individual Tweets that were highly rated for each topic. Further, it highlights the percent of overall Tweets had their dominant topic as that topic. These results are summarized in . A correlation matrix of the clustering results is in Appendix D.
Table 1. LDA results – 12 derived topics, interpretation, and percent of Tweets with that as dominant topic
In terms of the user survey, results indicate that access to information, travel time, waiting time, network design and crowdedness were rated as the four most important topics for those who had tweeted about transport performance, respectively. Safety and comfort were also rated as important. Comfort, stop access, customer service, and ticketing were rated as the four least important. Other responses specifically mentioned wider issues such as privatization of services, reporting damaged faulty rolling stock, and more thorough communication on what to do during disruptions and faults as important topics to discuss on Twitter.
Clear similarities between results of the survey and the topic modeling were identified – revealing important mutual topics such as accessing information at crucial times and delays. The topic modeling, however, revealed further insights about content from accounts, which likely did not participate in the surveys (possibly, more largely reflecting the nature of the platform itself). These include content from automated bots, identification of large-scale disruptions to the network, recurring names of lines and services, and specific commentary on political issues/figures which were not captured at the same scale in the survey. Although the volume of Tweets changes week to week, the distribution of these topics did not experience significant variation over time.
4.3. RQ3 – Relationship
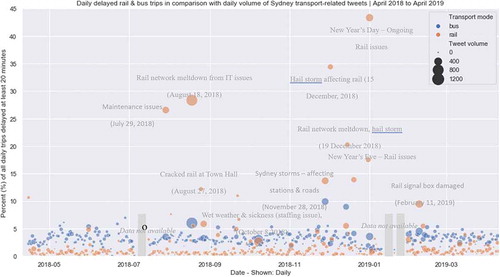
In this section, we investigate whether there is a relationship between transport delays and daily Tweet volume. compares daily network-wide delay for rail and bus (indicated by the color of the point) with the volume of Tweets (indicated by the size of the point) over a 12 month period. It is the result of combining and aggregating minute-by-minute delay information for the year, from April 2018 to April 2019. A trip delay is when at any time of the day, a trip was delayed 20 minutes or more. This creates an overall network performance measure for that day as the percent of trips delayed.
In general, rail performance sits below 2.5% of services per day reaching this delay. For buses, this is closer to 5% of services and much more variable (expected, as they generally operate in a congested environment). While buses experienced some days above 5%, this did not peak much higher than 10%. Rail services, on average encountered fewer delays than buses, but periodically experienced very heavy peaks of reduced performance. These results could be quickly verified by searching local news articles (ABC, Sydney Morning Herald) and weather reports (Bureau of Meteorology Citation2018) of the same date, which are included in the graph for context.
These reflect major incidents related to maintenance issues, staffing issues, staffing, signaling, and unusual weather events. These issues affected 15% of all services and almost 45% of all daily services, so there was an expectation of major peaks in social media activity related to these issues. While this was true for some of the events, we can see in – that this did not occur in all cases.
Figure 3. Daily delayed rail and bus trips in comparison with daily volume of Sydney transport-related tweets over time; annotated with information about significant transport disruptions documented during the year
The following illustrates the percentage of bus trips delayed by at least 20 minutes in comparison with daily Tweet volume. It can be seen that there is a clear range between 0% and 6% delay and 0–200 Tweets per day these fall into. A weak linear relationship appears between these variables when describing moments with a high Tweet volume and less optimal performance.
Figure 4. Daily delayed bus trips in comparison with the daily volume of Sydney transport-related Tweets
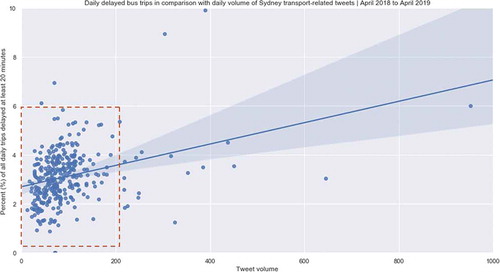
Figure 5. Daily delayed rail trips in comparison with the daily volume of Sydney transport-related Tweets
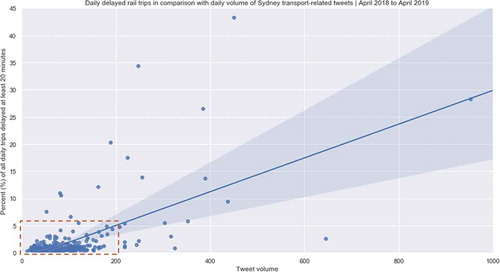
shows the same data, but for rail. Again, rail experiences far less variability in the performance metrics. The relationship appears more pronounced; however, the overall network performance still does not present a heavy influence on Tweet volume. Following these comparisons, there are no immediately salient relationships visible between network performance, in terms of delay, and Tweet volume.
4.4 RQ4 – Bias
The following section discusses three specific potential biases measurable through the survey and Tweets – age, employment, and regularity of travel. First, we discuss the sample of users available. Of approximately 13,200 usernames in the Tweet sample, the survey sample was 114. We applied a confidence level of 95% and achieved a confidence interval of 9.2% indicating that the survey reflects the general population of Twitter users who had voiced an opinion on transport in the previous 12 months.
presents a comparison between the age distribution of the Twitter users who responded to the survey in relationship with that found within the Australian 2016 Census (Australian Bureau of Statistics Citation2016). This compares a) the general population in Greater Sydney b) the population who responded to the survey and c) the population of the general labor force.
Table 2. Proportion of population in survey sample (social media) versus Labor Force and general population in Sydney
Comparing the general population, to that found in the survey, we see that it is likely that those aged above 65 are under-represented, and 25–34 are over-represented when using this platform. Conclusions cannot be made about those 17 and under, as they were excluded from the survey. Furthermore, survey respondents were more similar in structure to the labor force than the general population, in particular at the 18–24 and 35–44 age brackets. From these results, it seems likely that this group contains more 25–34-year-olds in comparison with both the general population of Sydney and its labor force.
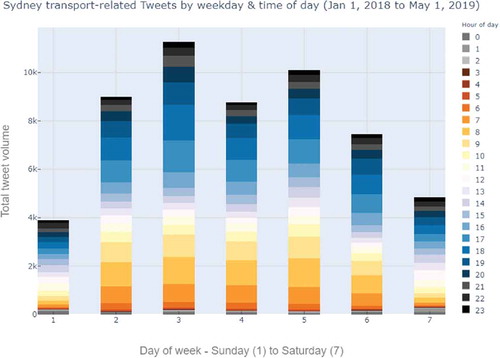
In terms of regularity of travel, the transport-related Tweets showed an expected trend of following peak travel periods (i.e. when most people are using the transport network). A summary of total volume of transport-related Tweets versus time of day is shown in . On weekdays, the periods between 7 am – 10 am and 5 pm – 8 pm had the highest volumes of posts. On weekends, the volume of Tweets was more evenly distributed – with more Tweets occurring on Saturdays than Sundays. Generally, more of this activity occurs in the second half of the day (after 12pm) than the first half of the day.
Figure 6. Sample of transport Tweets in Sydney by weekday and time of day
Results indicate that potential sample bias is in line with other research, which has found large populations of social media users (Facebook & Twitter) to generally be younger than the wider population (Blank Citation2017; Mellon and Prosser Citation2017). These studies also indicate that social media users represent a more educated group than the wider population. As such, content reflects the interests, values, priorities of a particular sub-set of public transport users – which is more useful as a window to that population but more limited for wider-scale generalizations. Further recommendations on extending this understanding of bias appear in the discussion section.
4.5. RQ5 – Replacement
This section will discuss insights from the survey results, which asked both targeted and open-ended questions in order to gain insight into how satisfied respondents were with existing feedback channels.
In terms of platform uptake, the results of the survey indicated that respondents had a low uptake of official channels – such as calling, emailing, and online forms. Fewer than half, 38%, of participants reported using these in the past 12 months. As such, more than half (62%) of the respondents had not used these channels. The results also indicate a very low presence in physical or community meetings, where only 7% have attended those related to transport in Sydney. In terms of responsiveness, although citizens can be messaged back through online channels, many respondents noted when answering open-ended questions that it is unclear as to whether these affected any form of tangible operational response.
When prompted about preferred engagement formats, two key engagement formats were notable in the responses. Firstly, despite only 7% having reported attended meetings in the past 12 months, there was an unexpectedly expressed a high level of interest in actually being able to attend physical meetings. This was described by one respondent as a desire “to attend government workshops/forums/public discussions” on the topic.
Secondly, many users suggested engagement platforms using web and mobile applications. Numerous responses desired a seamless way to give feedback through mobile applications, for example through “an app integrated with Opal/etc allowing for quick reporting of service issues,” or through Star Rating features after trips such as in services such as Uber, Ola, and Didi. These descriptions involved applications that would use linked data from their transport smartcard (Opal) to give feedback directly about trips captured by their card.
As well as suggesting digital platform solutions, many participants advocated for optimized use of their data. This was an important topic, summarized by four key quotes. One user-specified: “I don’t have time to constantly chase for change on public transport. I rather the data do the talking”. Another user wrote that transport providers should “[use] anonymised data about traveller habits to improve the way public transport responds.” Another user wrote that operators should “collect and review social media data about transport performance,” while one wrote: “I think social media [data] does give a pretty reasonable picture of what’s happening when it comes to public transport at least.”
When prompted about preferred levels of participation, the majority of participants (80%) stated they would prefer active ways to participate in operational transport planning decisions. Of this, 48% of the total expressed a willingness to contribute small amounts of time (such as surveys and questionnaires). The other 32% were willing to devote longer periods (such as focus groups, workshops and interviews). A remaining 14% preferred passive forms of participation – they wanted their data to be collected and used without any personal input. Interestingly, 2% indicated that they did not want any input in the process. The final 4% (“Other”) described forms which were mixtures or described no preferences as they felt that their voice would not be heard.
When prompted about satisfaction with current feedback mechanisms, this was reported as notably low. The majority (79%) of respondents indicated that they were below “Satisfied”. Respondents were 15% “Very unsatisfied” and “37% Unsatisfied”. Of those the 14% that was satisfied, only 3% were “Very satisfied”.
As well as the quantitative response, there was an unanticipated high volume of detailed qualitative written responses in forms of stories and anecdotes prompted by two of the questions “Do you have any other comments, stories, anecdotes about your engagement in dialogue on public transport services?” (50 responses, an average of 68 words per response) and “Describe a way you personally would want to engage in improving everyday public transport services?” (108 responses, an average of 22 words per response). More details about these quotes are found in Appendix E.
From these results, it was clear that the majority survey respondents articulate their desire to have a more active voice in operational transport issues. The results indicate that more comprehensive participation mechanisms than the current feedback channels would be suitable in this context. Several digital platforms and applications were suggested, but these would need to be clearly designed and intended as active participation mechanisms, rather than solely as passive data collection techniques.
5. Discussion
A variety of analytical methods were employed to understand the usefulness of Twitter data and modern data mining techniques in ascertaining customer experience and feedback concerning operational transport performance. The mixture of methods, particularly those probing user intentions in the survey, proved an effective mechanism for understanding the discourse about transport performance in Sydney.
In addressing RQ1, a large proportion of surveyed users used the platform to complain and to vent, but also had motives to suggest improvements and praise services. In analyzing sentiment and tone from all Tweets – sarcasm was specifically difficult to deal with and likely masked a proportion of comments perceived as negative. The use of multiple models demonstrated useful potential in the understanding language in ways that are more complex; adding confidence to the interpretation of these results.
When deliberating on such techniques, it is worth considering research studies such as González-Ibánez, Muresan, and Wacholder (Citation2011, 585) who found that, in detecting sarcasm, “humans do not perform significantly better than the simple automatic classification methods”. This reveals that, ultimately, the authors of the Tweets themselves only fully know the intended tone and sentiment of a message.
Sarcasm detection in sentiment analysis cannot be achieved without having a deep understanding of the context of the situation, the specific topic, and the environment. For example, Peng et al. (Citation2019) found that sarcastic expressions on social media are more regular at times during a service disruption (in the telecommunications industry) than on regular days – which can pose problematic results if it is not understood and may even mask the effects of the disruption. The use of third party or proprietary machine learning models, with limited access to understanding who trained them and how, makes it difficult to ascertain whether they will perform effectively in certain contexts (i.e. related to transport, and in Australia). Ensuring that training models are adapted to specific contexts and scenarios can address this gap.
In addressing RQ2, a number of salient topics could be extracted using the LDA modeling approach. These could potentially be useful for operational planning – such as flagging comments, which are related to specific lines and services. Many other topics shown demonstrate usefulness beyond application of this study – such as commentary of news events, which may be useful for political decision-making. Importantly, the topic modeling also highlighted the potential percentage of Tweets which were not useful – for example those not including any contextual information, or those from bots which continuously report information using similar words. A limitation of the LDA approach is the specification of the number of clusters (k), and the potential time-consuming nature of manual human interpretation of the categories.
In addressing RQ3, we found that there is a low to moderate relationship between transport-related Tweets and actual full network performance as measured by delay, for a variety of reasons. A delay on even one critical service say, after a sporting event, may not necessarily be flagged as a significant delay across the whole network – however it may have a significant social media response. Results from the survey also indicate the access to information was more important than delay itself – that people would prefer to know what is going on, or what to do during the delay, rather than the delay itself. Secondly, as identified in the topic modeling, not all Tweets relate specifically to daily performance. Thirdly, not all Tweets are specifically negative or about delay. Thus, there are many more factors at play related to satisfaction with the network and potential improvements, than the performance of the network itself.
In addressing RQ4, the population breakdown largely reflected the labor force in age. As inferred from the time of posting, it is also highly likely that these Tweets occurred during peak travel periods and thus were posted by those who commute during peak hour. Researchers and practitioners should be mindful of this, so as not to ignore edge cases for off-peak travel and those who may not use Twitter. Inversely, this group indeed represents a data source for a population who may not have the same levels of disposable time as others and we may need to rely on these passively collected data sources to engage them when using a mixed approach.
Further study on bias in this context could further generate commentary on socioeconomic variables, ethnicity, and gender. While the survey data provide several respondent characteristics, there are ways in which social media user names and identifiers can be used to infer demographic characteristics such as age and gender (Lansley and Longley Citation2016b). There are also associations between use of language and socioeconomic variables which can further complement this work (Preoţiuc-Pietro et al. Citation2015). The recruitment strategy for the survey sample targeted Twitter users, and thus the sample does not represent views of those who do not post on that platform.
In addressing RQ5, this component of the study elicited very insightful responses. There was a very strong user preference for alternate forms of engagement as opposed to existing platforms, which this group had low satisfaction levels. New platforms and tools might allow these people an opportunity to provide more seamless feedback on the network in an active way. The majority of participants would prefer active forms of participation, and while some indicated that they would like passive data used, this was noticeably much lower.
6. Conclusions
Planners and operators committed to a stronger role for public transport in cities should further develop their social media strategies in how they communicate with citizens on social media as identified in a similar context for Sydney (Williamson and Ruming Citation2019). They must also consider the ways they choose to collect, monitor, and analyze social media data in meaningful and participatory ways (Lock et al. Citation2020). As illustrated by this research, a wide array of topics, sentiments, and relationships can be ascertained from social media data and transport data feeds using low-cost models and tools. However, surveys, for all their potential shortcomings, are still useful mechanisms by which we can address the potential cognitive dissonances these methods may reveal.
Although comprehensive information is available, these findings suggest that these feeds are a complementary rather than a primary form of data collection due to limitations within the sample and the techniques used to derive meaning from these data. While we can estimate and infer from these feeds, the motivations and true desires of people are more reliable when they are asked directly. Forms of stream analytics, dashboards, and the formation of metrics, as such, need to move beyond simply showing data as it is, but modeling information on the fly and presenting an array of cross-validated results guided by human input.
Unique to this research was using survey data directly from those Twitter users – asked directly to those who have posted on social media. Such data were highly useful in identifying motivations behind these posts, and ultimately that large numbers of those sampled would indeed prefer robustly active forms of participation. While unearthing some of the challenges associated with using human sensor data, this research demonstrates further exploration of assemblages of modeled collective-sensed data as one of the many forms of participation that should exist in the city is worthwhile.
Acknowledgments
The authors would like to thank Assoc. Prof. Tomasz Bednarz and Dr. Simone Leao for comments and support leading towards this piece of research. This piece forms part of a case study of Oliver Lock’s PhD research. Additional thanks to the reviewers for their detailed constructive feedback.
Additional information
Notes on contributors
Oliver Lock
Oliver Lock is a Scientia PhD candidate at UNSW. Here he works between two labs– the City Analytics lab and the Expanded Perception & Interaction Centre (EPICentre). His research focuses on how visual analytics techniques can be applied to better understanding of urban mobility. Previously, Oliver has private sector consulting experience at engineering & design firm Arup and several smaller boutique data/transport modeling firms. Oliver trained in urban planning and informatics at the University of Melbourne, and spatial data science and visualization at The Bartlett CASA, UCL.
Christopher Pettit
Christopher Pettit is the inaugural Chair of Urban Science at the University of New South Wales (2015). For the last 20 years, he has been undertaking research and development in the use of spatial information and mapping technologies for envisioning what if? scenarios across both urban and regional landscapes. His research expertise also spans into applications, development, and the critique of geographical visualization tools including, advanced spatial decision support systems and city dashboards.
References
- Australian Bureau of Statistics. 2016. “Counting Persons, Place of Usual Residence 2016 Census.” Table builder, 2016.
- Becken, S., B. Stantic, J. Chen, A. R. Alaei, and R. M. Connolly. 2017. “Monitoring the Environment and Human Sentiment on the Great Barrier Reef: Assessing the Potential of Collective Sensing” Journal of Environmental Management 203: 87–97. doi:10.1016/j.jenvman.2017.07.007.
- Bird, S., E. Klein, and E. Loper. 2009. Natural Language Processing with Python. 1st ed. Sebastopol, CA: O’Reilly Media.
- Blank, G. 2017. “The Digital Divide among Twitter Users and Its Implications for Social Research.” Social Science Computer Review 35 (6): 679–697. doi:10.1177/0894439316671698.
- Blei, D. M., A. Y. Ng, and M. I. Jordan. 2003. “Latent Dirichlet Allocation.” Journal of Machine Learning Research 3: 993–1022. http://www.jmlr.org/papers/volume3/blei03a/blei03a.pdf
- Bruno, S., C. Yang, W. Tian, Z. Xie, and Y. Shao. 2019. “Exploring the Characteristics of Tourism Industry by Analyzing Consumer Review Contents from Social Media: A Case Study of Bamako, Mali.” Geo-spatial Information Science 22 (3): 214–222. doi:10.1080/10095020.2019.1649848.
- Bureau of Meteorology. 2018. “December 2018 - Weather Archive – Sydney”. http://www.bom.gov.au/climate/current/month/nsw/archive/201812.sydney.shtml
- Collins, C., S. Hasan, and S. V. Ukkusuri. 2013. “A Novel Transit Rider Satisfaction Metric: Rider Sentiments Measured from Online Social Media Data.” Journal of Public Transportation 16 (2): 21–45. doi:10.5038/2375-0901.16.2.2.
- Gong, Y., and R. O. Sinnott. 2015. “Identification of (Near) Real-Time Traffic Congestion in the Cities of Australia through Twitter,” 7–12.
- González-Ibánez, R., S. Muresan, and N. Wacholder. 2011. “Identifying Sarcasm in Twitter: A Closer Look.” In Proceedings of the 49th Annual Meeting of the Association for Computational Linguistics: Human Language Technologies: Short Papers-Volume 2, Portland, Oregon, 581–586.
- Goodchild, M. F. 2007. “Citizens as Sensors: The World of Volunteered Geography.” GeoJournal 69 (4): 211–221. doi:10.1007/s10708-007-9111-y.
- Gu, Y., Z. Qian, and F. Chen. 2016. “From Twitter to Detector: Real-Time Traffic Incident Detection Using Social Media Data.” Transportation Research Part C: Emerging Technologies 67: 321–342. doi:10.1016/j.trc.2016.02.011.
- Huang, Q., G. Cervone, D. Jing, and C. Chang. 2015. “DisasterMapper: A CyberGIS Framework for Disaster Management Using Social Media Data.” Proceedings of the 4th ACM SIGSPATIAL International Workshop on Analytics for Big Geospatial Data, Bellevue, WA, BigSpatial 2015, November: 1–6. doi:10.1145/2835185.2835189.
- Hutto, C. J., and E. Gilbert. 2014. “Vader: A Parsimonious Rule-Based Model for Sentiment Analysis of Social Media Text.” In Eighth International AAAI Conference on Weblogs and Social Media, Ann Arbor, Michigan.
- IBM. 2019. “IBM Watson Tone Analyzer”. https://github.com/ibm-cloud-docs/tone-analyzer/blob/master/science.md
- Kireyev, K., L. Palen, and K. Anderson. 2009. “Applications of Topics Models to Analysis of Disaster-Related Twitter Data.” NIPS Workshop on Applications for Topic Models: Text and Beyond. http://www.umiacs.umd.edu/~jbg/nips_tm_workshop/15.pdf
- Kitchin, R., T. P. Lauriault, and M. Gavin. 2015. “Knowing and Governing Cities through Urban Indicators, City Benchmarking and Real-Time Dashboards.” Regional Studies, Regional Science 2 (1): 6–28. doi:10.1080/21681376.2014.983149.
- Kuflik, T., E. Minkov, S. Nocera, S. Grant-Muller, A. Gal-Tzur, and I. Shoor. 2017. “Automating a Framework to Extract and Analyse Transport Related Social Media Content: The Potential and the Challenges.” Transportation Research Part C: Emerging Technologies 77: 275–291. doi:10.1016/j.trc.2017.02.003.
- Lansley, G., and P. Longley. 2016a. “Deriving Age and Gender from Forenames for Consumer Analytics.” Journal of Retailing and Consumer Services 30: 271–278. doi:10.1016/j.jretconser.2016.02.007.
- Lansley, G., and P. A. Longley. 2016b. “The Geography of Twitter Topics in London.” Computers, Environment and Urban Systems 58: 85–96. doi:10.1016/j.compenvurbsys.2016.04.002.
- Lock, O. 2020. “High-volume Public Transport Vehicle Locations (Rail, Bus, Ferry and Light Rail) and Performance Metrics for Sydney Dated from March 2018 to April 2019 (GTFS Real-time).” Mendeley Data. doi:10.17632/gstfpzg339.1.
- Lock, O., T. Bednarz, and C. Pettit. 2019. “HoloCity – Exploring the Use of Augmented Reality Cityscapes for Collaborative Understanding of High-Volume Urban Sensor Data.” In VRCAI ’19, November 14–16, 2019, Brisbane, QLD, Australia. doi:10.1145/3359997.3365734.
- Lock, O., T. Bednarz, S. Z. Leao, and C. Pettit. 2020. “A Review and Reframing of Participatory Urban Dashboards.” City, Culture and Society 20: 100294. doi:10.1016/j.ccs.2019.100294.
- Loria, S., P. Keen, M. Honnibal, R. Yankovsky, D. Karesh, and E. Dempsey, and others. 2014. “Textblob: Simplified Text Processing.” Secondary TextBlob: Simplified Text Processing.
- Mellon, J., and C. Prosser. 2017. “Twitter and Facebook are Not Representative of the General Population: Political Attitudes and Demographics of British Social Media Users.” Research and Politics 4 (3): 1–9. doi:10.1177/2053168017720008.
- Mendez, J. T., H. Lobel, D. Parra, and J. C. Herrera. 2019. “Using Twitter to Infer User Satisfaction with Public Transport: The Case of Santiago, Chile.” IEEE Access 7: 60255–60263. doi:10.1109/ACCESS.2019.2915107.
- Mitchell, L., M. R. Frank, K. D. Harris, P. S. Dodds, and C. M. Danforth. 2013. “The Geography of Happiness: Connecting Twitter Sentiment and Expression, Demographics, and Objective Characteristics of Place.” PLoS ONE 8: 5. doi:10.1371/journal.pone.0064417.
- Panagiotopoulos, P., J. Barnett, A. Z. Bigdeli, and S. Sams. 2016. “Social Media in Emergency Management: Twitter as a Tool for Communicating Risks to the Public.” Technological Forecasting and Social Change 111: 1–27. doi:10.1016/j.techfore.2016.06.010.
- Peng, W., A. Adikari, D. Alahakoon, and J. Gero. 2019. “Discovering the Influence of Sarcasm in Social Media Responses.” Wiley Interdisciplinary Reviews: Data Mining and Knowledge Discovery, January: 1–6. doi:10.1002/widm.1331.
- Preoţiuc-Pietro, D., S. Volkeva, V. Lampos, Y. Bachrach, and N. Aletras. 2015. “Studying User Income through Language, Behaviour and Affect in Social Media.” PLoS ONE 10 (9): 1–17. doi:10.1371/journal.pone.0138717.
- Quercia, D., J. Ellis, L. Capra, and J. Crowcroft. 2012. “Tracking ‘Gross Community Happiness’ from Tweets.” Proceedings of the ACM Conference on Computer Supported Cooperative Work, Seattle, Washington, CSCW, February: 965–968. doi:10.1145/2145204.2145347.
- Ramteke, J., S. Shah, D. Godhia, and A. Shaikh. 2017. “Election Result Prediction Using Twitter Sentiment Analysis.” In Proceedings of the International Conference on Inventive Computation Technologies, ICICT 2016, 1:1–5. Coimbatore, India, IEEE. https://doi.org/10.1109/INVENTIVE.2016.7823280
- Rehurek, R., and P. Sojka. 2010. “Software Framework for Topic Modelling with Large Corpora.” Proceedings of the LREC 2010 Workshop on New Challenges for NLP Frameworks, Valletta, Malta, 45–50.
- Salas, A., P. Georgakis, C. Nwagboso, A. Ammari, and I. Petalas. 2017. “Traffic Event Detection Framework Using Social Media.” 2017 IEEE International Conference on Smart Grid and Smart Cities, Singapore, ICSGSC 2017, 303–307. https://doi.org/10.1109/ICSGSC.2017.8038595
- Saragih, M. H., and A. S. Girsang. 2018. “Sentiment Analysis of Customer Engagement on Social Media in Transport Online.” Proceedings - 2017 International Conference on Sustainable Information Engineering and Technology, Malang, Indonesia, SIET 2017 2018-Janua: 24–29. https://doi.org/10.1109/SIET.2017.8304103
- Schweitzer, L. 2014. “Planning and Social Media: A Case Study of Public Transit and Stigma on Twitter.” Journal of the American Planning Association 80 (3): 218–238. doi:10.1080/01944363.2014.980439.
- Tasoulis, S. K., A. G. Vrahatis, S. V. Georgakopoulos, and V. P. Plagianakos. 2018. “Real Time Sentiment Change Detection of Twitter Data Streams.” In 2018 IEEE (SMC) International Conference on Innovations in Intelligent Systems and Applications, INISTA 2018. Thessaloniki, Greece. doi:10.1109/INISTA.2018.8466326.
- Tejaswin, P., R. Kumar, and S. Gupta. 2015. “Tweeting Traffic: Analyzing Twitter for Generating Real-Time City Traffic Insights and Predictions.” Proceedings of the 2nd IKDD Conference on Data Sciences - CODS-IKDD ’15, pp. 1–4. Bangalore, India. doi:10.1145/2778865.2778874.
- Tenney, M, and R. Sieber. 2016. “Data-driven participation: Algorithms, cities, citizens, and corporate control.” Urban Planning 1 (2): 101–113.
- TfNSW. 2019. “TfNSW Open Data Hub and Developer Portal.” 2019. https://opendata.transport.nsw.gov.au/
- Wang, D., A. Al-Rubaie, J. Davies, and S. S. Clarke. 2014. “Real Time Road Traffic Monitoring Alert Based on Incremental Learning from Tweets.” IEEE SSCI 2014-2014 IEEE Symposium Series on Computational Intelligence - EALS 2014: 2014 IEEE Symposium on Evolving and Autonomous Learning Systems, Proceedings, Orlando, FL, 50–57. doi:10.1109/EALS.2014.7009503.
- Wang, X., M. S. Gerber, and D. E. Brown. 2012. “Automatic crime prediction using events extracted from twitter posts.” In International conference on social computing, behavioral-cultural modeling, and prediction, pp. 231–238. Springer, Berlin, Heidelberg. doi:10.1007/978-3-642-29047-3_28.
- Welch, T. F., and A. Widita. 2019. “Big Data in Public Transportation: A Review of Sources and Methods.” Transport Reviews 54–63. doi:10.1080/01441647.2019.1616849.
- Williamson, W., and K. Ruming. 2019. “Can social media support large scale public participation in urban planning? The case of the# MySydney digital engagement campaign.” International Planning Studies (online published). doi:10.1080/13563475.2019
- Zhang, Z., Q. He, J. Gao, and M. Ni. 2018. “A Deep Learning Approach for Detecting Traffic Accidents from Social Media Data.” Transportation Research Part C: Emerging Technologies 86: 580–596. doi:10.1016/j.trc.2017.11.027.
Appendix A
Twitter transport-related search terms for Sydney
Table A1. Key Twitter search terms used in study
Table A2. Proportion of collected Tweets by inclusion of search term
Appendix B
Overview of survey questions
Table B1. Survey questions
Appendix C
Summary of survey results
Table C1. Twitter user survey – tweeting about Transport Performance in Sydney – quantitative results
Appendix D
LDA clustering results
Figure D1. Results of LDA modeling. A darker blue color denotes a stronger relationship between co-occurring words
Appendix E
Survey key quotes
On responsiveness to complaints
“I got a ‘personal’ response back to my claim that gave solutions that didn’t solve my issue. Actually solving the issue would be nice. It currently feels like you Tweet or write a complaint and it goes nowhere.”
“The problem is more that Sydney Trains are not very receptive to customer feedback. I am happy to help but feel like any suggestions will just fall on deaf ears.”
“It appears the TfNSW and Buses North staff are all one way communication conduits who ask for you to go to 131,500 rather than action anything shared to them.”
“I like using Twitter, but would like to know that I’m not yelling into the cloud, that it is actually going somewhere useful. Also love Tripview app, be good to be able to give feedback through 3rd party apps.”
“TfNSW needs to be more responsive to feedback. Their feedback service spits back a handwritten response, but I have no confidence in this feedback informing planning. “
On preferred engagement format
“Surveys, group session (under an hour/weekend), ultimately I’d like feedback used to improve system “
“Via focus group (in person or online) “
“Feedback on social media “
“Be able to vent or disclose my thoughts […] on a platform where transport workers can see the frustrations or positive comments for feedback and action “
“An app with a well-designed, user friendly feedback section, maybe where you can select the train or bus you were on also “
“[Being able to give] feedback through apps (Opal, transport etc) “
“I am happy to fill out surveys – or attend workshops – if I am compensated for my time – especially the time it takes to travel to anywhere in Sydney “
“[Create] a rating system for each Opal trip “
“Open up a day to have city folk drop in and talk “
“I would be more than willing to participate in government workshops/forums/public discussions. It would be hypocritical to complain about not being heard and not having an opportunity to be heard by people in power and then not take part. ”
“An app integrated with Opal/etc allowing for quick reporting of service issues”
“Small group workshop, online surveys.”
“’Action Groups’ tend to hog a lot of consultation processes related to transport, so distort the view of the community by a noisy few. Giving more people a quick way to provide input would allow a more broad community view to be seen”
“Ideally an app or mobile friendly page with a number of questions to answer. Something that you could do while on public transport. Current processes to provide feedback to TfNSW are too laborious and you know they basically go into a void in TfNSW.”
“Ongoing questionnaires, surveys and reports”
“Interactive website/app allowing for sampling of feedback.“
On the use of data
“I don’t have time to constantly chase for change on public transport. I rather the data do the talking”
“Anonymised data about traveller habits to improve the way public transport responds.”
“Collect and review social media data about transport performance”
“I think social media [data] does give a pretty reasonable picture of that’s happening when it comes to public transport at least.”
“Data is the crux of any good system now, but data is not sufficiently being used, from what I can tell, in the process”
“Use the massive data available from Opal accounts to rethink about where their customers are, where we go, and when.”
“I’d like a mix of real-time data and instant feedback from commuters to improve specific services and meet demand, rather than just one a year whole network changes. Changes should also be posted before implemented to allow for feedback. Recent bus changes occurred with 10 days’ notice and no opportunity to explain why it was worse”