
 ?Mathematical formulae have been encoded as MathML and are displayed in this HTML version using MathJax in order to improve their display. Uncheck the box to turn MathJax off. This feature requires Javascript. Click on a formula to zoom.
ABSTRACT
Urban barriers are often a consequence of the unplanned expansion of transport infrastructures, housing growth nearby existing transport infrastructures, and the vehicular traffic itself. This process, also known as “community severance”, is a problem that affects the travel patterns of the population and causes negative impacts to adjacent communities, but it is not easy to assess. As an alternative to the costly technologies and restricted-access data sometimes used to analyze urban barriers, we propose an analytical approach that assesses community severance levels by classifying the quality of Pedestrian Crossings on Urban Streets (the PeCUS index). Additionally, the approach is used to identify possible inequities nearby the different classification groups regarding demographic data. We used the chi-square (χ2) test of independence and the standardized Pearson residuals to indicate deficits and excesses of residents regarding the demographic characteristics studied surrounding the urban streets. We found the following evidences of associations: residents with low-income or those aged up to 19 tend to live close to the worst crossings, whereas residents with permanent mobility constraints or the elderly tend to live near the crossings with the best classifications. Therefore, the study shows that the assessment of community severance by the analysis of the PeCUS index is feasible. Moreover, it reveals that the distribution of residents surrounding the distinct classes of quality of crossings is equitable for vulnerable social groups, except for low-income or young residents.
1. Introduction
Urban barriers are often a consequence of the unplanned expansion of transport infrastructures (railways, freeways, roadways, urban streets, etc.), housing growth nearby existing transport infrastructures and the vehicular traffic itself (Lara Citation2019). This process, also known as “community severance”, is a problem that affects the travel patterns of the population and causes negative impacts to adjacent communities.
Community severance is characterized by physical barriers to walking trips (Soguel Citation1995; Guo, Black, and Dunne Citation2001; Mouette and Waisman Citation2004; Anciaes et al. Citation2016) and to the access to goods, services, and people (Scholes et al. Citation2016; Mindell et al. Citation2017) as a consequence of transport infrastructures, usually those with high traffic volumes and speeds (Guo, Black, and Dunne Citation2001; Anciaes Citation2015; Anciaes et al. Citation2016; Scholes et al. Citation2016). In addition, psychological barriers are related to community severance as well, separating local communities (Taylor and Crawford Citation2009; Scholes et al. Citation2016), affecting perceptions, behavior, stress (Appleyard and Lintell Citation1972; Hine and Russell Citation1993; Hart and Parkhurst Citation2011), well-being, health (Timperio et al. Citation2006; Foley et al. Citation2017; Nimegeer et al. Citation2018), social interactions (Appleyard and Lintell Citation1972; Davis and Jones Citation1997; Hart and Parkhurst Citation2011; Scholes et al. Citation2016; Nimegeer et al. Citation2018) and intensifying social exclusion (Rajé Citation2004; Mackett and Thoreau Citation2015) of people who live or use the surrounding areas or need to make trips throughout or across the infrastructure or traffic stream (Anciaes Citation2015).
There are some social groups that are more susceptible to te effects of the community severance. In the literature, we identified that the elderly, children (Hine Citation1996; Mouette and Waisman Citation2004), residents who have a long-standing illness (Scholes et al. Citation2016; Foley et al. Citation2017), adults who need to accompany another individual with restricted mobility (Mouette and Waisman Citation2004), and people aged up to 19 years old and a particular lower income group (Lara and Rodrigues da Silva Citation2019) correspond to the social groups mainly affected.
Regarding crossing facilities, they are sometimes not favorable to pedestrian movements. Due to the type of crossing facility, its conservation status, location, on-site public lighting, among other factors, there may be pedestrian delays, risks of trampling, robbery, or violence (Lara Citation2019). Additionally, according to the study conducted by Mindell et al. (Citation2017), in general, the presence of a median strip aids pedestrians crossing the road, by splitting the crossing into two stages. However, in many cases, median strips can become an additional barrier, if they have steps or uneven surfaces, making them inaccessible to people with mobility restrictions. The study results indicated that participants prefer to avoid crossing roads with no crossing facilities, that the level of the barrier effect of roads on pedestrians was positively related with the road characteristics (number of lanes, traffic density, and traffic speed), and that the presence of a median strip decreased the barrier effect. Another study considering road characteristics (number of lanes, presence of a median strip, traffic density, and traffic speed) was developed by Anciaes, Jones, and Metcalfe (Citation2018), which indicated that pedestrians prefer to avoid crossing roads with more than one lane, no median strip, medium or high density, and speed equal or above 30 miles per hour. In addition, convenience, and distance of the crosswalk (Sisiopiku and Akin Citation2003), direct crossings (Cantillo, Arellana, and Rolong Citation2015), level crossings (DNIT Citation2010) were pointed out as pedestrians’ crossing preferences. On the other hand, pedestrian bridges, high traffic flow (Cantillo, Arellana, and Rolong Citation2015), underground passageways, and footbridges (DNIT Citation2010) were identified as less preferable. Moreover, elderly people, particularly those with health-related mobility constraints, and children were identified as more likely to cross streets using crossing facilities (Hine Citation1996).
Other aspects related to community severance that urban planners are concerned about are the inequalities in the distribution of different social groups nearby transport infrastructures, the quality of the facilities used for crossing these transport infrastructures, and the exposure to transport-related externalities. Concerning equity, Litman (Citation2002) presented two categories: horizontal and vertical. Horizontal equity involves the distribution of resources equally to each individual or group, whereas vertical equity implies in the distribution of resources according to each individual’s or group’s special needs in order to ensure they are not worse off, and that their needs are accommodated. In this study, we used the vertical equity concept.
Therefore, community severance affects day-to-day events and the behavior of people who have diverse demographic characteristics, and at different levels. The analysis of this interdisciplinary effect often involves many variables and tools, which can demand qualified and well-trained professionals (e.g. for specific data collection procedures), commitment from the target population, costly technologies, and restricted-access data (Lara Citation2019). For this reason, the combination of census data (although highly aggregated), open access data, and free Geographic Information System software into a single approach, whenever possible, may save time, effort, and financial resources. It can also help to answer the following questions: Is it possible to assess community severance by analyzing the quality of pedestrian crossings? Is there any evidence of associations between the distribution of residents with distinct demographic characteristics nearby urban barriers and the quality of pedestrian crossings? Is this distribution vertically equitable?
In this paper, we propose a simple and low-cost analytical approach to assess community severance based on a classification of the quality of pedestrian crossings carried out with the Pedestrian Crossings on Urban Streets index, hereafter named PeCUS. Furthermore, the approach identifies possible inequities regarding demographic data in the surroundings of the distinct classes of streets identified with the index. After this brief introduction, in Section 2 we describe the study area, the databases, and the analytical procedures adopted. In Section 3, we present and discuss the results and in Section 4, the conclusions are outlined. Finally, in Section 5, recommendations for future work are indicated.
2. Materials and method
This study presents an analytical approach to assess and classify the quality of pedestrian crossings on urban streets, given that the streets themselves sometimes become barriers to cross walking. The method is also used to identify possible inequities in the surroundings of the distinct classification groups, as shown in the case study conducted in a Brazilian city.
2.1. Study area
The study area comprises a significant part of the urban area of São Carlos, which is a medium-sized city located in the state of São Paulo, Brazil (), and it is part of a more comprehensive research initiative. For this reason, it is nearly the same area selected by Lara and Rodrigues da Silva (Citation2019) to approach community severance caused by another transport infrastructure, a railway.
Figure 1. Location of the state of São Paulo in Brazil (a) and of the city of São Carlos in the state of São Paulo (b). São Carlos subdivisions into weighting areas (c) and census tracts (d)
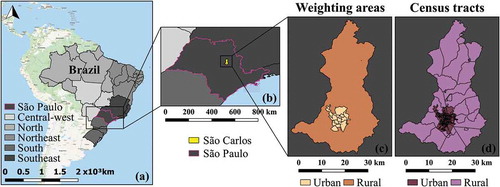
The population considered for this study comprised 213,010 inhabitants (IBGE Citation2010) spread over 83.5 km2, 295 census tracts, and 13 weighting areas. Weighting areas correspond to geographical partitions formed by a mutually exclusive group of areas that follow technical restrictions concerning contiguity and size defined by the Brazilian Institute of Geography and Statistics (or IBGE, which in Portuguese stands for Instituto Brasileiro de Geografia e Estatística).
Relevant demographic characteristics of the study area are as follows: average monthly nominal income of R$ 1,601.71, 36,000 inhabitants with some level of self-declared disability (13,213 of which with permanent mobility constraints), 108,795 female residents (with an average age of 38.0 years old), and 104,215 male residents (with an average age of 35.8 years old) (IBGE Citation2010).
The urban street network of São Carlos is typically laid out in a grid pattern comprising local streets, collector streets, and arterial streets (primary and secondary). This functional classification of urban roads follows guidelines defined by the National Department of Transport Infrastructure (or DNIT, which in Portuguese stands for Departamento Nacional de Infraestrutura de Transportes) from 2010.
2.2. Databases
The assessment of vertical equity among residents within a determined area of influence was based on the following data from the 2010 Demographic Census: classes of monthly nominal income, groups of permanent mobility constraints, gender, and age. The databases have different levels of aggregation. Income and mobility constraint data are available only for weighting areas, whereas data on gender and age are available at census tract level. In addition, the spatial distribution of the population was based on the statistical grid from the 2010 Demographic Census, which is available online in shapefile format. The statistical grid comprises a system of regular cells, in which cells in urban regions are 200 m × 200 m.
In summary, four 2010 census databases with the spatial distribution of the population were used: conditions of individual mobility, income, gender, and age. In addition to the demographic data, we used the geographic database from the Open Street Map (OSM) to create the urban street network.
2.3. Data analysis procedures
The assessment of community severance was made by measuring and classifying the quality of pedestrian crossings. Afterwards, possible inequities were identified by estimating the number of inhabitants that have specific demographic characteristics in areas nearby streets with different classes of quality. The procedures of the proposed method are summarized in .
Figure 2. Overview of the method. Source: Lara (Citation2019)
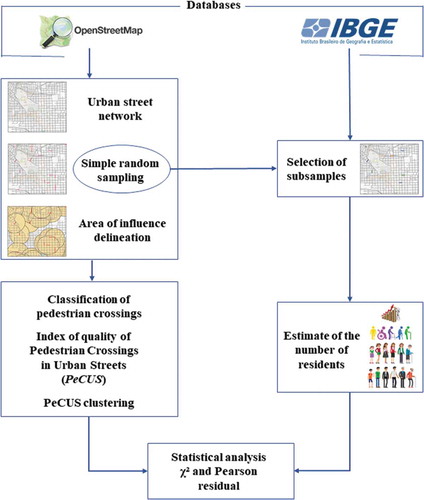
An urban street network map was generated using the Open Street Map (OSM) database and the free software package Quantum GIS v.3.4.4. Unpaved streets, private streets, parking lots, railways, and streams were not included in the map. Then, with the urban street network map containing only public urban streets, a sample of urban streets was selected by simple random sampling, in which the sample size was determined at a 95% confidence level and a 10% margin of error.
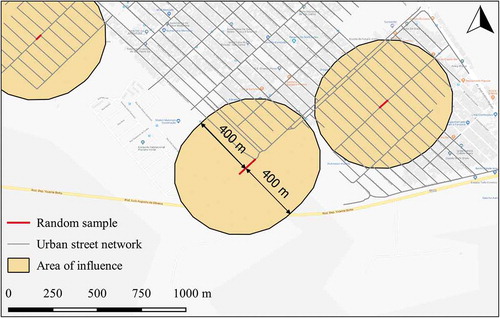
A band of 400 meters was defined as the area of influence of the selected streets (), as suggested by Anciaes et al. (Citation2019). The band area was used for classifying pedestrian crossings on urban streets (e.g. number of crimes, number of inhabitants) and for estimating the demographic characteristics of residents in the streets’ surroundings.
Figure 3. Overview of the method. Source: Lara (Citation2019)
The classification of pedestrian crossings was based on 14 criteria () related to: the geometric design of the streets, available pedestrian infrastructures, population within the selected 400-m band, safety, and maintenance conditions, as well as land use. For each criterion, score values ranging from 0 to 1 were assigned. Score 0 corresponds to the worst mobility conditions for pedestrians and score 1, to the best conditions, as indicated in . The criteria were evaluated by two specialists in the area of urban and transportation planning. Concerning the classification of pedestrian crossings on urban streets, each street was considered as an independent case. Therefore, the overlapping areas of influence did not affect the results obtained.
Table 1. Summary of the criteria assessed for classifying pedestrian crossings on urban streets, as suggested by Lara (Citation2019)
This combination of criteria was defined as the PeCUS (Pedestrian Crossings on Urban Streets) index. As the total sum of scores varies according to the quality of crossings for pedestrians, the PeCUS index also reflects, but inversely, the variation of trip impedances and the access of pedestrians to goods and services (and by extension, the level of community severance).
As indicated in , we performed a cluster analysis to classify objects into groups that are highly internal (within-cluster) homogeneous and highly external (between-cluster) heterogeneous (Hair et al. Citation2010). We used a k-means algorithm to form the clusters. This algorithm divides the data into a user-specified number of clusters and then iteratively reassigns observations to clusters until the distance of observations from one another in a cluster is minimized and the distance between clusters is maximized (Hair et al. Citation2010). Thus, we conducted a cluster analysis to group the PeCUS index results into six classes ranging from A to F. Class A corresponds to the best quality of pedestrian crossings and F corresponds to the worst evaluation. The number of classes was based on the six pedestrian levels of service (LOS) from the Highway Capacity Manual (HCM, Citation2010).
The sampled streets were then classified (from A to F) regarding the quality of pedestrian crossings. Next, we examined the demographic characteristics of the residents in the streets’ surroundings. However, in order to look for evidence of associations between the variables through a chi-square (χ2) test of independence, each unit of the sample must be counted only once, that is, each observed element must be allocated in only one cell of the contingency table. For this reason, overlapping areas of influence must be avoided and a selection of subsamples without overlapping areas of influence became necessary.
Three subsamples were randomly selected from the original sample in such a way that only the segments that have bands that do not overlap with the bands of the segments already chosen were kept in the subsample. The new subsamples were used to estimate the number of residents within non-overlapping 400-m bands regarding the variables of range of monthly nominal income, permanent mobility constraints, gender, and age (using weighting areas and census tracts accordingly).
Finally, in order to accept or reject the null hypothesis of independence between the variables (H0), we used the chi-square (χ2) test of independence in contingency tables built from the variables of the different databases studied. In addition to calculating the chi-square (χ2) value and its corresponding p-value, we computed the standardized Pearson residuals (EquationEquation 1(1)
(1) ), which allows a direct comparison between each cell of the contingency table. Thus, the chi-square (χ2) test of independence was used to assess the evidence of association between the variables, whereas the standardized Pearson residuals were used to better understand the nature and the degree of dependence between the variables.
where SPR corresponds to the standardized Pearson residual, Observed corresponded to the observed counts and Expected corresponded to the expected counts, rowtotal indicates the sum of the observed counts in the row, columntotal indicates the sum of the observed counts in the column, and Total indicates the sum of all observed counts.
A standardized Pearson residual that exceeds about 2 or 3 in the absolute value indicates that the cell greatly contributes to the chi-square (χ2) value and does not fit the H0 (Agresti Citation2018). Larger values are more relevant when the degrees of freedom are larger, and it becomes more likely that at least one is larger simply by chance.
3. Results
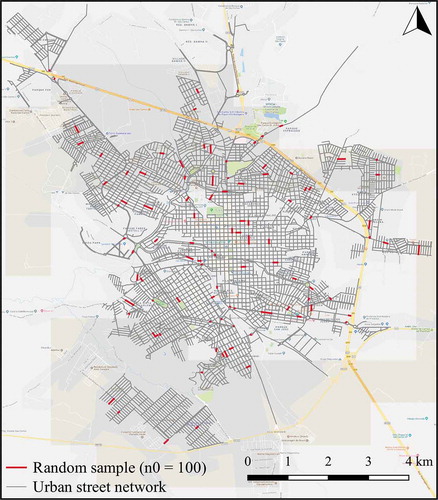
The street network generated using the Open Street Map database comprised 13,329 segments of public urban streets, which are represented in gray in . Based on the resulting map, we selected a sample of segments of urban streets by simple random sampling. The sample size corresponded to n0 = 100 segments of urban streets (at a 95% confidence level and with a 10% margin of error), as highlighted in red in .
Figure 4. Urban street network, in gray, and random sample (n0 = 100 segments), highlighted in red
Thereby, considering the sample of segments of urban streets selected and the area of influence defined as a band of 400 m, the segments were classified. The classification was carried out according to a qualitative assessment of the 14 criteria described in . Next, the sum of all criteria resulted in the PeCUS index value for each segment.
Additionally, we conducted a cluster analysis to group the PeCUS index results into six classes, ranging from A to F, using the k-means clustering algorithm. Class A corresponds to the best quality of pedestrian crossings and F corresponds to the worst evaluation. The F-test correspond to 514.765 with a p-value inferior to 0.050, which indicates a good clustering quality. The number of segments grouped in each class of the PeCUS index is presented in . In addition, contains the results for the highest and lowest PeCUS index per class, as well as their respective scores for each criterion assessed.
Table 2. Number of segments of urban streets assigned per class
Table 3. Results of the highest and lowest values for the PeCUS index and their corresponding scores for each criterion assessed (indicated by the segment’s ID)
In order to estimate the number of residents within the area of influence of 400 m, three subsamples were randomly selected from the original sample (n0 = 100). The subsamples resulted in n1 = 38, n2 = 35, and n3 = 37 segments. This was done to avoid overlapping areas of influence in the sample units. The number of residents within the area of influence was estimated for each subsample, regarding the variables of range of monthly nominal income, permanent mobility constraints, gender, and age.
Using the free software package Quantum Gis v.3.4.4, we calculated the distribution of inhabitants according to the class of the PeCUS index regarding residents’ demographic characteristics, per subsample, as shown in .
Figure 5. Number of residents distributed by class of the PeCUS index, for each subsample and for each variable
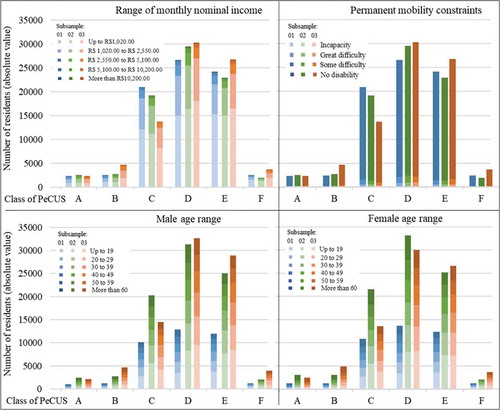
Figure 6. Number of residents by range of monthly nominal income distributed by class of the PeCUS index, for the three subsamples
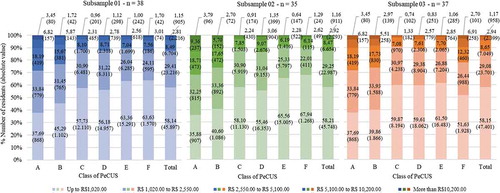
Figure 7. Number of residents by permanent mobility constraints distributed by class of the PeCUS index, for the three subsamples
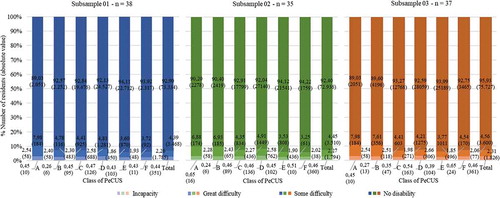
Figure 8. Number of male residents by age distributed by class of the PeCUS index, for the three subsamples
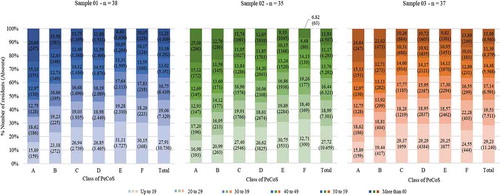
Figure 9. Number of female residents by age distributed by class of the PeCUS index, for the three subsamples
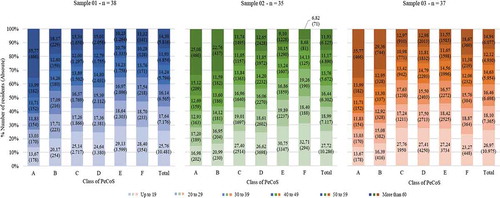
indicates an overview of the distribution of the residents for each variable per class of the PeCUS index and by subsample, in absolute values. provide an overview of the main categories in the classes of the PeCUS index, per variable and per subsample, in percentage values.
indicates that more than half of the residents in classes C, D, E, and F have a monthly income below R$ 1,020.00, whereas the portion of the population with an income greater than R$ 5,100.00 that lives near classes A and B is about twice as large as the portion that lives in classes C, D, E, and F. In , it can be observed that around 11.0% of the population has some level of self-declared permanent mobility constraints. Furthermore, the proportion of residents with some difficulty in walking or climbing stairs without the help of another person is higher among the residents that live near class A. Moreover, most of the population that lives near class A streets are over 60 years old, and this proportion is higher among women (about 1/3) than among men (about 1/4) (as shown in and , respectively). In addition, we can see in and that most residents in class E are aged up to 19.
Regarding the vertical equity in the distribution of residents, it is expected that vulnerable social groups (elderly, young children, physically disabled, and low-income people) would be preferred throughout the best quality classes. However, the results from the exploratory data analysis indicated that low-income residents tend to live nearby the intermediate or poor-quality class and residents aged up to 19 tend to live close to the worst quality class.
The exploratory data analysis of the variables enabled us to describe aspects between the variables and make assumptions about the vertical equity in the distribution of the number of residents according to the distinct classes of the PeCUS index. However, it is not enough to validate the hypothesis of association between the variables or to identify the nature and the degree of dependence between the variables.
Thus, chi-square (χ2) values were calculated for the subsamples by looking at the number of residents observed and expected in each of the classes of the PeCUS index when combined with the classes of monthly nominal income, permanent mobility constraints, gender, and age. All values calculated for the chi-square (χ2) resulted in higher than the critical values of the chi-square (χ2) distribution, considering their respective degrees of freedom, with a p-value less than 0.025. Hence, the null hypothesis (H0) was rejected at a level of significance of less than 0.025. Therefore, a possible association between the variables cannot be ruled out.
Additionally, we calculated the standardized Pearson residuals and found cells of the cross-classification tables with population values higher than expected, indicating excesses of residents with certain demographic characteristics living in the surroundings of specific classes of the PeCUS index. Analogously, we also found cells with less residents than expected, indicating deficits of residents.
presents a summary of the excesses and deficits found for each class of the PeCUS index regarding the variables of income, permanent mobility constraints, gender, and age. It also provides information about the positive (+), negative (–), or unclear (+/–) effect of the excess/deficit to the vertical equity, since the effect varies depending on which social group it is related to.
Table 4. Summary of excesses and deficits for each class of the PeCUS index per variable for the three subsamples
According to , there is a deficit of residents with an income less than R$ 1,020.00 and an excess of residents with an income greater than R$ 5,100.00 living near the best quality classes of the PeCUS index (classes A and B). In addition, there is an excess of people with an income less than R$ 1,020.00 living near the worst quality classes of the PeCUS index (classes E and F). As, in terms of vertical equity, it is expected that low-income residents will be preferably distributed throughout the best quality classes, the distributions mentioned above represent negative effects to the vertical equity. In contrast, the excess of residents with an income range between R$ 1,020.00 and R$ 5,100.00 that live nearby the best classes (A and B) and the deficit of inhabitants from the same income range that live close to one of the worst classes (class E) indicate positive effects to the vertical equity.
Regarding permanent mobility constraints, shows an excess of people with some difficulty and a deficit of people with no disability living near one of the best classes of the PeCUS index (class A), which indicate positive effects to the vertical equity of residents’ distribution. In addition, the deficit of people with great difficulty and some difficulty, and the excess of people with no disability living near one of the worst classes (class E) also indicate positive effects.
Concerning men’s age, points out deficits of men aged up to 19 and between 30 and 39 who live near the best classes of the PeCUS index, and excess of men up to 19 years old who live near one of the worst classes (class E), which represent negative effects to the vertical equity of residents’ distribution. On the other hand, the excess of men aged more than 50 living near the best classes and the deficit of men aged more than 60 living near one of the worst classes (class E) indicate positive effects.
Regarding women’s age, presents deficits of women up to 49 years old who live near one of the best classes (class A) of the PeCUS index and excesses of women up to 29 years old that live around one of the worst classes (class E), which indicates negative effects to the vertical equity. In contrast, excesses of women aged more than 50 who live near the best classes and the deficit of women aged more than 60 living near one of the worst classes (class E) indicates positive effects.
4. Conclusions
This study presented a simple and low-cost analytical approach to assess and classify the quality of Pedestrian Crossings on Urban Streets through an index. The PeCUS index was used to identify variations in the quality of crossings in a random sample (n0 = 100) of urban streets of a medium-sized Brazilian city. Additionally, the approach was used to identify possible inequities in the surroundings of the distinct classification groups. This can be seen as an indirect assessment of community severance.
The analysis of the chi-square (χ2) tests of independence and the standardized Pearson residuals carried out with three subsamples (n1 = 38, n2 = 35, and n3 = 37) suggested an association between the classes of the PeCUS index and the variables of monthly nominal income, permanent mobility constraints, gender, and age. Furthermore, the standardized Pearson residuals were also used to indicate deficits and excesses of residents regarding the demographic characteristics studied surrounding the urban streets. Additionally, it pointed out that the conditions for urban mobility of some population strata may be impaired.
Although the databases used in the study are highly aggregated, which can introduce limitations in the investigation of the population characteristics variability, the research responds to the questions formulated in Section 1. In addition, it indicates that the assessment of community severance by the analysis of the index of quality of Pedestrian Crossings on Urban Streets (the PeCUS index) is feasible. Furthermore, the study shows evidence of an association between the variables. Moreover, it also highlights that the distribution of the number of residents surrounding the distinct classes of the PeCUS index is vertically equitable for vulnerable social groups (e.g. residents with permanent mobility constraints and elderly), except for low-income residents and for male/female residents aged up to 19.
5. Recommendations
Particularly in Brazil, the analysis of the community severance caused by transport infrastructures still requires more detailed studies, which may eventually benefit from the index of quality (the PeCUS index) created and tested here. Moreover, the study can assist the decision-making of transport and urban planners concerning the implementation of new or improved transport infrastructures and crossing facilities on community severance.
We recommend using this study in other medium-sized cities and comparing the results in order to identify patterns regarding the different classes of the index and the demographic characteristics of its surrounding population. In addition, the perception of residents living in the urban street surroundings could be complemented by a questionnaire. It would be interesting to analyze residents’ perceptions to identify suppression of trips by active modes, impacts on social interactions, and impacts on the well-being of the inhabitants, which are also important factors to characterize community severance.
Data availability statement
The data that support the findings of this study are available on request from the corresponding author.
Additional information
Funding
Notes on contributors
Daniela Vanessa Rodriguez Lara
Daniela Vanessa Rodriguez Lara is currently a PhD candidate at the University of São Paulo. Her current research interests are: community severance and resilience of urban transportation systems.
Antônio Nélson Rodrigues da Silva
Antônio Nélson Rodrigues da Silva is a professor in the Dept. of Transportation Engineering at the São Carlos School of Engineering of the University of São Paulo. He received the PhD degree from the University of São Paulo. His current research interests are: the implementation of sustainable mobility strategies, resilience of urban transportation systems, and the challenges of universal accessibility in urban areas and its impacts on mobility and transportation systems of developing countries.
References
- Agresti, A. 2018. An Introduction to Categorical Data Analysis. 3rd ed. Hoboken, NJ: Wiley Series in Probability and Statistics, John Wiley and Sons. https://books.google.com.br/books?id=ukNxDwAAQBAJ
- Anciaes, P. R. 2015. “What Do We Mean by ‘Community Severance’?” 4. Street Mobility and Network Accessibility Series. London, United Kingdom. http://discovery.ucl.ac.uk/1527807
- Anciaes, P. R., S. Boniface, A. Dhanani, J. S. Mindell, and N. Groce. 2016. “Urban Transport and Community Severance: Linking Research and Policy to Link People and Places.” Journal of Transport and Health 3 (3): 268–277. doi:10.1016/j.jth.2016.07.006.
- Anciaes, P. R., P. Jones, and P. J. Metcalfe. 2018. “A Stated Preference Model to Value Reductions in Community Severance Caused by Roads.” Transport Policy 64: 10–19. doi:10.1016/j.tranpol.2018.01.007.
- Anciaes, P. R., J. Stockton, A. Ortegon, and S. Scholes. 2019. “Perceptions of Road Traffic Conditions along with Their Reported Impacts on Walking are Associated with Wellbeing.” Travel Behaviour and Society 15: 88–101. doi:10.1016/j.tbs.2019.01.006.
- Appleyard, D., and M. Lintell. 1972. “The Environmental Quality of City Streets: The Residents’ Viewpoint.” Journal of the American Institute of Planners 38 (2): 84–101. doi:10.1080/01944367208977410.
- Cantillo, V., J. Arellana, and M. Rolong. 2015. “Modelling Pedestrian Crossing Behaviour in Urban Roads: A Latent Variable Approach.” Transportation Research. Part F, Traffic Psychology and Behaviour 32: 56–67. doi:10.1016/j.trf.2015.04.008.
- Davis, A., and L. Jones. 1997. “Whose Neighbourhood? Whose Quality of Life? Developing a New Agenda for Children’s Health in Urban Settings.” Health Education Journal 56 (4): 350–363. doi:10.1177/001789699705600404.
- DNIT. 2010. “Manual de Projeto Geométrico de Travessias Urbanas.” Departamento Nacional de Infraestrutura de Transportes: DNIT, Rio de Janeiro, Brazil. http://ipr.dnit.gov.br/normas-e-manuais/manuais/documentos/740_manual_projetos_geometricos_travessias_urbanas.pdf
- Foley, L., R. Prins, F. Crawford, D. Humphreys, R. Mitchell, S. Sahlqvist, H. Thomson, and D. Ogilvie. 2017. “Effects of Living near an Urban Motorway on the Wellbeing of Local Residents in Deprived Areas: Natural Experimental Study.” PLoS ONE 12 (4): e0174882. doi:10.1371/journal.pone.0174882.
- Guo, X., J. Black, and M. Dunne. 2001. “Crossing Pedestrians and Dynamic Severance on Urban Main Roads.” Road and Transport Research 10 (3): 84–98.
- Hair, J. F., W. C. Black, B. J. Babin, and R. E. Anderson. 2010. Multivariate Data Analysis. 7th ed. Upper Saddle River, N.J.: Prentice Hall.
- Hart, J., and G. Parkhurst. 2011. “Driven to Excess: Impacts of Motor Vehicles on the Quality of Life of Residents of Three Streets in Bristol UK.” World Transport Policy & Practice 17: 12–30. http://eprints.uwe.ac.uk/15513
- HCM. 2010. “Highway Capacity Manual.” Transportation Research Board: TRB, Washington, D.C., USA.
- Hine, J. 1996. “Pedestrian Travel Experiences - Assessing the Impact of Traffic on Behaviour and Perceptions of Safety Using an in-Depth Interview Technique.” Journal of Transport Geography 4 (3): 179–199. doi:10.1016/0966-6923(96)00003-8.
- Hine, J., and J. Russell. 1993. “Traffic Barriers and Pedestrian Crossing Behaviour.” Journal of Transport Geography 1 (4): 230–239. doi:10.1016/0966-6923(93)90047-4.
- IBGE. 2010. “Censo Demográfico 2010.” Instituto Brasileiro de Geografia e Estatística: IBGE, Rio de Janeiro, Brazil. https://sidra.ibge.gov.br/pesquisa/censo-demografico/demografico-2010/inicial
- Lara, D. V. R. 2019. “Community Severance and Vertical Equity Assessment with Spatially Aggregated Data.” M.Sc. Dissertation, University of São Paulo. doi:10.11606/D.18.2020.tde-17012020-175219.
- Lara, D. V. R., and A. N. Rodrigues da Silva. 2019. “Equity Issues Associated with Transport Barriers in a Brazilian Medium-Sized City.” Journal of Transport and Health 14: 100582. doi:10.1016/j.jth.2019.100582.
- Litman, T. 2002. “Evaluating Transportation Equity: Guidance for Incorporating Distributional Impacts in Transportation Planning.” World Transport Policy & Practice 8 (2): 50–65. www.vtpi.org/equity.pdf
- Mackett, R. L., and R. Thoreau. 2015. “Transport, Social Exclusion and Health.” Journal of Transport and Health 2 (4): 610–617. doi:10.1016/j.jth.2015.07.006.
- Mindell, J. S., P. R. Anciaes, A. Dhanani, J. Stockton, P. Jones, M. Haklay, N. Groce, S. Scholes, and L. Vaughan. 2017. “Using Triangulation to Assess a Suite of Tools to Measure Community Severance.” Journal of Transport Geography 60: 119–129. doi:10.1016/j.jtrangeo.2017.02.013.
- Mouette, D., and J. Waisman. 2004. “Proposta de uma Metodologia de Avaliação do Efeito Barreira.” Revista Dos Transportes Públicos ANTP 26 (2º Trimestre): 33–54.
- Nimegeer, A., H. Thomson, L. Foley, S. Hilton, F. Crawford, and D. Ogilvie. 2018. “Experiences of Connectivity and Severance in the Wake of a New Motorway: Implications for Health and Well-Being.” Social Science & Medicine 197: 78–86. doi:10.1016/j.socscimed.2017.11.049.
- Rajé, F. 2004. “Engineering Social Exclusion? Poor Transport Links and Severance.” In Proceedings of the Institution of Civil Engineers 157: 267–273. doi:10.1680/muen.2004.157.4.267.
- Scholes, S., S. Boniface, J. Stockton, and J. S. Mindell. 2016. “Developing a Questionnaire to Assess Community Severance, Walkability, and Wellbeing: Results from the Street Mobility Project in London.” 5. Street Mobility and Network Accessibility Series. London, United Kingdom. http://discovery.ucl.ac.uk/1474883/
- Sisiopiku, V. P., and D. Akin. 2003. “Pedestrian Behaviors at and Perceptions Towards Various Pedestrian Facilities: An Examination Based on Observation and Survey Data.” Transportation Research. Part F, Traffic Psychology and Behaviour 6 (4): 249–274. doi:10.1016/j.trf.2003.06.001.
- Soguel, N. C. 1995. “Costing the Traffic Barrier Effect: A Contingent Valuation Survey.” Environmental & Resource Economics 6 (3): 301–308. doi:10.1007/BF00705983.
- Statistical data of crimes and deaths of the state of São Paulo (from 2010 to 2017). “Secretaria de Segurança Pública de São Paulo - SSP/SP.” Accessed 6 September 2018. https://www.ssp.sp.gov.br/Estatistica/Pesquisa.aspx
- Taylor, J., and R. Crawford. 2009. “Prioritising Road-Rail Level Crossings for Grade Separation Using a Multi-Criteria Approach.” In 32nd Australasian Transport Research Forum (ATRF), 15. Auckland, New Zealand. http://atrf.info/papers/2009/2009_Taylor_Crawford.pdf
- Timperio, A., K. Ball, J. Salmon, R. Roberts, B. Giles-Corti, D. Simmons, L. A. Baur, and D. Crawford. 2006. “Personal, Family, Social, and Environmental Correlates of Active Commuting to School.” American Journal of Preventive Medicine 30 (1): 45–51. doi:10.1016/j.amepre.2005.08.047.