
ABSTRACT
This study analyzed weekday shopping behavior from a home base to a destination using data from the 4th Keihanshin metropolitan area person trip survey. We first analyzed the relationships between occupation and transportation means, transportation means and travel time, and transportation means and duration of time at the destination. Results of a chi-square test, residual analysis, and correspondence analysis confirmed that employed persons tend to travel by cars while unemployed persons tend to travel by bus or walk. The relationship between travel time and duration of time at the destination was also revealed according to transportation means. Results of a cluster analysis then classified shopping behaviors to expose four patterns. Finally, multiple regression analyzed the degree to which certain variables were related to duration of time at the destination. Results confirmed a strong relationship between duration of time at the destination and travel time. The degree of this factor’s influence on other variables was also clarified. The value of these findings is that the relationship between travel time by means of transportation and the duration of time at the destination was clarified using statistical analysis. We then found a highly accurate equation that estimates the duration of time at a destination from the travel time. If the duration of time at a destination can be estimated, it may be possible to more accurately develop the structure of rest facilities, the number of parking lots, the degree of congestion, and so on, which can be associated with the customer’s usage behavior in a shopping site. This research in this paper contributes to the field of urban analysis and marketing by presenting a new effective method for person trip survey and analysis.
1. Introduction
The person trip (PT) survey was conducted on a large scale in the Hiroshima metropolitan area in 1967. It has since been administered to a great extent in various parts of Japan. The PT survey is typically used to examine the “movement of people.” It is also one of the most fundamental ways to investigate traffic situations. The PT survey enables researchers to obtain detailed traffic data (or trip data) over the course of one day including information on origins, destinations, traffic behaviors, travel purposes, transportation means, and time zones in which the actions are completed. Population declines in regional cities currently receive more attention than do those in larger cities; in these areas, it is becoming difficult to maintain the facilities and public transport methods necessary for urban life. There is also the problem of “weak shoppers.” That is, some individuals are placed in situations where daily shopping opportunities are not sufficiently provided due to issues with distributive functions against the backdrop of a declining birth rate, growing older population, and a weakened transportation network. Some argue that the weak shopper issue is leading to deteriorating health conditions while increasing medical and nursing expenses. These problems are now occurring in depopulated areas (e.g., rural and mountainous locales) but are also predicted to manifest in urban areas.
Several previous studies have examined shopping behaviors using survey data by researchers or the PT survey analysis method. For instance, Shiino et al. (Citation2000) interviewed older persons in districts with high aging rates in Matsudo City, Chiba Prefecture, Japan, about their leisure time and outing behaviors. Results revealed that a declining quality of life for at-home older adults could be avoided by preventing their withdrawal from society. It is thus necessary to establish public activity spaces less than 1 km from these homes. This is because many of older adults travel by walking rather than using cars. Results also indicated that it was better for relatives to live within walking distance to avoid reducing leisure outing behaviors for older adults. Ding, Kondo, and Watanabe (Citation2009) indicated the importance of capturing consumer awareness and behavior when shopping. This is because urban functions are becoming increasingly suburbanized while central urban areas are hollowing out in many local cities. They conducted questionnaires in Tokushima Prefecture, Japan, to gain an understanding of the shopping consciousness and behavioral characteristics of both older adults and the general population. The data were then analyzed to determine the relationship between actual travel distance and satisfactory distance. Results confirmed that older shoppers traveled longer distances on foot and that satisfactory distances were longer than actual travel distances regardless of age or other factors. On the other hand, satisfactory travel distance by automobile was shorter than actual travel distance, also regardless of age. Yoshimi, Yamada, and Kishimoto (Citation2015) conducted a questionnaire survey in Koriyama City, Fukushima Prefecture, Japan, which has a high automobile penetration rate. The survey was designed to investigate the characteristics of local shopping behaviors, including differences in the business conditions, user attributes, and mail order sales. Results indicated that dispersed shopping sites resulted in a lack of people gathering at the center. Store management thus worsened as the area lost local appeal. Here, there was a high level of dependence on automobiles. Thus, shopping behaviors were determined by age, private car ownership, and road networks. Kaneko and Tanaka (Citation2015) investigated how the older population experienced public transportation through a survey connecting their methods of going out in the Tokyo metropolitan area (where the aging population is progressing at a remarkable rate) with public transport use and personal attributes. Results showed that older people most frequently left their homes for shopping and work purposes, that their means of transportation primarily involved car travel and walking, and that public trains were used more frequently than buses.
Regarding research based on the PT survey, Lim, Hirobata, and Kim (Citation2004) asserted the importance of understanding trends based on traffic analyses and the aging population to establish a transportation system corresponding to changing traffic behaviors. They determined this by analyzing information from four PT surveys on the structural and factorial compositions of secular changes in traffic conditions in Toyohashi city, Aichi prefecture, Japan. Results indicated that the ratio at which transportation was shared was greatly affected through changes in departure and arrival locations. The concentration rate according to zone was also greatly affected by the changing destination selections in each district. Enomoto, Nakamura, and Okamura (Citation2008) stated that the increasing presence of large commercial facilities in suburban areas would raise vehicle dependence, compromise existing shopping districts, and decrease shopping opportunities for those unable to drive. These circumstances would also decrease the number of opportunities for individuals to travel throughout society. They also analyzed the degree to which public transportation to large shopping centers impacted shopping behaviors in rural metropolitan areas using the Niigata metropolitan area PT survey. Results indicated that automobile use did not decline when private cars were available, regardless of destination. The use of and dependence on automobiles for shopping purposes was therefore very strong in local urban areas in the study location. The researchers thus insisted that municipalities take measures to reduce travel distances by automobile. Maekawa and Kurauchi (Citation2011) stated that it was necessary to understand shopping behaviors at the individual level because central urban areas were receiving less visitors due to a declining central status accompanied by an increase in suburban large-scale commercial facilities. They constructed a destination selection model by calculating area attractiveness using a Matsuyama metropolitan area personal investigation survey in Ehime prefecture, Japan. However, they indicated that it was not possible to sufficiently determine attractiveness for the purpose of distinguishing between central urban areas and suburban large-scale commercial facilities. Ariyoshi (Citation2013) asserted the importance of knowing regional transportation demands because of future difficulties caused by the growing number of nuclear families. This was based on his analysis of in-house transportation behaviors using data retrieved from a PT survey conducted in the northern Kyushu metropolitan area in Japan. Results indicated that transport by private car tended to be higher in nearby and rural areas when compared to urban areas. Private car pickups become more common as the service density of public transportation decreases. Ishikawa, Matsumoto, and Suzuki (Citation2015) investigated changes in urban forms using the results of PT surveys conducted in the Chukyo metropolitan area in Japan from both 2001 and 2011. They analyzed land use characteristics and facility placement to determine which residents were able to travel by foot. Based on their results, they recommended enriching commercial facilities located within 1 km of the residential area. This entailed the consolidation of urban functions centered on commercial activity and connecting those sites with new public transport facilities. As described above, in order to investigate and analyze shopping behavior characteristics, there are methods in which a researcher conducts an independent questionnaire survey and a method in which data from a PT survey are used. The PT survey collects a large amount of data over a wide range. If researchers include the survey data they would like to analyze, it is useful for them to use the data from the PT survey to understand the behavior of people throughout the city.
Some PT survey analyses have already been conducted in the Keihanshin metropolitan area. As indicated in the above section, this includes research on shopping behaviors, the relationships between human attributes, transportation means, travel distances, and destination selection models. The Keihanshin Metropolitan Transportation Planning Council has also conducted its own PT survey to compile information on shopping behaviors. However, the council’s research did not analyze personal attributes such as sex and age or the relationship between transportation means and surveyed behaviors. It is thus necessary to take measurements concerning vulnerable shoppers in an aging society. This makes it important to analyze the relationship between personal attributes and transportation means as well as that between transportation means and shopping behaviors. It is also important to analyze shopping behaviors according to duration of time at the destination. This can provide valuable information for planning future transportation methods and store locations. This study therefore analyzed shopping behaviors according to transportation means in the Keihanshin metropolitan area on weekdays (Monday through Friday) to gain information on local shopping behavior characteristics during those times. The analyzed characteristics include items such as duration of time at the destination, travel time, and transportation means.
2. Survey
2.1. Survey method
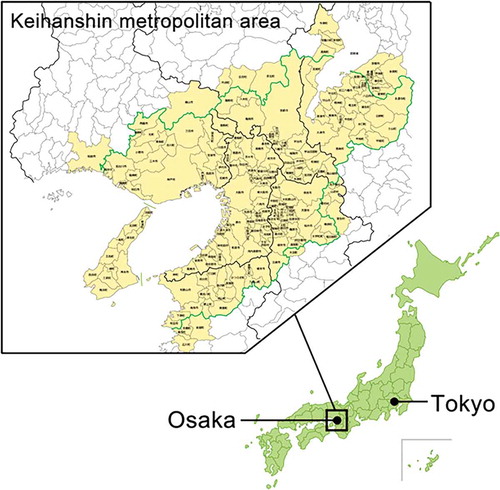
This study examined weekday shopping behaviors using information derived from the 4th (2000) PT survey of the Keihanshin metropolitan area in Japan. The target area included the entire Osaka Prefecture as well as sections of the Shiga, Kyoto, Hyogo, Nara, and Wakayama prefectures (). The PT survey is designed to provide information on the movements of people, including items such as who, when, where, from where, how far, means of transportation, and movement purpose. The 4th PT survey of Keihanshin was used to gain basic material for use in planning transportation methods, roads, and disaster prevention measures. Area PT surveys are conducted at 10-year intervals. The Keihanshin Metropolitan Transportation Planning Council was established by municipalities and related organizations in the Keihanshin metropolitan area. It is thus a research organization designed to conduct studies for the promotion of comprehensive urban transportation planning measures.
Figure 1. Target area. (This map is created based on content from the Keihanshin Metropolitan Transportation Planning Council Citation2019 homepage.)
summarizes the person trip (PT) survey used in this study. Results include weekday behavioral information from 392,673 participants in the Keihanshin area. These data contained 81,323 shopping actions (including stop-by actions). A total of 44,454 people provided information related to their preferred shopping location from home and their shopping behaviors while there. We first created a program designed to extract data from the survey. We then extracted shopping behavior data that did not include stopover actions. The extractable data include the ages, sexes, occupations, transportation means, and departure times of respondents. As such, we were able to calculate travel time, moving distance, and duration of stay at the destination. We excluded stop-by actions via companies or home bases to strictly focus on shopping behaviors. Notably, the 2000 PT survey was conducted a relatively long ago. The situation thus seemed slightly different than current circumstances, which involve more Internet-based shopping. However, we think that shopping behaviors at physical locations seem consistent between 2000 and the present time.
Table 1. The person trip (PT) Survey summary
2.2. Aggregate results
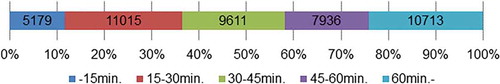
The following figures depict the aggregate results of the survey. shows age demographics (“40 to 60 years of age” and “60 years of age or over” were common answers, while the least number of respondents answered “under 20”). shows respondent answers for sex. Here, women comprised more than 80% of the total. shows occupations (“housewife” was the most frequent answer at approximately 50% of the total, followed by “unemployed” at approximately 25%; “student” was the least common answer at less than 5%). Because answers were collected on weekdays, there was a large proportion of “female” and “housewife” respondents. shows answers for transportation means. Here, “walking” was the most frequent at more than 30%, followed by a significant number of bicyclers. shows departure times in six-hour categories (“12 pm–6 pm” was the most frequent answer, followed by “6 am–12 pm”). The fewest number (less than 1%) of respondents answered “12 am–6 am.” shows travel time in five-minute intervals (“10 min or more” and “less than 15 min” were the most frequent answers at about 30% each, followed by “about 5 min or more” and “less than 10 min” at about 25%). On the other hand, the fewest number of respondents answered “15 min or more” and “less than 20 min.” shows travel distance. Here, “less than 1 km” was the most frequent answer (approximately 30%), followed by “1–2 km.” The least number of respondents answered “2–3 km.” shows duration of time at the destination in 15 min intervals (“15 min or more” and “less than 30 min” were the most frequent answers, followed by “more than one hour”). The least number of respondents answered “less than 15 min” (approximately 10%). Overall shopping behavior trends confirmed the following: Housewives over 40 and unemployed women tended to walk or travel on bicycles; these individuals traveled less than 3 km on average for less than 15 min during the daytime and shopped for less than 1 hour. In terms of occupation, respondents were employed in professional, technical, administrative, vocational, clerical, sales, personnel services, service industry, security, agriculture, forestry, fishery, transportation, communication, skilled, production process, and other settings. Students in the sample included children of junior high school age or below and high school age or above.
Figure 2. Aggregate results for age (n = 44,454)
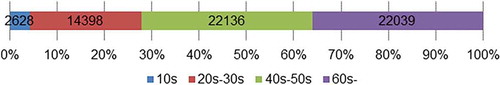
Figure 3. Aggregate results for sex (n = 44,454)
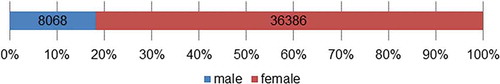
Figure 4. Aggregate results for occupations (n = 44,454)
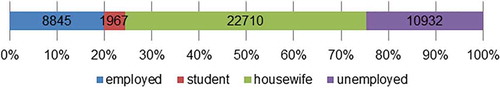
Figure 5. Aggregate results for transportation means (n = 61,201, multiple answers)
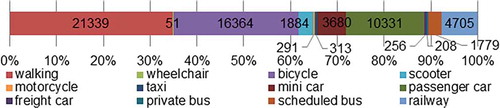
Figure 6. Departure time from home in six-hour categories (n = 44,454)
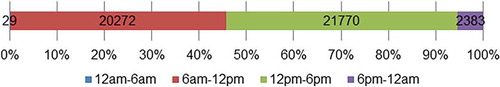
Figure 7. Travel time in five-minute intervals (n = 44,454)
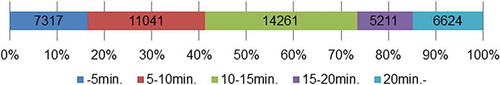
Figure 8. Travel distance in 1 km intervals (n = 44,454)
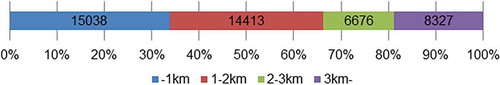
Figure 9. Duration of time at the destination in 15 min intervals (n = 44,454)
3. Analysis
3.1. Analysis method
Transportation means were classified into 12 methods. However, few answers were given for certain methods, so some answers were combined to form one category. For instance, scooter and motorcycle were combined into motorcycle, and minicar and passenger car were combined into car. Thus, means of transportation were finally divided into seven methods: walking, bicycle, motorcycle, private car, route bus, railway, and other (including taxis). Other transportation means were excluded from further analysis because of too few responses. All other categories were analyzed as they are shown in their respective figures.
A chi-square test, residual analysis, correspondence analysis, cluster analysis, and multiple regression analysis were conducted. The correspondence analysis was first conducted to analyze the relationships between age, gender, occupation, departure time, travel time, duration of time at the destination, and transportation means. The cluster analysis was then conducted to determine shopping behavior patterns. Here, departure time, travel time, and duration of time at the destination were used as independent variables. Finally, the multiple regression analysis was conducted using age, sex, occupation, transportation means, departure time, and travel time as independent variables, while duration of time at the destination was used as a dependent variable. The multiple regression analysis enabled examination of how the independent variables were related to duration of time at the destination. Travel time and duration of time at the destination were also converted into logarithms. Thus, the change rate (elasticity) of duration of time at the destination was obtained in relation to movement time. Departure time, gender, age, occupation, and transportation means were then converted into dummy variables. A linear relationship between the independent and dependent variables was not evident. We thus created a logarithm for further analysis. Chi-square test, residual analysis, correspondence analysis, and cluster analysis are the analyses used to understand and classify the trends among the variables. The multiple regression analysis is an analysis of inferring shopping behavior in the present state and shopping behavior in the future by using each variable, and each analysis complements the other.
3.2. Visualizations of personal attributes and shopping behavior characteristics
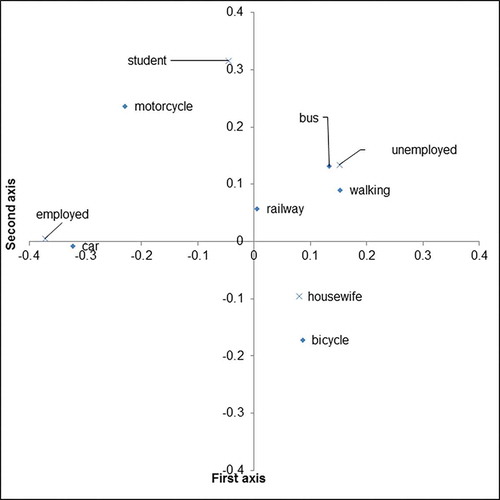
We analyzed the relationship between the transportation means used when shopping and shopping behavior characteristics. A chi-square test, residual analysis, and correspondence analysis were conducted to visualize this relationship. The following significant results were obtained. First, shows the results of the chi-square test and residual analysis on occupation and transportation means. shows the results of a correspondence analysis conducted using occupation and transportation means. The cumulative contribution rate was 83% on the first axis and 94% on the second (). The significance probability between columns was 5% or less for axes 1 and 2. The significant difference of the axis group was 5% or less when there were two or fewer axes. This indicated sufficient reliability. shows a visual diagram of the correspondence analysis involving occupation and transportation means. Employed respondents tended to travel to their shopping destinations using private cars, while housewives tended to use bicycles. On the other hand, unemployed respondents tended to go shopping on foot or by bus.
Table 2. Results of the chi-square test and residual analysis involving occupation and transportation means (p < 0.001)
Table 3. Results of the correspondence analysis involving occupation and transportation means
Figure 10. Visual diagram of the correspondence analysis involving occupation and transportation means
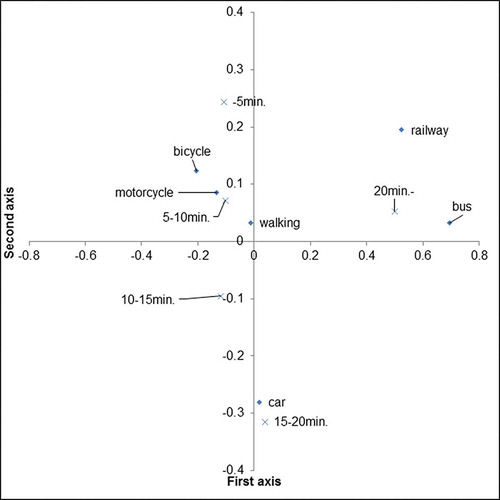
shows the results of the chi-square test and residual analysis on travel time and transportation means. shows the results of the correspondence analysis on travel time and transportation means. The cumulative contribution rate was 75% on the first axis and 97% on the second, while significance probability between columns was 5% or less for axes 1 and 2. The significant difference of the axis group was 5% or less when there were two or fewer axes. This indicates sufficient reliability. shows a visual diagram of the correspondence analysis involving travel time and transportation means. Travel time tended to be less than 10 min for respondents who reached the shopping location by walking or bicycle, while those using private cars tended to travel 15–20 min. Travel by bus or railway tended to be 20 min or more.
Table 4. Results of the chi-square test and residual analysis involving travel time and transportation means (p < 0.001)
Table 5. Result of the correspondence analysis involving travel time and transportation means
Figure 11. Visual diagram of the correspondence analysis involving travel time and transportation means
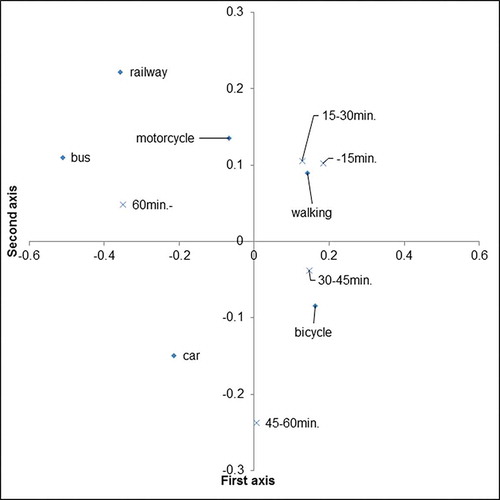
shows the results of the chi-square test and residual analysis on duration of time at the destination and transportation means. shows the results of correspondence analysis on duration of time at the destination and transportation means. The cumulative contribution rate was 86% on the first axis and 97% on the second axis, while significance probability between columns was 5% or less for axes 1 and 2. The significant difference of the axis group was 5% or less when there were two or fewer axes. This indicates sufficient reliability. shows a visual diagram of the correspondence analysis involving duration of time at the destination and transportation means. The duration of time at the destination for people reaching the shopping location by walking tended to be less than 30 min, while those on bicycles tended to stay for 30–45 min, and those using a car, bus, or railway tended to stay for 60 min or more; the significance probability between columns was 5% or less for axes 1 and 2. The significant difference of the axis group was 5% or less when there were two or fewer axes. This indicates sufficient reliability.
Table 6. Results of the chi-square test and residual analysis involving duration of time at the destination and transportation means (p < 0.001)
Table 7. Results of the correspondence analysis involving duration of time at the destination and transportation means
Figure 12. Visual diagram of the correspondence analysis involving duration of time at the destination and transportation means
3.3. Shopping behavior classifications
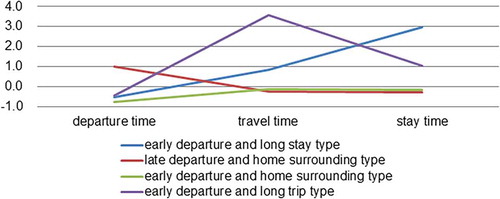
A cluster analysis was conducted to discover shopping behavior patterns. and show the results of the related cluster analysis. A total of four clusters were created through a nonhierarchical cluster analysis. All independent variables were p < 0.001. Cluster 1 was characterized by early departure times and long travel times and durations of time at the destination. It was thus labeled the “early departure and long stay type.” Cluster 2 was characterized by late departure times and short travel times and durations of stay at the destination. Individuals in this group seemed to shop at locations near their homes. This cluster was thus labeled the “late departure and home surrounding type.” Cluster 3 was characterized by early departure times and short travel times and durations of time at the destination. These individuals also seemed to shop near their homes. This cluster was labeled the “early departure and home surrounding type.” Finally, Cluster 4 was characterized by early departure times and long travel times. Individuals in this group traveled longer distances to shop. This cluster was therefore labeled the “early departure and long trip type.” The “early departure and long trip type” featured longer travel times than the “early departure and long stay type” but was characterized by shorter durations of time at the destination. On the other hand, individuals with short travel times and durations of time at the destination fit into the “late departure and home surrounding type” and “early departure and home surrounding type” clusters. These individuals mainly shopped to purchase daily necessities at locations hear their homes.
Table 8. Cluster center results and number of cases for each cluster
Figure 13. Plot results of the cluster analysis
3.4. Relationship between duration of time at the destination and shopping behavior characteristics
A multiple regression analysis was conducted to analyze the relationships between age, sex, occupation, transportation means, departure time, travel time, and duration of time at the destination. shows the results (the dependent variable was a logarithm of duration of time at the destination while the independent variable was the log of travel time). The non-standardization factor (B) indicates that duration of time at the destination increases by 1.5% when travel time increases by 1%. shows the results of a multiple regression analysis with the dependent variable set as the logarithm of duration of time at the destination and the independent variable as a log of travel time, age, sex, occupation, transportation means, and departure time. This analysis revealed that travel time was the most relevant factor for duration of time at the destination. We were also able to determine the extent to which other variables influenced duration of time at the destination.
Table 9. Results of the multiple regression analysis using the logarithm of duration of time at the destination as the dependent variable and travel time log as the independent variable (R2 = 0.915)
Table 10. Results of the multiple regression analysis using the logarithm of duration of time at the destination as the dependent variable and several independent variables (R2 = 0.955)
4. Conclusions
This study analyzed shopping behaviors on weekdays in the Keihanshin metropolitan area to determine shopping behavior characteristics. We especially focused on duration of time at the destination but also analyzed other characteristics of shopping behavior, including travel time and transportation means. We first confirmed the characteristics of departure time, transportation means, travel time, travel distance, and duration of time at the destination through a data aggregation process. Of note, most departure times were between 6 am and 12 pm and 12 pm and 6 pm. We also found that many shoppers traveled by walking, on bicycles, or in passenger cars. Many of the respondents indicated that their one-way travel times were either 5–10 min or 10–15 min, while distances were most often less than 1 km or between 1 and 2 km. Many respondents indicated that their durations of time at the destination were between 15 and 30 min, 30–45 min, and 1 h or more. We conducted a chi-square test, residual analysis, and correspondence analysis to analyze the relationships between occupation and transportation means, transportation means and travel time, and transportation means and duration of time at the destination. Unemployed persons tended to reach their shopping destinations by bus. We, therefore, think it is desirable to establish bus routes in areas where many unemployed people reside. Additionally, those who reached their shopping destinations on foot or by motorbike tended to travel between 5 and 10 min. It is thus desirable to arrange roads near shops that are close to residential areas. Bicycle parking areas and roads that accommodate motorbikes are also necessary.
We then clarified shopping behavior patterns through a cluster analysis. These patterns were classified into four types (i.e., “early departure and long stay type,” “late departure and home surrounding type,” “early departure and home surrounding type,” and “early departure and long trip type”). Results indicated that store planning should consider accommodations for shoppers with long durations of time at the destination, especially for those who will receive many individuals of the “early departure and long stay type.” It is also desirable to establish parking lots and public transportation networks near stores expecting visitors of the “early departure and long trip type.” Finally, we conducted a multiple regression analysis to determine the extent to which departure time, sex, age, occupation, transportation means, and travel time affected duration of time at the destination. For the relationship between travel time and duration of time at the destination, stay times rose by about 1.5% when travel times increased by 1%. This indicates that visitors can be expected to travel long distances to shops where they wish to stay for longer periods of time. It can also be inferred that consumption increases for shoppers with long durations of time at the destination. Information concerning duration of time at the destination is useful for store planning efforts in surrounding commercial areas. Further, the behavioral characteristics derived from this analysis should be useful for planning future city transport.
The value of this paper’s findings is that the tendency of the relation with the travel time by the means of transportation and the duration of time at the destination was clarified using statistical analysis. We also found a highly accurate equation that estimates the duration of time at the destination from the travel time. For example, if a store were to conduct a questionnaire survey on the residence area and travel time of the customer, it would be possible to estimate the duration of time at the destination in the store regarding shopping behavior. If the duration of time at the destination can be estimated, it may be possible to develop rest facilities, the number of parking lots, the degree of congestion, and so on that consider customers’ usage behaviors in the shopping site. This paper contributes to the field of urban analysis and marketing by presenting a new effective method for PT survey and analysis.
Acknowledgments
This study was supported by Joint Research Program No.690 at Center for Spatial Information Science (CSIS), The University of Tokyo. We would like to thank Editage (www.editage.com) for English language editing.
Data availability statement
The data that support the findings of this study are available from Center for Spatial Information Science (CSIS), www.csis.u-tokyo.ac.jp/english/. The University of Tokyo, but restrictions apply to the availability of these data, which were used under license for the current study, and so are not publicly available. Data are however available from the authors upon reasonable request and with permission of CSIS.
Additional information
Funding
Notes on contributors
Takashi Yamada
Takashi Yamada is a lecturer in the Department of Human Factors Engineering and Environmental Design, Kindai University, Japan. He received a Ph.D. from Keio University, Japan. His research covers human behavior modeling, simulation, and space design analysis in buildings or urban spaces.
Takumi Hayashida
Takumi Hayashida received his B.E. from Kindai University. His research interests include spatial data analysis and shopping behavior.
References
- Ariyoshi, R. 2013. “Analysis on Drop-off/pick-up Transport by Household Members Based on Person-trip Survey Data.” Journal of the City Planning Institute of Japan 48 (3): 165–170. doi:10.11361/journalcpij.48.165.
- Ding, Y., A. Kondo, and K. Watanabe. 2009. “Analysis of Consumer’s Shopping Consciousness and Behavior in Local Urban Area.” Journal of Architecture and Planning 74 (636): 417–422. doi:10.3130/aija.74.417.
- Enomoto, T., F. Nakamura, and T. Okamura. 2008. “A Study on Influence of Public Transportation Introduced for Access to Suburban Large-scale Shopping Complex in Mode Choice for Shopping Trip.” Infrastructure Planning Review 25: 385–394. doi:10.2208/journalip.25.385.
- Ishikawa, Y., Y. Matsumoto, and A. Suzuki. 2015. “Analysis of Urban Form Transition in Walkable City and Automotive City.” Journal of the City Planning Institute of Japan 50 (3): 317–323. doi:10.11361/journalcpij.50.317.
- Kaneko, Y., and A. Tanaka. 2015. “Survey on Travel Behavior Characteristics of Elderly Persons in Tokyo Metropolitan Area.” JSTE Journal of Traffic Engineering 1 (2): A_47–A_53. doi:10.14954/jste.1.2_A_47.
- Keihanshin Metropolitan Transportation Planning Council. 2019. Outline of Person-Lip Survey. Accessed February 7 2019. http://www.kkr.mlit.go.jp/plan/pt/research_pt/h12/p1.html
- Lim, I. V., Y. Hirobata, and K. Kim. 2004. “A Study on the Serial Changes of Travel Behavior on Week- and Weekend Days in A Local City.” Infrastructure Planning Review 21: 589–596. doi:10.2208/journalip.21.589.
- Maekawa, T., and S. Kurauchi. 2011. “Classification of Weekday Shopping Behavior and Its Destination Choice Analysis Based on Matsuyama PT Survey Data.” Journal of Japan Society of Civil Engineers, Ser. D3 (Infrastructure Planning and Management) 67 (5): I_749–I_757. doi:10.2208/jscejipm.67.67_I_749.
- Shiino, A., O. Nakahara, I. Kinoshita, and Y. Saitoh. 2000. “A Study on Spacial Characteristics of Free Time Outing Activities of People in Advanced Age.” Journal of the City Planning Institute of Japan 35: 829–834. doi:10.11361/journalcpij.35.829.
- Yoshimi, M., T. Yamada, and T. Kishimoto. 2015. “Characteristics of the Behavior to Visit Shopping Sites in the Local Cities – Actual Condition Analysis Based on the Web Questionnaire Survey in the Koriyama-city Region Area.” Journal of the City Planning Institute of Japan 50 (3): 1316–1323. doi:10.11361/journalcpij.50.1316.