
ABSTRACT
Metro is an important form of public transport in Shanghai. Based on the metro card data, we conduct the cluster analysis of Shanghai metro stations according to the pattern of passenger flow changing with time. Then the characteristics of travel time and surrounding land use are investigated for different types of stations to explore the relationship between urban land-use characteristics and travel activities reflected by passenger flow at metro stations. It is found that the passenger flow pattern of metro stations is closely related to the location conditions of stations and its surrounding land-use patterns. Based on various characteristics, 285 metro stations are classified into four types, including residential-oriented stations, employment-oriented stations, employment-residence-oriented stations, and integrated functional-oriented stations, reflecting the interaction between spontaneous travel behavior and urban land-use characteristics and providing a reference for optimizing the urban functional structure and the spatial allocation of facilities.
1. Introduction
Metro is one of the important measures to make rational use of limited urban land resources and solve traffic congestion in big cities (Zhao Citation2017; Huang et al. Citation2018). According to Shanghai Comprehensive Transport Operation Annual Report 2016, the average daily passengers traffic volume of Shanghai Metro accounts for 51% of the total urban passengers traffic volume, which is 4.5% higher than that of 2015, and the proportion of rail transit in residents’ travel is increasing day by day. To a large extent, residents’ travel behavior reflects the current situation and evolution of urban space, and the characteristics of urban spatial structure (Zhou and Yan Citation2006; Aslam, Cheng, and Cheshire Citation2019). Moreover, the urban spatial structure could reflect the relationship among the elements of the urban physical environment, functional activities, and cultural values (Dadhich and Hanaoka Citation2012; Zhou and Ye Citation2013). Therefore, the coordination between land use and transportation system is of great significance to urban planning and comprehensive transportation planning (Roukouni, Basbas, and Kokkalis Citation2012; Zhou, Liu, and Wang Citation2018; Zhao et al. Citation2019). The construction of metro transportation can improve the accessibility of land around the stations, changing the location conditions and built environment. Therefore, metro transportation can affect the urban spatial pattern and also affect people’s travel habits. Conversely, the location of the station and the function of the surrounding land will also affect the passenger flow pattern of each station (Jun et al. Citation2015). Accordingly, it is of great significance to analyze the characteristics of the passenger flow pattern and the land use around the stations as well as to explore the relationship between different elements.
There are many studies on metro travel up to now. A large number of scholars use travel spatial-temporal data for spatial clustering, which is an important method of data analysis. By analyzing the intrinsic trend and distribution law of spatial data, the patterns and rules of the research objects can be summarized and classified. For example, cluster analysis could be made according to the time series characteristics of passenger flow (Leng and Zhao Citation2014), and be used to explore the correlation between the peak and trough of passenger flow of metro stations and the density of land around the stations (Ma et al. Citation2017). Besides, Principal component analysis (PCA) and Gauss mixed model (GMM) were also used to conduct cluster analysis of the stations based on metro card data, showing the mixed characteristics of some stations intuitively (Yue et al. Citation2017; Liu, Singleton and Arribas-Bel Citation2019).
On the basis of clustering analysis, the spatial and temporal characteristics of travel behavior and the spatial characteristics of the station location can be further studied. For instance, after using the metro card data for cluster analysis, types of land use around the metro station could be identified and the impact of different land-use types around the station on residents’ travel demand could be illustrated (Cao et al. Citation2016; Crosby et al. Citation2018). Besides, by using the bus card data for cluster analysis, the city’s functional areas could be identified according to residents’ daily travel characteristics and interest point distribution (Han, Yu, and Long Citation2016). What’s more, the coordination between urban rail transit and land use was also studied by using the Node-Place model and LISA cluster (Zhou, Liu, and Wang Citation2018).
Also, the spatial and temporal characteristics of traffic travel data provide the possibility for scholars to study the spatial and temporal characteristics of travel behavior as well. For example, based on taxi trajectory data, bus and metro card data, residents’ travel patterns could be discovered through the statistics of the volume and proportion of different vehicles used by residents in different regions and the space-time spectral clustering method based on adjacency relation (Yue Citation2017). Besides, the spatial and temporal distribution characteristics of passenger flow in the metro station could be obtained by using the OD matrix through SQL Sever based on metro card data (Huang et al. Citation2018; Ren et al. Citation2019. Moreover, metro card data could also be used to identify urban occupational-residential space and commuting pattern by using the travel-chain data model and establishing commuting recognition rules (Xu, Ta, and Li Citation2017).
As we know, there are plenty of studies on clustering and exploring the characteristics of the travel behavior of metro stations. But few of them used spontaneous passenger flow pattern to classify stations, nor to explore the relationship between passenger flow pattern and land use around stations. Based on multisource data, this paper makes cluster analysis of metro stations according to the pattern of passenger flow changing with time, and then investigates the characteristics of travel time and surrounding land use for different types of stations to explore residents’ travel demand and urban spatial form.
2. Data and methods
2.1. Data for research
This study is mainly based on the data of the Shanghai metro cardFootnote1 for a week in 2016. Considering the object and purpose of this study, five fields of information related to metro traffic mode are reserved:
User ID: traffic card ID, which is uniquely identifiable;
Travel date: the date when the card is used;
Travel time: the specific time when the card is used;
Station name: the station at which the traveler is in or out of the station;
Deduction fee: the number 0 means inbound, more than 0 means outbound and costs the corresponding numerical value of the transportation fee.
The valid data of Metro travel in this study are 5,776,896 user IDs and 53,638,792 metro card data. Land-use status dataFootnote2 is also used in this paper to study land-use characteristics around metro stations. This data are supposed to reflect the land-use status of Shanghai in 2014. However, considering the slow change of urban land use, the data of 2014 can be used in this study.
2.2. Technical route
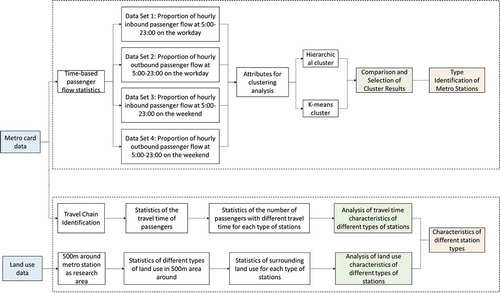
This study uses the data of the metro card to make cluster analysis according to the pattern of passenger flow of the metro stations changing with time. After identifying the metro trip chain based on metro card data, we first explore the travel time characteristics associated with each type of station. Then, based on land-use status data, the land-use characteristics around each type of station are explored. Finally, the interactive relationship between the travel mode of different metro stations and their nearby land use is researched ().
Figure 1. Technical route
3. Metro station clustering based on flow characteristics
Based on one-week travel data of Shanghai metro card, the daily inbound and outbound passenger flows of each station are counted at an hour interval. And considering the differences in the opening and closing time of each station, this study selects data from 5:00 to 23:00, during which most of the stations are open. In order to study the time-varying pattern of passenger flow of each station, rather than using its actual passenger flow, we use the proportion of the hourly incoming or outgoing passenger flow of each station to its total incoming or outgoing passenger flow on that day as a comparative indicator. It is found that the pattern of passenger flow changing with the time of each station on five working days is similar, and so is the pattern of two weekend days. Therefore, in statistics, we can use the 5-day average of working days to represent the changing level during working days, and the 2-day average of weekends to represent that of weekends.
We use four variables of each station to make cluster analysis in SPSS, which include the proportion of the hourly inbound passenger flow to the whole day from 5:00 to 23:00 on weekdays, the proportion of outbound passenger flow to the whole day from 5:00 to 23:00 on weekdays, the proportion of inbound passenger flow to the whole day from 5:00 to 23:00 on weekends, and the proportion of outbound passenger flow to the whole day from 5:00 to 23:00 on weekends. The number of clusters is classified into 3–10 categories, and the clustering results are obtained by using two methods, which are hierarchical clustering and K-means clustering. Thereafter, the results of different clustering methods and different categories were compared, and the significance of flow change characteristics was studied. Finally, a suitable and significant result which was obtained by using the K-means method was selected. And the stations were divided into four clusters.
3.1. Spatial distribution of various stations
The result of the metro station classification was spatially visualized in GIS. Generally, the stations of Type 1 are mainly located outside the Middle Ring Line, the stations of Type 2 and of Type 3 are mainly located inside the metro Line 4, which is within Shanghai Inner Ring Line, almost covering the central city of Shanghai, and the stations of Type 4 are mainly located out of the metro Line 4 ().
Figure 2. Spatial distribution of various stations
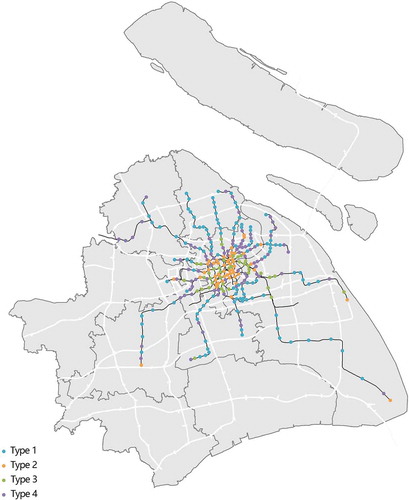
Specifically, the stations of Type 1 are mainly located in the suburban area of each metro line. The stations of Type 2 are relatively more concentrated, basically concentrated inside the core area of the metro Line 4. Among Type 2, a few metro stations are outside Line 4 but still very close to it, while the remaining Songjiang South Station, Pudong International Airport station and Dishui Lake station are the three terminal stations of metro lines. The stations of Type 3 are a bit scattered compared with Type 2. The stations outside metro Line 4 are mainly concentrated in Caohejing, Zhangjiang, Luoshan Road, Yunjin Road, Zhenbei Road, and other areas. The stations of Type 4 are mainly located outside Line 4 but within the Outer Ring Road, mostly concentrated in the Siping Road area, Yangzhong Road area, Yanggao South Road area, Longcao area, Longbaixincun area, Caoyang Road area and Zhongshan North Road area, etc.
3.2. Time-dependent passenger flow distribution of four types of stations
3.2.1. Time-dependent passenger flow distribution of stations of type 1
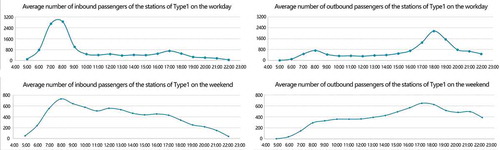
As can be seen from , during the workday, the stations of Type 1 have an obvious inbound peak in the morning and outbound peak in the evening. While during the weekend, the inbound passenger flow decreases with time from about 8:00 a.m. and the outbound passenger flow increases with time from 8:00 a.m. to 17:00 p.m.
Figure 3. Average inbound and outbound passenger flow on the workday and weekend of type 1 stations
3.2.2. Time-dependent Passenger flow distribution of stations of type2
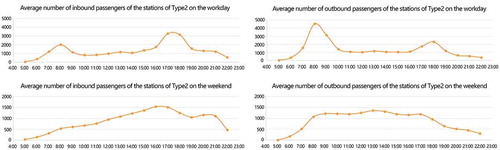
For the stations of Type 2 (), during the workday, there are obvious outbound peak in the morning and inbound peak in the evening. And the outbound peak in the morning is more prominent. On the weekend, during the day time, the outbound passenger flow is relatively large, and its distribution is more balanced, while in the evening and at night the inbound passenger flow raises.
Figure 4. Average inbound and outbound passenger flow on the workday and weekend of type 2 stations
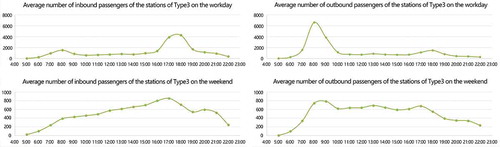
3.2.3. Time-dependent passenger flow distribution of stations of type3
For the stations of Type 3 (), during the workday, there are obvious outbound peak in the morning and inbound peak in the evening. And the outbound peak is more significant. On the weekends, the day-time passenger flow increases slightly with time. The distribution of outbound passenger flow at most stations is more balanced with time.
Figure 5. Average inbound and outbound passenger flow on the workday and weekend of type 3 stations
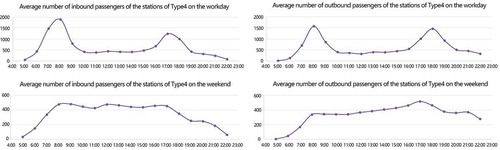
3.2.4. Time-dependent passenger flow distribution of stations of type4
For the stations of Type 4 (), during the workday, the peaks of inbound and outbound passenger flow are both obvious in the morning and evening, and there is no obvious difference between those peaks. During the weekend, the distribution of inbound and outbound passenger flow of most stations is more balanced with time.
Figure 6. Average inbound and outbound passenger flow on the workday and weekend of type 4 stations
3.2.5. Summary of time-dependent passenger flow distribution of four types of stations
There are great differences in the time-varying patterns of passenger flow of the four types obtained by clustering (). Statistical analysis of passenger flow of those stations shows that the tidal characteristics of travel behavior are very obvious on the weekdays, with the passenger flow in the morning and in the evening occupying a large proportion. On the weekend, the distribution of passenger flow is relatively balanced, and the actual travel volume is relatively low ().
Figure 7. Average proportion of inbound and outbound passenger flow on working and weekend days of four types of stations
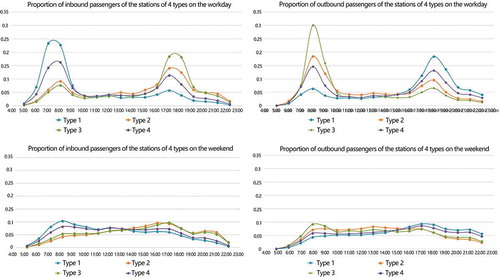
Table 1. Summary of the characteristics of inbound and outbound passenger flow on weekday and weekend of four types of stations
4. Analysis on travel behavior and surrounding land-use characteristics of four types of stations
4.1. Travel time characteristics associated with various stations
A complete trip chain includes inbound and outbound information, and the inbound information is recorded earlier than the outbound one. By using the above rule and the uniqueness of user ID, the trip chains of all users in one week were firstly identified, including 26,819,396 trip chains corresponding to 5,776,896 user IDs.
Then travel time is divided into seven categories at intervals of 20 min, i.e. 0–20 min, 20–40 min, 100–120 min, and more than 120 min. Statistically, the number of passengers traveling for different times at each station is counted. Then, the average proportion of passengers traveling for different times at different types of stations is calculated, and at last the characteristics of travel time at different types of stations are analyzed ().
Figure 8. Daily average number and proportion of passengers with different travel time
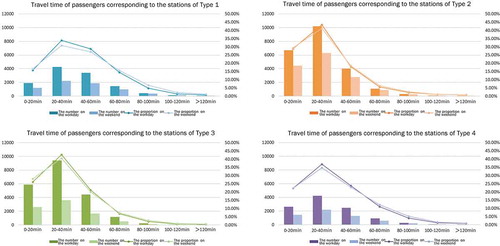
Overall, the travel times of the metro trip are mostly within 40 min. Compared with the workday, on weekend the ratio of passengers traveling for 20–40 min decreases, while the ratio of passengers traveling for more than 60 min increases. It means that the ratio of long-distance travels on weekends increases while that of short-distance travels decreases.
Comparing the travel characteristics of different types of stations on workday and weekend, it could be found that each type of station is dominated by short-distance and mid-distance travel (20–40 min), while the proportion of long-distance travel (more than 60 min) is relatively small. In addition, the number of travels corresponding to the stations of Type 2 and Type 3 is relatively large, and travels that are less than 40 min take a relatively high proportion. For Type 1 and Type 4, the proportion of travels less than 40 min is relatively low, and accordingly, the proportion of long-distance travels is relatively higher, especially for Type 1. Combining with the spatial distribution of stations, Type 2 and Type 3 are much closer to the city center, having obvious advantages in traffic location, and the ratio of short-distance travel is relatively large. While Type 1 and Type 4 are mostly distributed in the suburbs and the ratio of long-distance travel is significantly higher than the other two types. The appearance of more long-distance travels could be caused by two situations. The first is that the services near this metro station attract more residents from other areas through long-distance travel. The second is that the services of other faraway areas attract residents of this station for long-distance travel. Considering the characteristics of passenger flow changing with time and traffic location, for Type1 and Type 4, the second situation is much closer to reality. This shows that the built-up environment or service facilities near these two types of stations cannot meet residents’ needs, so the residents carry out long-distance travels to the city center seeking for satisfying services.
4.2. Surrounding land-use characteristics of four types of stations
Based on the land-use status map of Shanghai in 2014, the land-use situation within 500 m around the stations were extracted, and later the land-use characteristics around different types of the stations were analyzed ().
Figure 9. Proportions of different types of land use in the 500 m range around different types of stations
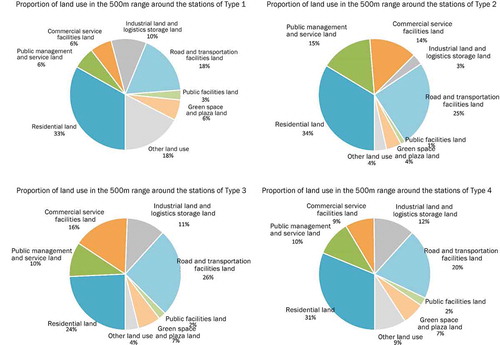
Figure 10. Z-score values of different types of land-use areas within 500 m around different types of stations
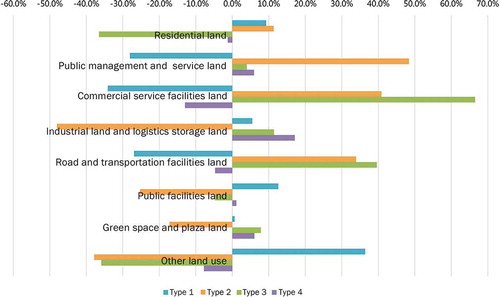
From the comparison of the proportion of land-use area within 500 m around various stations, it can be seen that the land use around different types of stations is quite different. Furthermore, Z-score standardized values of each type of station were calculated and compared. Z-score is obtained by subtracting the average from the value and dividing by the standard deviation. In statistics, Z-score is often used to reflect the relative position of values in the overall distribution. Combining the proportion of different land-use types and Z-score, we explore the characteristics of land use around the stations.
In the figure of the Z-score standardized value (), the difference of land use around different stations is more obvious. The proportion of residential land around the stations of Type 1 is relatively high. But the land used to provide public services and commercial services is relatively scarce. The proportion of residential land and the land used to provide public services and commercial services around stations of Type 2 are relatively high in all types of stations. The land used to provide services around stations of Type 3 is abundant, but residential land is relatively scarce. The proportion of the land used to provide services around stations of Type 4 occupies a relatively medium position in the four categories.
4.3. Summary of the characteristics of various stations
From the characteristics of travel behavior reflected by the passenger flow and the characteristics of land use and facilities around the stations, we can summarize the functional orientation of metro stations. The four types of stations contain residential-oriented stations, employment-oriented stations, employment-residence-oriented stations, and integrated functional-oriented stations ().
Table 2. Summary of classification characteristics of Shanghai metro stations
Residential oriented and employment-oriented stations have an uneven commuting tidal flow, while integrated functional-oriented stations and employment-residence-oriented stations have more balanced passenger flow. The classification of metro stations reflects a clear correspondence between the spontaneous travel behavior and the functional structure of the city.
5. Summary and discussion
In this study, the passenger flow pattern of metro stations is studied based on the data of the Shanghai metro card, and thereafter the clustering of the stations is carried out. After identifying the metro trip chain, the characteristics of travel time associated with each type of station is explored. Furthermore, based on land-use data, this paper explores the land-use characteristics around each type of stations, and searches the relationship between travel pattern and land-use characteristics.
Based on the passenger flow pattern and land-use characteristics of various stations, 285 metro stations in Shanghai can be classified into four types, namely residential-oriented stations, employment-oriented stations, employment-residence-oriented stations, and integrated functional-oriented stations. Different types of metro stations have obvious differences in distribution. The integrated functional-oriented stations and employment-oriented stations are mainly concentrated in the central area, while the residential-oriented stations and employment-residence-oriented stations are mainly distributed in the suburb. The residential-oriented type is more widely distributed in Jiading District, Songjiang District, Baoshan District, and other areas on the periphery of the city center. The location of the station and the land-use types around the metro stations have an important impact on the passengers’ travel behavior. The identification of the stations’ type is helpful to further understand the different functional zones of the city and the travel behavior characteristics of the residents. It is of great significance to understand the activity demand of the citizen and the spatial pattern of the city, providing references for making adjustment of the urban functional structure and optimization of the facilities.
In this study, different types of data were used for comprehensive analysis, and a comprehensive conclusion was obtained. However, there are still some deficiencies in this study. For example, the research used the land-use data which was measured in 2014 for lack of data of 2016. Although in the case of slow land-use change, the data of 2014 can also reflect the situation of land use, it would be better to use land-use data of 2016, which is in the same period as metro card data. In the future, more diversified data and research methods can be introduced to make the research more comprehensive and scientific. For example, travel behavior can be further studied when combined with other big data like mobile signaling data and the social attributes of passenger flow can be determined by using a questionnaire survey.
Disclosure statement
No potential conflict of interest was reported by the author(s).
Data availability statement
The data that support the findings of this study are available on reasonable request from the corresponding author.
Additional information
Notes on contributors
Ping Shen
Ping Shen is an assistant planner in Guangzhou Urban Planning & Design Survey Research Institute. She received her master degree from College of Architecture and Urban Planning, Tongji University. Her research interests include regional planning, spatial quantitative analysis and urban renewal.
Linxin Ouyang
Linxin Ouyang is an assistant planner in Shanghai Tongji Urban Planning & Design Institute Co., Ltd. She received her master degree from the College of Architecture and Urban Planning, Tongji University. Her research interests include spatial-temporal behavior and big data applications within urban planning.
Chong Wang
Chong Wang is an assistant planner in Tongji Architectural Design (Group) Co., Ltd. She received her Master degree from the College of Architecture and Urban Planning, Tongji University. Her research interests include urban traffic issues, urban underground space and urban planning.
Yin Shi
Yin Shi is an assistant planner in the Shanghai Urban Planning and Design Research Institute. She received her master degree from the College of Architecture and Urban Planning, Tongji University. Her research interests include historic preservation, urban renewal and urban planning.
Yiheng Su
Yiheng Su is an assistant planner in Guangzhou Urban Planning & Design Survey Research Institute. She received her master degree from the College of Architecture and Urban Planning, Tongji University. Her research interests include urban design and urban renewal.
Notes
1. The data of metro card is provided by the Intelligent Urbanization Collaborative Innovation Centre.
2. In the data source, industrial land and logistics warehouse land are merged into one category, so this study classifies the two types of land into “industrial land and logistics warehouse land” for statistics. Other land uses include rural residential land, agricultural and forestry land, cultivated land, water area, special land, and other nonconstruction land.
References
- Aslam, N. S., T. Cheng, and J. Cheshire. 2019. “A High-precision Heuristic Model to Detect Home and Work Locations from Smart Card Data.” Geo-spatial Information Science 22 (1): 1–11. doi:10.1080/10095020.2018.1545884.
- Cao, R., W. Tu, B. Chao, N. Luo, M. Zhou, and Q. Li. 2016. “Identification and Analysis of Home and Work Regions in the Vicinity of Metro Stations Using Smart Card Data.” Journal of Geomatics 41 (3): 74–78. (in Chinese).
- Crosby, H., T. Damoulas, A. Caton, P. Davis, J. P. de Albuquerque, and S. A. Jarvis. 2018. “Road Distance and Travel Time for an Improved House Price Kriging Predictor.” Geo-spatial Information Science 21 (3): 185–194. doi:10.1080/10095020.2018.1503775.
- Dadhich, P. N., and S. Hanaoka. 2012. “Spatial Investigation of the Temporal Urban Form to Assess Impact on Transit Services and Public Transportation Access.” Geo-spatial Information Science 15 (3): 187–197. doi:10.1080/10095020.2012.715955.
- Han, H., X. Yu, and Y. Long. 2016. “Identifying Urban Functional Zones Using Bus Smart Card Data and Points of Interest in Beijing.” City Planning Review 40 (6): 52–60. (in Chinese).
- Huang, J., J. Wang, H. Jin, and F. Jin. 2018. “Investigating Spatiotemporal Patterns of Passenger Flows in the Beijing Metro System from Smart Card Data.” Progress in Geography 37 (3): 397–406. (in Chinese).
- Jun, M. J., K. Choi, J. E. Jeong, K. H. Kwon, and H. J. Kim. 2015. “Land Use Characteristics of Subway Catchment Areas and Their Influence on Subway Ridership in Seoul.” Journal of Transport Geography 48: 30–40. doi:10.1016/j.jtrangeo.2015.08.002.
- Leng, B., and W. Zhao. 2014. “Region Ridership Characteristic Clustering Using Passenger Flow Data.” Journal of Computer Research and Development 51 (12): 2653–2662. (in Chinese).
- Liu, Y., A. Singleton, and D. Arribas-Bel. 2019. “A Principal Component Analysis (PCA)-based Framework for Automated Variable Selection in Geodemographic Classification.” Geo-spatial Information Science 22 (4): 251–264. doi:10.1080/10095020.2019.1621549.
- Ma, X., J. Zhang, J. Liu, J. Wang, and J. Li. 2017. “Relationship between Characteristics of Subway Passenger Flow and Land Use.” Urban Rapid Rail Transit 30 (6): 33–38. (in Chinese).
- Ren, M., Y. Lin, M. Jin, Z. Duan, and Y. Liu. 2019. “Examining the Effect of Land-use Function Complementarity on Intra-urban Spatial Interactions Using Metro Smart Card Records.” Transportation 47: 1607–1629. doi:10.1007/s11116-019-09977-7.
- Roukouni, A., S. Basbas, and A. Kokkalis. 2012. “Impacts of a Metro Station to the Land Use and Transport System: The Thessaloniki Metro Case.” Procedia Social & Behavioral Sciences 48: 1155–1163. doi:10.1016/j.sbspro.2012.06.1091.
- Xu, Y., N. Ta, and X. Li. 2017. “Analysis of Commuting Behavior and Employment Center Using Subway Smart Card Data.” Human Geography 32 (3): 93–101. (in Chinese).
- Yue, M. 2017. “Spatio-temporal Clustering and Resident Trip Mode Analysis on Multi-source Trajectory Data.” (in Chinese) Master Diss., Wuhan: Wuhan University.
- Yue, Z., F. Chen, Z. Wang, J. Huang, and B. Wang. 2017. “Classifications of Metro Stations by Clustering Smart Card Data Using the Gaussian Mixture Model.” Urban Rapid Rail Transit 30 (2): 48–51. (in Chinese).
- Zhao, J. 2017. “Spatio-temporal Travel Pattern Mining and Dynamic Passenger Flow Analysis in Urban Rail Transit System.” (in Chinese) PhD Diss., Beijing: University of Chinese Academy of Sciences.
- Zhao, J., J.O. Wallgrün, P.C. LaFemina, J. Normandeau, and A. Klippel. 2019. “Harnessing the Power of Immersive Virtual Reality – Visualization and Analysis of 3D Earth Science Data Sets.” Geo-spatial Information Science 22 (4): 237–250. doi:10.1080/10095020.2019.1621544.
- Zhou, C., and C. Ye. 2013. “Progress on Studies of Urban Spatial Structure in China.” Progress in Geography 32 (7): 1030–1038. (in Chinese).
- Zhou, Q., S. Liu, and Y. Wang. 2018. “A Study on the Coordinative Relation of Land Use and Transport around the Metro Station.” Railway Transport and Economy 40 (4): 100–106. (in Chinese).
- Zhou, S., and X. Yan. 2006. “The Impact of Commuters’ Travel Pattern on Urban Structure: A Case Study in Some Typical Communities in Guangzhou.” Acta Geographica Sinica 61 (2): 179–189. (in Chinese).