
 ?Mathematical formulae have been encoded as MathML and are displayed in this HTML version using MathJax in order to improve their display. Uncheck the box to turn MathJax off. This feature requires Javascript. Click on a formula to zoom.
ABSTRACT
When arranging the pedestrian infrastructure, one of the most important components that make a tangible contribution to the safety of pedestrians is to organize the safe road crossing. In cities, pedestrians often cross a road in the wrong place due to established routes or inadequate location of crosswalks. Accidents with the participation of pedestrians who crossed the road neglecting the traffic rules, make up a significant part of the total amount of road accidents. In this paper, we propose a method that allows us, on the basis of the results of a computer simulation of pedestrian traffic, to obtain predicted routes for road crossing and to indicate optimal locations for crosswalks that take into account established pedestrian routes and increase their safety. The work describes an extension for the existing AntRoadPlanner simulation algorithm, which searches for and clusters points where pedestrians cross the roadway and suggests locations for new crosswalks. This method was tested on the basis of a comparative simulation of several territories before and after its application, as well as on the basis of a field study of the territories. The developed algorithm can also be used to search for other potentially dangerous places for pedestrians on plans of districts, for example, crossings in places with limited visibility.
1. Introduction
A pedestrian is one of the main users of the city space. According to the development strategies of many smart cities, a pedestrian is a priority participant in road traffic when organizing the urban environment, while pedestrian infrastructure development is part of the concept of smart mobility (Sanseverino, Sanseverino, and Vaccaro Citation2017). The presence of a convenient pedestrian infrastructure is relevant for the entire population of the city, since people most often walk the last part of their city routes (Kumar Citation2015). For this reason, the safety and comfort of pedestrians are of high importance.
Despite this, pedestrians still constitute one of the largest risk groups in road accidents. According to US statistics (National Center for Statistics and Analysis Citation2017), in 2015, 15% of people who died in road accidents were pedestrians, 72% of whom were involved in road accidents between intersections, and 18% – at the very intersections. Similar statistics are available for 2016 (National Center for Statistics and Analysis Citation2018): 16% of all those killed in road accidents were pedestrians, 72% of the pedestrians died in areas between intersections, 18% of pedestrian deaths occurred at intersections. In total, about 10% of all those killed in road accidents were pedestrians who were hit outside a crosswalk located at the intersection.
The situation in Russia is similar. According to traffic police statistics from the official website (The State Traffic Inspectorate Citation2019), in 2015, 31% of all road accidents were pedestrian knockdowns, of which only 35% were at crosswalks. In 2016, pedestrian knockdowns accounted for 30% of all road accidents, of which 36% were at crosswalks. In 2017, pedestrian knockdowns accounted for 31% of all road accidents, of which 38% took place at crosswalks. As a result, on average, about 20% of road accidents with pedestrians happen outside crosswalks.
Both in scientific literature and in recommendations on pedestrian infrastructure arrangement it is said that it is common for pedestrians to shorten their way and take the shortest route, which often explains offenses in the form of crossing in the wrong place (Mudron and Pachta Citation2013; National Center for Statistics and Analysis Citation2008). Romm (Citation2006) pointed out a psychological mechanism explaining the tendencies in the appearance of trampled paths. This mechanism is as follows: a person shortens his/her route if the angle between his/her direction of movement and the straight line leading to the goal is more than 30 degrees.
In view of this, it is possible to identify a separate direction in studying pedestrian safety: the problem of pedestrians crossing the road in the wrong place. Ignoring this problem and its erroneous solutions lead to numerous road accidents and make a significant contribution to the number of victims among the participants of accidents outside vehicles.
It should be noted that for new areas it is important to plan and create an optimal pedestrian infrastructure at the design stage, since solving this problem in established areas is quite difficult. Adding new crosswalks requires adapting and modifying the existing elements of the infrastructure, creating additional pedestrian paths within the existing pedestrian network. Changes in the implemented infrastructure may affect the traffic patterns.
The media often mentioned situations when local residents are forced to fight for the creation of crosswalks in already formed areas (Cole Citation2018; Snider Citation2018; KITV Citation2018; The Blade Citation2018). Such cases illustrate the difficulty of correcting problematic areas where potential traffic routes and needs of pedestrians were not taken into account.
The article proposes a method for determining the optimal location of crosswalks based on multi-agent modeling. This method makes it possible to predict the most popular pedestrian routes to cross roads, including crossings in the wrong place and mid-block crossings. Thus, when designing a new district or street, it is already possible to detect places potentially dangerous for pedestrians and to design crosswalks in such places in advance or to apply other measures to protect pedestrians.
2. Related work
Currently there are many methods of studying and improving the safety of pedestrian infrastructure. Most often they are based on studying statistics of road accidents, measuring constructive and objective data, for example pedestrian flow intensity, expert evaluation and questioning. Apart from that, methods of mathematical modeling are applied, some of which will be analyzed below. In addition, to ensure greater safety of pedestrians when designing territories, methodical recommendations are used, the purpose of which is to assist in the optimal organization of pedestrian infrastructure. Such recommendations often contain tips on location of crosswalks that would be the most comfortable and safe for pedestrians (Broek Citation2014; Irish Government, Dept. Transport, Tourism & Sport Citation2013; Vanderslice Citation1998).
Research is also aimed at innovation and the development of existing technologies and systems used in pedestrian infrastructure. Previous studies on this topic modeled the interaction between pedestrians and vehicles using various approaches. For example, Lawniczak, Di Stefano, and Ernst (Citation2015) used a probabilistic model and self-learning agents; Daganzo and Knoop (Citation2016) used queuing theory to calculate delays for drivers and pedestrians depending on the number and location of crosswalks. In addition, pedestrians can be considered as independent agents and their influence on each other or some aspects of human psychology can be studied. For example, Ye et al. (Citation2017) investigated the influence of pedestrian group sizes on pedestrians’ behavior when crossing the road; and according to Yang et al. (Citation2006), the behavior of a pedestrian depends on his/her personal characteristics (pedestrians are divided into law-abiding and opportunistic). Part of the works mentioned above considered road crossing as a simple fact, but there are works that focus on calculating the exact crossing trajectory. For example, in the work (Zeng et al. Citation2014), the trajectory was calculated based on a social force acting on the pedestrian and depending on the location of crosswalks, destination, other pedestrians, and cars.
8There are models based on studies of specific places and intersections or traffic regulations of individual regions. In the work (Feliciani et al. Citation2017; Gorrini et al. Citation2018), a model of an uncontrolled crosswalk based on a real crosswalk in Milan is described. Its main feature is the consideration of different types of pedestrians, which vary in the speed of movement and reaction. Noyce and Lu (Citation2009) dealt with various systems of light signals at US traffic lights and suggest using fuzzy logic to optimize the waiting time at mid-block crosswalks.
The works mentioned above consider how to organize traffic within a single crosswalk or section of a street. However, they did not answer the practical question which architects and designers often raise: Where exactly should crosswalks be placed when designing an entire street or block? All the models considered study the question “how does the pedestrian cross the street”, but they did not state or analyze the questions “why does the pedestrian cross the street” and “why exactly here and not a hundred meters further”.
In real life, these questions are crucial. The places where people cross streets depend on the attraction points. These points can be located deep inside building clusters, far from the roadway, and cannot be analyzed by small-scale models.
Only after a specific location for a crosswalk is selected, it is possible (if necessary) to apply existing models, and optimize the traffic at this crosswalk. Therefore, to solve the practical task of designing urban areas, a model of a higher level is needed. Such a model should not focus on the interaction between pedestrians and vehicles at a particular point, but rather on the movement of pedestrians throughout the entire district. It should cover areas of several square kilometers. Such a model and its application for crosswalk design will be further described in this work.
3. Proposed methodology
3.1. Computer simulation used
In this section, the existing computer simulation method called AntRoadPlanner, which forms the basis of the algorithm for predicting natural crossing points for pedestrians, is described.
3.1.1. Problem of desire paths
The method proposed in the article is based on the development of extensions for the pedestrian traffic simulation algorithm AntRoadPlanner (Kudinov et al. Citation2018).
Initially, AntRoadPlanner was developed to solve the problem of desire paths. When designing new neighborhoods and parks, architects and designers usually do not pay enough attention to the convenience of pedestrians and do not elaborate the motion direction of pedestrian flows. The result is the emergence of desire paths: pedestrians pave their own road network through lawns and flower beds. Such errors could have been detected at the design stage, simulating the movement of pedestrian flows on the map of the area. This is exactly what the initial version of AntRoadPlanner does. It is an algorithm for multi-agent modeling based on the A* algorithm with additional heuristics that take into account peculiarities of pedestrian behavior (Romm Citation2006; Helbing, Keltsch, and Molnar Citation1997). Some of these peculiarities are further described in this work.
Based on the algorithm, a web service (Smirnov and Gurevich Citation2017) was developed to allow processing one’s yard or park project and finding pedestrian infrastructure design errors.
3.1.2. Description of AntRoadPlanner
AntRoadPlanner uses a marked vector map of the territory as the input data. There are various obstacles (buildings, water bodies, freeways), pedestrian paths and pedestrian attraction points, such as house entrances, shops, public transport stops, etc.
The algorithm is designed to handle fairly large projects: entire parks or areas of several square kilometers. That is, the areas for which manual calculation of pedestrian flows is too difficult and labor-intensive (for example, one man-week of work for one quarter is mentioned in (Romm Citation2006), which leads to numerous errors in the organization of pedestrian infrastructure on the streets of our cities.
Before starting the simulation, the program builds a navigation graph based on a vector map. The graph looks like a hexagonal grid, which improves the accuracy of the routes to be built (Nitzsche Citation2013). Nodes of the graph are connected unless impassable obstacles separate them.
The weights of the graph edges, which determine their attractiveness for pedestrians, consist of two components:
The constant weight component depends on the type of surface: paved paths have the lowest weight, while obstacles, hedges, fences and dense vegetation have the greatest weight.
A variable component called trampledness. It is available only for those types of surface the attractiveness of which varies depending on the number of pedestrians passing there, i.e. for lawns, flower beds, etc. Trampledness is subtracted from the weight of the edge. Initially, it is zero, and pedestrians passing along the edge increase it, thereby reducing the overall weight of the edge, increasing its attractiveness and imitating the formation of a desire path.
At each step of the simulation, a number of pedestrian agents are generated, who begin their journey along the area from the initial attraction point to a randomly chosen end point, for example, from their home to a shop. At the same time, pedestrians walking across lawns change the weights of the edges of the lawn and make it more attractive to other pedestrians. The appearance of a desire path in one place affects the routes of pedestrians nearby, leading to the emergence of new paths and the disappearance of old ones. This continues until the road and path network stabilizes.
The basic idea of the algorithm is quite simple, but we had to add a number of heuristics and improvements to it in order to obtain a plausible simulation of the behavior of pedestrians. One of the main ideas is the so-called “rule of 30 degrees” which was discovered by Romm (Citation2006). It states that pedestrians prefer to go straight across the lawn as soon as the angle between the direction of the path and the desired direction to the goal exceeds 30–40 degrees. A similar value of the reference angle, 35.964° with a standard deviation of 5.787°, was confirmed by a study of 100 territories in St. Petersburg (Malyshev Citation2018). In order to implement such a behavioral pattern, the weights of the graph edges for different types of territories (lawns, paths) are selected in the algorithm with this rule in mind.
There are other rules in addition to the basic one. For instance, all pedestrians in the simulation are divided into “decent” (who prefer taking a paved path) and “indecent” ones (who prefer straight routes over the lawns). The simulation takes into account the process of overgrowing of trampled paths. At each step, the trampledness of all the edges is reduced by a small fixed amount. If pedestrians stop walking along the path, for example, because a new, more comfortable path emerged aside, then the old path gradually becomes overgrown and disappears.
3.1.3. An Example of operation of the initial algorithm
As a result of its work, the simulation generates a series of images in which agent routes and trampled paths are marked.
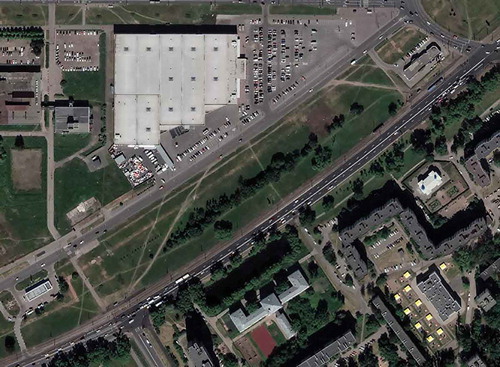
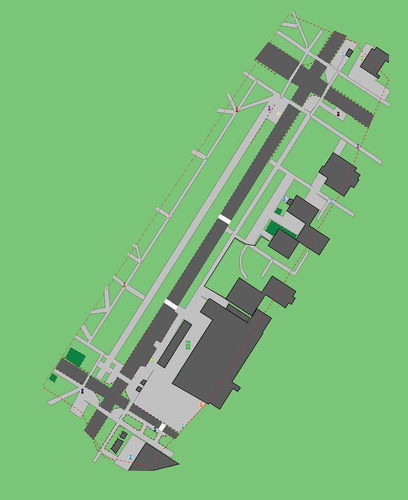
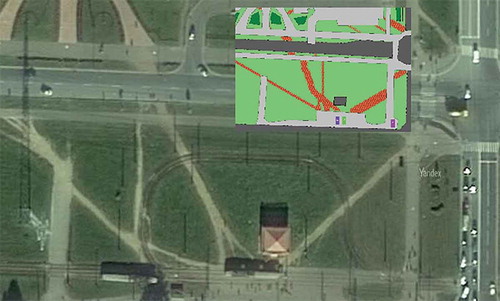
The work of the simulation based on a map of one of the districts in St. Petersburg, Russia, can be used as an example. The limited marked area includes a hypermarket, two almost straight road sections and a green area between them. The image of trampled paths obtained after processing the area can be seen in , the paths are marked with red lines. For comparison, shows satellite shots of the territory, the images are taken from Google Maps. The simulation parameters were refined using empirical research, and the result of the program was compared with existing territories, so the simulation has high accuracy.
Figure 1. The image of trampled paths obtained by the simulation
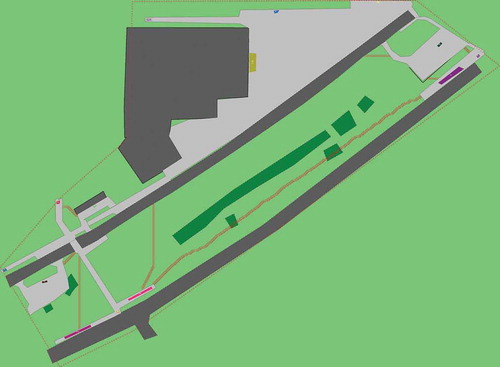
Figure 2. A satellite image of the territory
3.2. Algorithm for detecting cases of pedestrians crossing road in the wrong place
The initial ARP algorithm allows us to get tracks of pedestrians moving within the area, taking into account the peculiarities of human behavior described above. Using these tracks, we can identify places where agents crossed the roadway.
However, the intersection points themselves are not enough to select locations for crosswalks. Points can be distributed over a variety of places along the street, depending on pedestrians’ routes and personal parameters. It is neither possible nor necessary to turn every crossing point into a crosswalk, as it would be too expensive and could contradict urban planning regulations that specify the minimum permissible distance between crosswalks.
To implement a practical algorithm, the AntRoadPlanner simulation data must be further processed: it needs to be converted to a convenient format; the road crossing points must be grouped; the crosswalk location in each group must be selected considering both agent tracks and surrounding objects (e.g. existing pedestrian paths coming close to the carriageway).
The details of this process, which turns a set of tracks into crosswalk locations, are given below.
3.2.1. General idea of the algorithm
An analysis of an urban territory can often have the form of a search for points on a map that meet certain conditions. For example, in the case of searching for dangerous places, these will be the points that belong both to the roadway and to pedestrian routes. It is convenient to search for such points using spatial databases and SQL queries. Object coordinates can be taken from the map of the area, and the data on the pedestrian routes can be obtained from the results of the ARP simulation. At the same time, a pedestrian simulation using the mechanism of desire path formation, is capable of producing much more accurate results than a simple search for ways along the roads existing on the map (Khodnenko, Kudinov, and Smirnov Citation2018).
Thus, to solve the problem of finding the natural crossing points, it is necessary to develop an add-in for the original ARP algorithm, which will save the simulation results in a special format. It will allow us to easily search for points according to given conditions, and will contain a description of these conditions determining possible locations of crossing. Based on the points selected using such an algorithm and additional factors, such as standards and international experience, it is possible to implement an algorithm for choosing specific places for official crosswalks.
3.2.2. Saving simulation results
The first step is to collect the simulation results. For this, it was decided to use the PostGIS database (PostGIS – Spatial and Geographic objects for PostgreSQL Citation2018), which allows SQL queries to be executed using spatial constraints. Territory map data is stored in two tables. All nodes of the navigation graph are entered in the first table in the form of points with their coordinates and the number of pedestrians who passed them. The geometry of obstacles and objects in the area (roads, buildings, etc.) is entered into the other table.
After such data tables are formed for a set of predicted natural crossing points, it is enough to execute a query for nodes of the navigation graph that intersect with “road” type obstacles and have a non-zero number of pedestrians who passed them. An example of visualization of points selected according to such a condition that form the road crossing tracks is shown in .
Figure 3. Road crossing points extracted from simulation results

3.2.3. Road crossing point clustering
The next step after the output of points where agents crossed the road in the wrong place is to combine these points into clusters. The goal of clustering is to create groups of road crossing points so that exactly one crosswalk could be placed inside each group, which would allow increasing the comfort and safety of pedestrians.
A special feature of clustering in this case is the need to divide road crossing points, which are at a sufficiently large distance from each other, into different groups. Another criterion for dividing road crossing points is the presence of an existing crosswalk between them. In the absence of such a division, it becomes possible to create a cluster within which a crosswalk already exists.
The clustering of the road crossing points takes place in a one-dimensional space where the road can be represented as the axis of a one-dimensional coordinate system. Road sections limited to existing crosswalks and intersections are considered separately. The end of the road section which is on the left in the image, or the upper end of the road section with a vertical location of the section in the image, is taken as the origin of coordinates. A unique coordinate is assigned to each road crossing point; the unit interval is one meter.
Clustering is based on a hierarchical agglomerative method (Varghese, Unnikrishnan, and Jacob Citation2014). The road crossing points that are no more than a certain maximum distance from each other are combined into one cluster. This maximum distance was chosen to be 50 m. The maximum cluster size was chosen to be 200 m. When the maximum size is exceeded, the cluster is divided into k equal-sized clusters, where k is calculated as
where S is the cluster size.
Clustering on the basis of such parameters allows getting crosswalks at a distance of about 60–90 m from each other. This correlates with the recommended distances specified in the guidelines (Broek Citation2014) and with a maximum distance of 200 m between crosswalks taken from the codes of rules applied in Russia (SP 34.13330.Citation2012Automobile roads 2013).
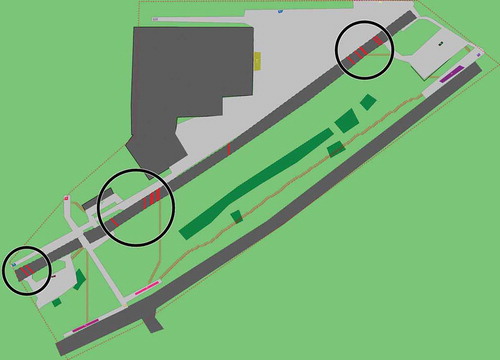
A cluster is formed by combining at least two road crossing points. Single road crossing points that are more than 50 m away from others are considered outlying cases and do not form a cluster. An example of road crossing point clustering on the basis of is shown in , where circles indicate the clustering.
Figure 4. Clustering of road crossing points.
3.2.4. Indicating recommended crosswalks
The next step after clustering is to indicate the recommended crosswalk within the cluster.
First, the centroid is determined inside the cluster. A centroid is a point whose coordinate is the arithmetic mean of the coordinates of the road crossing points within the cluster. The proposed crosswalk should be somewhere in the middle to minimize the deviation of existing pedestrian routes. As an average, the centroid was chosen rather than the median, for example, since there will be no significant difference in the case under consideration (the road crossing points are already combined into compact clusters without notably outlying individual points).
Then the location of placing the crosswalk within the cluster is determined. The general rule is the following: the crosswalk must be placed at a distance of at least 50 m from an existing crosswalk.
In most cases, it is enough to place the crosswalk in the centroid of the cluster, making it comfortable enough for anyone who crossed the road nearby. However, there are cases when an existing pedestrian path within the cluster approaches the roadway. Then it is logical to place the crosswalk in the continuation of the path, as it will provide convenient access for pedestrians.
The result is the following list of crosswalk locations (crosswalk types) that have an advantage over the centroid when the condition of the minimum distance from existing crosswalks is met:
A section where pedestrian zones on either side of the road adjoin the territory of the road within the cluster.
A section where a pedestrian zone on the one side of the road and a trampled path on the other side adjoin the territory of the road within the cluster.
A section where trampled paths on either side of the road adjoin the territory of the road within the cluster.
A section where a pedestrian zone on one side of the road adjoins the territory of the road within the cluster.
A section where a trampled path on one side of the road adjoins the territory of the road within the cluster.
The lack of a path on one side of the road can mean a situation where, after crossing the road, pedestrians disperse in different directions. In this case, the traffic in each direction is insufficient to form a stable path that would be visible in the simulation results, but the total traffic is sufficient to form a cluster of road crossing points.
If all of the specified sections (in case they exist inside the cluster) are located less than 50 m from the existing legal crosswalk, then no recommended crosswalk is located within this cluster.
If when indicating the recommended crosswalk it turns out that this crosswalk is less than 50 m from the recommended crosswalk in the neighboring cluster, then these two clusters are combined, and the location of the new recommended crosswalk is recalculated.
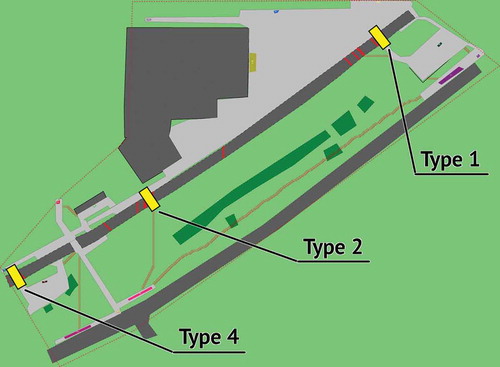
An image with indicated recommended crosswalks based on clustering shown in can be seen in . Yellow rectangles indicate the recommended crosswalks, the type of section from the list above, within which the crosswalk is arranged according to the algorithm, is given next to each crosswalk.
Figure 5. An image of recommended crosswalks
4. Experiments
4.1. Parameter calibration
A number of field experiments were carried out in order to calibrate the algorithm. Four locations were selected in St. Petersburg with different types of buildings: two in a new district of the city, and the other two in an old one. Locations were selected on the basis of convenience for conducting field studies. In particular, a lawn needed to be located along the roadway so that established crossing points could be identified by desire paths trampled on the lawn.
For each location, a series of simulations with different parameter values was carried out.
Two parameters that affect the placement of crosswalks were considered: the weight of the edges of the navigation graph on the roadway, which determines the attractiveness of the road for pedestrians, and the maximum cluster size.
Six cluster sizes were used, from 25 to 150 m with the increment of 25 m. This range was chosen because it covers all extreme cases in urban planning regulations that determine the minimum distance between crosswalks.
Three values of a graph edge weight for roads were used: one equal to the weight of a lawn (1.0), another one equal to the weight of green hedges (1.5, empirically selected during the development of the initial AntRoadPlanner algorithm), and an intermediate one between them (1.2). Such values were chosen based on the assumption that a roadway of a busy street is an obstacle less attractive (and safe) for a pedestrian than the lawn along it.
A total of 18 parameter sets and 72 simulation results for all four locations were obtained. An example result for a weight of 1.5 and a maximum cluster size of 75 m is shown in .
Figure 6. An example with the simulation result (weight 1.5, max cluster size 75 m)
The set was then selected which showed the smallest average deviation of the predicted crosswalk locations from the real natural crossing points (their exact location was determined by desire paths trampled on the lawns along the roadway). This parameter set turned out to be a weight of 1.2 and a cluster size of 75 m, which generally corresponds to European standards for the location of crosswalks.
It should be noted that, in general, the basic AntRoadPlanner algorithm has its own applicability limit. Simulation time and consumed resources grow rapidly as the area size and the number of attraction points increase. If the processing of a small area of about 0.01 km2 can take about half an hour using a 4-core 2.5 GHz CPU, then for an entire microdistrict with an area of 1–2 km2, the simulation will take several days at the same grid density.
Thus, the applicability of the algorithm is limited by the size of a separate block, and scaling to large areas (for example, an entire city) is impossible without reworking the algorithm. However, the task of processing such large areas is quite specific. If an entire new city is being designed, simulation and selection of locations for crosswalks can be performed block by block, accompanying the development planning process. In this case, the algorithm works quite fast and allows you to quickly make edits to the project and test the new layout.
However, the algorithm works incomparably faster when it is only needed to determine locations for placing crosswalks using the already obtained simulation results. For the scenarios described above, the calculation time will be just several seconds.
4.2. Validation
The parameter set that showed the smallest deviations was additionally tested on two more locations described below. The first territory is a small area given as an example in . This area is interesting to us because a large attraction point in the form of a hypermarket is located on the other side of the road relative to the other two large attraction points in the form of public transport stops. Due to the fact that there are only two crosswalks at the beginning and end of the road section within the selected limited area, and the hypermarket is located almost in the middle between these crosswalks, several stable trampled paths are formed in the territory (), and the road is often crossed in the wrong place ().
After clustering the road crossing points () and indicating recommended crosswalks (), the map was re-marked using the AntRoadPlanner web interface and analyzed using the simulation again. The result of the analysis for road crossing points can be seen in .
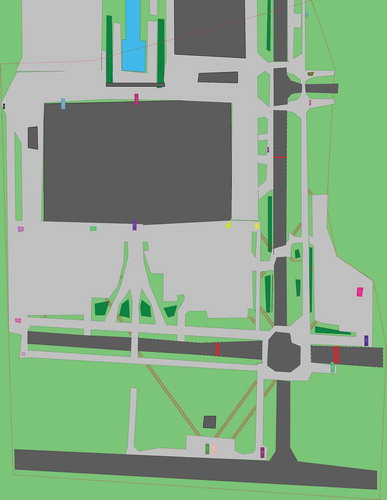
Figure 7. The image of trampled paths and road crossing points after re-simulation
As shown in the image, the three added crosswalks completely freed the simulation agents from having to cross the road in the wrong place. It is noteworthy that the arrangement of additional crosswalks changed the trajectories of trampled paths slightly. This may indicate the need to provide elements of pedestrian infrastructure that are consistent with the arrangement of additional crosswalks.
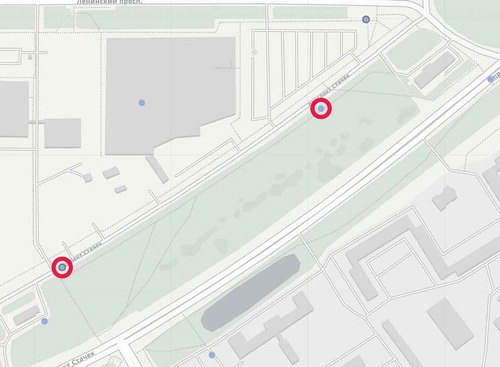
This territory was analyzed for accidents involving pedestrians in the studied areas using the Road Accident Map service (Road Accident Map Citation2018). According to the data of this service, in 2016 there were two knockdowns of pedestrians crossing the road outside the crosswalk, which fall into indicated clusters of road crossing points predicted by the simulation (). One of the accidents resulted in death. These accidents can be seen in , the accident locations are marked with red circles. The initial planning of the territory using this method, taking into account the optimal arrangement of crosswalks, could have helped avoid these accidents.
Figure 8. Accidents involving pedestrians crossing the road in the wrong place
Additionally, pedestrian flows were measured during an on-site study conducted from 5 p.m. to 6 p.m. on a weekday in December. At the point labeled “Type 1” in , 124 cases of pedestrians crossing the road were registered per hour. At the point labeled “Type 2”, only 3 crossings per hour were registered. However, desire paths in this place are clearly visible in the satellite image, which indirectly shows that this direction is popular among pedestrians at a time other than the observation period.
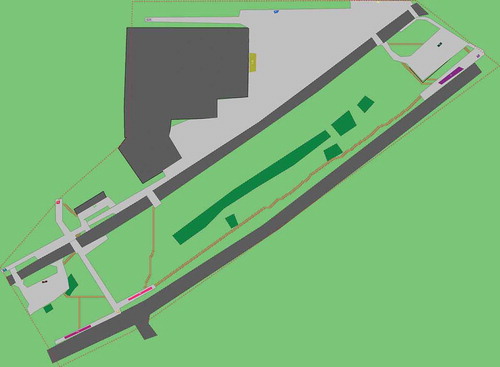
Another territory chosen for the experiment is an area near a housing estate also located in St. Petersburg, Russia. This area is in many ways similar to the previous example: a large shopping center and public transport stops are separated by the road. Two crosswalks are located at the two ends of the section of the road, the shopping center is in the middle between the crosswalks.
The map for this area was loaded into the map marking tool of the AntRoadPlanner web interface. Then, the map was analyzed using the simulation again. The result can be seen in . Trampled paths and places where agents crossed the road are marked in red. For comparison, shows a satellite image of a part of this territory.
Figure 9. The image of trampled paths and road crossing points before arranging the recommended crosswalks
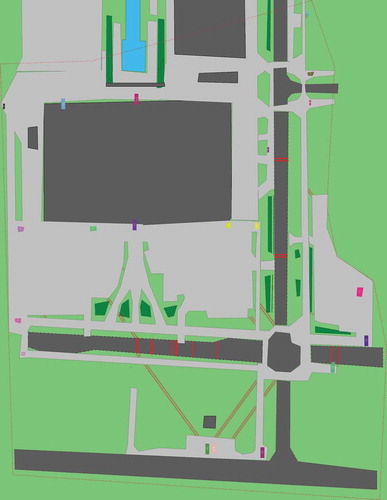
Figure 10. A satellite image of the area (Kudinov et al. Citation2018)
As can be seen in these images, well-established trampled paths are formed in the territory due to the lack of a direct pedestrian connection between the entrance to the shopping center and the public transport stop. In the simulation, there are many agents crossing the road in the wrong place. At the same time, some pedestrians use the paths, while some others go directly across arbitrary places of the lawn, creating large extended road crossing point clusters. Such road crossing points can lead to accidents and constitute a great danger to traffic participants.
After clustering the road crossing points and indicating the recommended crosswalks according to the algorithm described above, the scheme shown in was obtained. Circles indicate the road crossing point clusters, yellow rectangles indicate the recommended crosswalks. One of the crosswalks suggested by the algorithm was inside a Type 3 section – adjacent trampled paths on both sides of the road; the second crosswalk fell into the centroid of the cluster.
Furthermore, the recommended crosswalks were added according to the new scheme in the marking tool of the AntRoadPlanner web interface. A re-simulation was executed on the updated map. The results of the re-simulation can be seen in . Red lines indicate the trampled paths and the points where agents crossed the road.
Figure 11. The image of road crossing clusters and recommended crosswalks
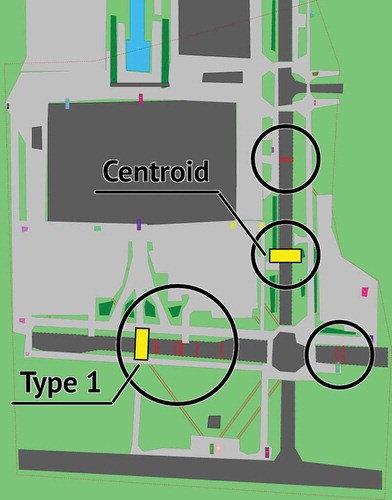
Figure 12. The image of trampled paths and road crossing points after re-simulation
As seen in the image, an additional crosswalk on the vertical section of the road met the needs of pedestrian agents within this cluster. On the horizontal road section to the left of the intersection, one compact group of road crossing points remains that is sufficiently distant from the additional crosswalk; the remaining road crossing points were eliminated using the recommended crosswalk. The road crossing points at the top of the vertical section of the road and to the right of the intersection remain on the map. Crosswalks were not placed inside these clusters due to the proximity of the existing crosswalks (less than 50 m).
A field study was also conducted in the area under consideration in order to calculate the intensity of the car flow and the flow of pedestrians crossing the road at the junction of the trampled path (this place corresponds to the additional crosswalk on the horizontal section of the road in ). According to calculations, the average intensity of the car flow in the daytime in February is 704 cars per hour; the average intensity of the pedestrian flow in the daytime is 140 people per hour. According to the applicable Russian state standard in the design of crosswalks (GOST 32944-Citation2014 2016), this intensity is sufficient to arrange a crosswalk in this place.
5. Conclusions
In the course of the study, a simulation-based method was developed for predicting the places where pedestrians cross the road illegally and indicating recommended locations for arranging crosswalks taking into account such illegal crossing points. The method uses the results of the AntRoadPlanner desire path simulation program as input data. To implement the method an extension to the original algorithm was created, allowing saving and processing the results using databases, as well as an algorithm for clustering the points of crossing the road in the wrong place and the subsequent indication of the recommended additional crosswalks.
To evaluate the created method, pairs of simulations were performed before and after arranging additional crosswalks. The method showed a fairly high accuracy in providing simulation agents with necessary crosswalks that help eliminate crossing the road in the wrong place. In addition, a field study proved the applicability of this method for finding problem areas observed in real life.
Using the method together with the AntRoadPlanner simulation can help not only find the paths trampled on the territory, but also ensure the optimal placement of the crosswalks necessary for pedestrians both at the planning stage and for existing territories. Thus, this method helps create a more comfortable and safe pedestrian infrastructure and avoid the appearance of places where there is a tendency to cross the road illegally.
In future it is planned to refine the rules of the algorithm to achieve more accurate results. First of all, it is planned to include so-called road crossing weights – the number of pedestrians who passed along the route – into the algorithm for indicating recommended crosswalks. Taking into account the crossing weights will allow determining the centroid of the cluster more accurately and finding the optimal position for an additional crosswalk. Also, the algorithm should be refined by conducting more empirical measurements and comparing the results with the actual situation in places where there is a problem with pedestrians crossing the road in the wrong place.
It should be noted that using a database to store information about simulation results and running spatial SQL queries allows finding and visualizing not only the cases when simulation agents cross the road in the wrong place, but also any other information about the simulation results. For example, in order to ensure greater safety for both pedestrians and car drivers, it is possible to display information about areas of insufficient visibility causing a risk of an accident. The use of this approach opens up significant prospects in expanding and supplementing the simulation with new tools and in emergence of additional functionality.
Data availability statement
The data that support the findings of this study are openly available in Zenodo at https://doi.org/10.5281/zenodo.4041861, reference number 4041861.
Additional information
Funding
Notes on contributors
Egor Smirnov
Egor Smirnov is a researcher at the Urban Research Laboratory of Institute for Design and Urban Studies of ITMO University. His research is primarily focused on pedestrian behavior modeling and creating software that helps architects and urban planners make comfortable pedestrian infrastructure projects.
Sergei Dunaenko
Sergei Dunaenko is an engineer at the Urban Research Laboratory of Institute for Design and Urban Studies of ITMO University. His research interests are pedestrian safety and GIS programming.
Sergei Kudinov
Sergei Kudinov is an expert at the Urban Research Laboratory of Institute for Design and Urban Studies of ITMO University. His research interests are spatial analysis, urban planning, planning support systems, computing in urban research.
References
- Broek, N. V. 2014. The When, Where and How of Mid-Block Crosswalks. Lawrence, KS: A Service of the University of Kansas Transportation Center for Road & Bridge Agencies.
- Cole, B. 2018. “Residents Call For Crosswalk To Goodwill Park.” Accessed 17 February 2019. https://www.capenews.net/falmouth/news/residents-call-for-crosswalk-to-goodwill-park/article_9aaec597-1db7-5e61-a4ed-e687fe636ec7.html
- Daganzo, C. F., and V. L. Knoop. 2016. “Traffic Flow on Pedestrianized Streets.” Transportation Research Part B: Methodological 86: 211–222. doi:10.1016/j.trb.2015.12.017.
- Feliciani, C., L. Crociani, A. Gorrini, G. Vizzari, S. Bandini, and K. Nishinari. 2017. “A Simulation Model for Non-signalized Pedestrian Crosswalks Based on Evidence from on Field Observation.” Intelligenza Artificiale 11 (2): 117–138. doi:10.3233/IA-170110.
- Gorrini, A., L. Crociani, G. Vizzari, and S. Bandini. 2018. “Observation Results on Pedestrian-vehicle Interactions at Non-signalized Intersections Towards Simulation.” Transportation Research Part F 59: 269–285. doi:10.1016/j.trf.2018.09.016.
- GOST 32944-2014. 2016. “Car Roads for General Use. Pedestrian Crossings. Classification. General Requirements.” In Technical Standards Maintained by the Euro-Asian Council for Standardization, Metrology and Certification. Moscow, Russia: Federal State Unitary Enterprise “Russian Scientific and Technical Information Center for Standardization, Metrology and Conformity Assessment” (STANDARTINFORM).
- Helbing, D., J. Keltsch, and P. Molnar. 1997. “Modelling the Evolution of Human Trail Systems.” Nature 388 (6637): 47–50.
- Irish Government, Dept. Transport, Tourism & Sport. 2013. Design Manual for Urban Roads and Streets. Government of Ireland. https://www.gov.ie/en/publication/3360b1-design-manual-for-urban-roads-and-streets/
- Khodnenko, I., S. Kudinov, and E. Smirnov. 2018. “Walking Distance Estimation Using Multi-agent Simulation of Pedestrian Flows.” Procedia Computer Science 136: 489–498. doi:10.1016/j.procs.2018.08.256.
- KITV. 2018. “Residents Want Crosswalks Back on Makakilo Drive.” Accessed 17 February 2019. https://www.kitv.com/story/37864377/residents-want-crosswalks-back-on-makakilo-drive
- Kudinov, S., E. Smirnov, G. Malyshev, and I. Khodnenko. 2018. “Planning Optimal Path Networks Using Dynamic Behavioral Modeling.” In Computational Science – ICCS 2018, edited by Y. Shi, et al., 129–141. Cham, Switzerland: Springer Nature.
- Kumar, A. 2015. “A Systems Approach to Assess and Improve the Last-mile Access to Mass Transits.” Ph.D Thesis. Singapore: Department of Industrial and Systems Engineering, National University of Singapore.
- Lawniczak, A. T., B. N. Di Stefano, and J. B. Ernst. 2015. “Stochastic Model of Cognitive Agents Learning to Cross a Highway.” Stochastic Models, Statistics and Their Applications 122: 319–326.
- Malyshev, G. N. 2018. “Analysis and Development of Proposals for Improving the Method of Behavioral Computer Modeling in order to Build an Optimal Network of Pedestrian Paths.” Master’s thesis. Saint Petersburg: ITMO University.
- Mudron, I., and M. Pachta. 2013. “Pedestrian Network Design and Optimisation Based on Pedestrian Shortcuts and Needs.” GIS Ostrava 2013 – Geoinformatics for City Transformation Proceedings, 175–184. Ostrava, Czech Republic.
- National Center for Statistics and Analysis. 2008. How to Develop a Pedestrian Safety Action Plan. Washington, DC: National Highway Traffic Safety Administration.
- National Center for Statistics and Analysis. 2017. Pedestrians: 2015 Data. (Traffic Safety Facts. Report No. DOT HS 812 375). Washington, DC: National Highway Traffic Safety Administration.
- National Center for Statistics and Analysis. 2018. Pedestrians: 2016 Data. (Traffic Safety Facts. Report No. DOT HS 812 493). Washington, DC: National Highway Traffic Safety Administration.
- Nitzsche, C. 2013. “Cellular Automata Modeling for Pedestrian Dynamics.” Bachelor thesis. Greifswald: Faculty of Mathematics and Natural Sciences, The University of Greifswald.
- Noyce, D. A., and G. Lu. 2009. “Pedestrian Crossings at Mid-Block Locations: A Fuzzy Logic Solution for E.xisting Signal Operations.” Paper presented at the 88th Annual Meeting of the Transportation Research Board. 11–15 January, Washington, DC, 1–20.
- PostGIS – Spatial and Geographic objects for PostgreSQL. 2018. Accessed 18 February 2019. https://postgis.net
- Road Accident Map. 2018. Accessed 18 February 2019. https://dtp-stat.ru/sankt-peterburg/?lat=59.8504&lng=30.2289&zoom=17
- Romm, A. P. 2006. “Pedestrian Networks.” Academia Archit. Constr 2: 45–49.
- Sanseverino, E. R., R. R. Sanseverino, and V. Vaccaro. 2017. Smart Cities Atlas – Western and Eastern Intelligent Communities. Palermo: Springer.
- Smirnov, E., and M. Gurevich. 2017. “Ant Road Planner – Pedestrian Simulator Webpage.” Accessed 14 February 2019. https://antroadplanner.ru
- Snider, A. 2018. “Residents Call for Crosswalk on Nashville Street with Heavy Traffic.” Accessed 17 February 2019. https://www.wkrn.com/news/residents-call-for-crosswalk-on-nashville-street-with-heavy-traffic/1340569613
- SP 34.13330.2012 Automobile roads. 2013. Set of Urban Planning Rules in Russia. Moscow, Russia: Ministry of Regional Development of the Russian Federation.
- The Blade. 2018. “Residents Want Lights, Crosswalks on Road Where Teen Was Fatally Struck by Van.” Accessed 17 February 2019. https://www.toledoblade.com/local/police-fire/2018/10/29/Residents-want-lights-crosswalks-on-road-where-teen-was-hit-and-killed-by-van/stories/20181029129
- The State Traffic Inspectorate. 2019. “Road Safety Indicators.” Accessed 14 February 2019. http://stat.gibdd.ru
- Vanderslice, E. 1998. Portland Pedestrian Design Guide. Portland, OR: The Pedestrian Transportation Program.
- Varghese, B., A. Unnikrishnan, and K. P. Jacob. 2014. “Spatial Clustering Algorithms – An Overview.” Asian Journal of Computer Science and Information Technology 3: 3–4.
- Yang, J., W. Deng, J. Wang, Q. Li, and Z. Wang. 2006. “Modeling Pedestrians’ Road Crossing Behavior in Traffic System Microsimulation in China.” Transportation Research Part A: Policy and Practice 40 (3): 280–290.
- Ye, S., L. Wang, K. H. Cheong, and N. Xie. 2017. “Pedestrian Group-Crossing Behavior Modeling and Simulation Based on Multidimensional Dirty Faces Game.” Complexity 2017: 1–12. doi:10.1155/2017/1723728.
- Zeng, W., P. Chen, H. Nakamura, and M. Iryo-Asano. 2014. “Application of Social Force Model to Pedestrian Behavior Analysis at Signalized Crosswalk.” Transportation Research Part C: Emerging Technologies 40: 143–159. doi:10.1016/j.trc.2014.01.007.