
ABSTRACT
Do we still need Cartography? Do we still need a cartographic society? These questions, which can also be transferred to other disciplines, are answered from disciplinary and interdisciplinary perspectives – which creates an ideal connection to the networked and interdisciplinary thinking of Gottfried Konecny. The need for Cartography as a discipline is discussed based on a view on historic, current and future functions of maps and changing research and development requirements. With respect to interdisciplinarity, Cartography shows connections to various domains while more and more relationships with young areas from the field of Computer Science are developing. With regard to cartographic societies, their central role and importance as networking platforms are emphasized. Nevertheless, geographical and thematic granularities of societies as well as networking formats (including online versions) need to be evaluated and further developed on a constant basis.
Personal preliminary remarks
The invitation to this contribution on the occasion of the 90th birthday of Prof. Dr. mult. Gottfried Konecny immediately led me to the question: In a retrospective, what did I actually learn from my doctoral adviser (in German, the nice term “doctoral father” is used)?
On the one hand, of course, there are the principles of scientific thinking and management that Gottfried Konecny stands for and of which I have adopted a large number. Above all, this includes his international work and global thinking, which is also expressed in his engagement in various organizations (like the UN) and professional societies (like the ISPRS). On a technical level, it is his networked and interdisciplinary thinking. As an example, Gottfried Konecny – thinking out of the box of photogrammetry – took up the topic of Geographic Information Systems at the University of Hanover in the early 1980s and pursued it in teaching and research, far ahead of his colleagues in Cartography.
In the retrospective, it also becomes clear how strong Gottfried Konecny was committed to promoting the young generation of scientists. He created several offers, such as the opportunity to study abroad at the University of New Brunswick in Canada, which had a huge impact on me personally and professionally. Dealing with employees was always characterized by a “long leash” and credit of trust. Giving me half of his speaking time for a keynote at the ISPRS Symposium 1994 in Athens (USA) was a typical example of this. His help and criticism were compact and to the point – I vividly remember the central discussion before submitting my dissertation during a train journey from Munich to Hanover.
To answer the question asked at the beginning: Gottfried Konecny shaped me significantly in my first six years in academia. I have a foundation for scientific action and work that I still use every day.
1. Introduction
This article will take up some of the aspects mentioned above to honor Gottfried Konecny. My personal path, from a technical and geographical point of view, led me from Photogrammetry (Hannover) to GIS and Remote Sensing (Vechta and Osnabrück) to Cartography (Bonn and Hamburg). With my current professional focus and through my work as President of the German Cartographic Society (DGfK), I am often confronted with the basic questions: Do we still need Cartography? Do we still need a cartographic society? Of course, these questions can easily be transferred to other disciplines such as Geodesy, Geoinformatics or Photogrammetry – leading to an assessment of the need for disciplinary and interdisciplinary perspectives. It is not the aim of this paper to give a comprehensive and systematic evaluation for the need of Cartography based on an in-depth review of the literature – for this purpose I refer to the latest research agenda that has been organized and developed by the International Cartographic Association (Griffin, Robinson, and Roth Citation2017; Robinson et al. Citation2017). Instead, mainly personal thoughts and perspectives should be shown in this paper.
2. Need for cartography?
2.1. Historic view
Historically, the functions of maps and the need for Cartography have changed several times. This is of course due to technological, but also social developments. The different functions made new applications possible.
In the middle ages, maps were especially a prestige object: On the one hand, tools and the ability to produce maps, on the other hand, access to information were reserved for a select group of people. In particular, ecclesiastical and military purposes were served in this way. This era also gave rise to the function of a map as an artistic object, which has been preserved until today, albeit with a greatly declining importance: In particular, old maps are nowadays viewed (and marketed) as esthetic products; however, in relation to the total number of maps published, those that stand out in map exhibitions for their beauty make up only a marginal share.
Beginning with the topographical state survey in the 18th century, maps increasingly gained the function of data storage, which had to contain as much of the data as possible. With that, military as well as governmental purposes could be served. It was only with the advent of digital databases in the 20th century that this function became almost redundant.
At the beginning of the 21st century – and in particular with the advent of Google Maps – the map received an interface function; in the case of Google Maps, between locations and advertising offers. On the other hand, maps were and are also currently viewed primarily as services that deal with very specific, often very narrow questions (e.g. route search from A to B) or messages (e.g. conveying spatial patterns for certain phenomena).
2.2. Selected current developments
Technical developments have influenced the design, creation and distribution of maps for centuries. Nowadays, this influence is even more dominant compared to other societal factors or applications. Some of these developments are addressed in the following.
In the current era, data availability no longer plays a role in the process of modeling geospatial data. In fact, the contrary is the case: growing sensor networks, higher data transmission rates or the trend toward user-generated data are generating larger and larger – and more confusing – data volumes. This is where a core competency of Cartography comes into play – the graphic transformation and reduction of geospatial data to a necessary minimum, generally referred to as generalization.
In the past 20 years, mobile and interactive devices have become the predominant output medium. While there is still not always a mobile-first strategy in Cartography like in other areas (e.g. mass media), the changed screen sizes, resolutions and interaction options have had and still have a great influence on the design of maps. Regardless of the type of screen, the various interaction options (touch, speech, gaze, etc.) play an important role in the creation of digital maps.
Looking again at the functions that maps currently and predominantly have, there are also a number of aspects that define further research needs. On the one hand, maps, along with other representations, are increasingly used as a “tool” for exploring databases. Instead of purely presenting messages, tools are required that are used to search in huge databases, to look for salient patterns and to generate new hypotheses (Çöltekin et al. Citation2017).
On the other hand, the idea of a service function is constantly being extended. With that, further research challenges arise. First, the service paradigm requires a strict task-oriented perspective, for which new cartographic algorithms are necessary. Second, the effectiveness of these algorithms must be tested – hence, cognitive influences have to be taken into account and empirical usability studies are essential (Roth et al. Citation2017). In the following, two research projects are briefly presented as examples, which should demonstrate the task-oriented philosophy.
Example 1: Task-oriented data classification
A standard task in Cartography, in particular in the process of creating choropleth maps, consists in the data classification, i.e. the generation of attribute value groups in order to be able to represent a manageable number of classes with easily separable colors or hatching. The known methods for classification (e.g. equidistant, quantiles, natural breaks) set the interval limits along the number line, partly under consideration of the histogram of the given values. However, this approach neglects any spatial relationships that might exist in the data set, leading to the fact that certain spatial patterns being destroyed by the transformation of the values into class values. (left, middle) gives an example of how a local extreme value (i.e. a value that only has larger values in its direct neighborhood) can no longer be recognized after the classification or the follow-up coloring.
Figure 1. Data classification using equidistant (left), quantile (middle) and aChor method (right): With the first two methods, the local extreme value region (outlined; with value 4.14) falls in same class/color as some neighbors, while the aChor method preserves the extreme value information graphically (own figure)
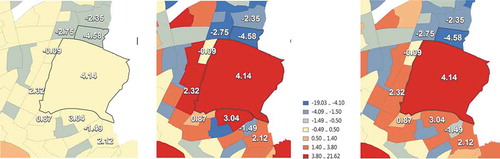
In contrast, the aChor project (task-oriented data classification and design of choropleth maps; funding: German Research Foundation; Chang and Schiewe Citation2018) pursues a task-oriented approach. For specific spatial tasks like the preservation of local outliers, hot/cold spots or spatial clusters new algorithms have been developed, implemented and successfully tested. (right) shows the corresponding effect for an example data set. The underlying principle of this methodology and resulting open source toolbox have also been transferred to the task of visual change analysis (Schiewe Citation2018).
Example 2: Point generalization
With the increasing availability of sensor network data or user generated content, the volume as well as semantic and temporal heterogeneity of data – and in particular point data – is growing. At a certain map scale and amount of data, this can lead to point clutters, which are not only hiding important information, but also making the map unreadable (). Thus, reducing geometric and thematic clutter and improving the interpretability of static, multi-scale or multi-temporal visualizations of points is still a cartographic task of major relevance.
Figure 2. Example of geometric point clutter (topic: pubs in the UK; source: Google maps)
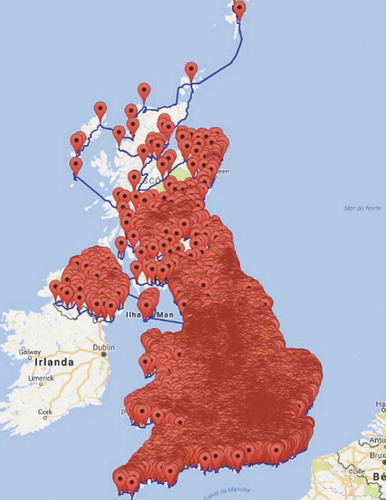
Instead of looking at isolated generalization operations only, the project TOVIP (Improvement of task-oriented visual interpretation of VGI point data; Schiewe Citation2019) focuses on optimizing generalization workflows designed for specific high-level visual interpretation tasks, especially focusing on the identification and preservation of spatial patterns. Normally, generalization methods like aggregation, selection or simplification, are applied in order to overcome the aforementioned clutter problems, merging the input information by reducing the amount of visible point symbols. However, these generalization methods might destroy spatial patterns, reducing the usability in visual presentation and exploration, especially when the interpretation of high-level patterns (e.g. hot spots, extreme values) is of interest. Therefore, the TOVIP project focuses on the optimization of generalization workflows regarding these specific visual interpretation tasks.
2.3. Selected future developments
Looking at current and future developments in Cartography, a couple of development issues – among others – emerge.
While there is still a lack of development concerning general services as mentioned above, the trend will certainly continue toward individual services. This will, for example, require the inclusion of natural language processing in order to explicitly process real-world questions that shall be answered by tailored and automatically generated maps.
Due to more and more hardware solutions and falling costs, Mixed Reality (MR) is finding its way into everyday life. So far, Cartography and maps have only played a subordinate role in the entire development process. On the other hand, four-dimensional geo data is an essential component in virtual or augmented reality applications. There is a strong need for task-oriented and integrative solutions that generate added value for specific applications. For example, generalized maps that are linked to other visualizations can be used for the overview function in MR. Collaboration and communication between MR users needs to be improved. With the increased use of data glasses, the maps are being brought closer and closer to the user physically – the term human-centered maps has already been created for this.
The constantly increasing availability of temporally high-resolution spatial data requires alternative or adapted forms of cartographical presentation. The classic way of the animated representation is certainly still valuable for some purposes (e.g. for the representation of one-sided and spatially uniform trends). On the other hand, effective and efficient forms of visualization for more complex issues from a temporal point of view still have to be found.
After all, in the future (hopefully) a social component will have to be taken into account more often: a balancing act has to be done between more and more individuality (with the need for automatically created, individual maps) and more and more democratic participation (with the need for collaborative elements in maps).
For all of these developments, however, the functions of the map that are historically specified (see section 3.1) will continue to play a role – albeit being less important. As an example, good esthetics of course has a huge impact on user experience and acceptance.
2.4. Disciplinary and interdisciplinary components
Cartography, nowadays, can be defined as follows: It is the discipline that deals with the coding of geospatial data and information for the purposes of presentation or exploration at the interface between the environment and humans – this includes the processing of the underlying data. Based on this definition, Cartography has – still – to be seen as a highly interdisciplinary discipline. Traditionally, due to their scientific embedding, there are close relationships to Geodesy (especially in European and in particular German-speaking countries) and Geography. In addition, there are interfaces to a large number of other disciplines. A special feature of Cartography is the large number of disciplines that form its fundamental basis. This includes Mathematics (e.g. on the subject of map projections), (Geo-)Statistics, Computer Science, Communication theory, Cognitive Sciences, Law, or Didactics.
Furthermore, there are very tight process-oriented connections to Geodesy and Geographical Information Sciences: Here, Cartography takes over the task of presenting or communicating data and information in the overall processing chain of acquisition, processing, analysis and presentation.
Interfaces that are primarily defined by the application (i.e. the topics of the maps) exist in particular with the geosciences (e.g. Geography, Geology, Geophysics) and with spatial or urban planning. In the 1980s, there was also a paradigm shift in the cultural and social sciences known as “spatial turn”, which took geographical space back into account and increasingly used maps as a tool (Barrows Citation2016; Perkins Citation2003).
Finally, there are methodological relationships of Cartography to some, rather young disciplines. In addition to Computer Graphics or Human-Computer Interaction, this includes various areas of visualization. For example, Scientific Visualization deals with data that have natural geometric structures (e.g. wind flows). Information Visualization, on the other hand, treats abstract data structures such as trees or graphs.
The young field of Geovisualization has led to some discussion about the interaction and the demarcation from Cartography. According to MacEachren and Kraak (Citation2001), Geovisualization deals with the development of theories, methods and tools for the visual exploration, analysis, synthesis and presentation of spatial data for specific applications and users. The focus here is mainly on exploration tasks. For this purpose, approaches from the fields of Cartography, Scientific Visualization, Image Processing, Information Visualization, Explorative Data Analysis, Data Mining, GIS, Visual Perception and other disciplines are integrated.
A problem with the term Geovisualization arises from the sub-word “visualization”, which is defined differently in different disciplines. In the colloquial sense, the more general task of making phenomena visible by graphic means is understood – rather than the explorative character of it. For many people, Geovisualization even seems to be just a new term for Cartography. Kraak (Citation2008) confirms this observation by stating that Geovisualization “is slowly becoming synonymous with cartography”, not only in everyday language, but also in the GI-Science literature.
Thomas and Cook (Citation2005) introduced the term Visual Analytics. According to Keim et al. (Citation2010), it combines “automated analysis techniques with interactive visualizations for effective understanding, thinking and decision-making based on very large and complex data sets”. Since Visual Analytics is used in a broad context and a large area of applications, Geovisual Analytics emphasizes the use of geographic data and analysis methods in a multidisciplinary context (Andrienko et al. Citation2011).
Since the terminology for the term Geovisual Analytics is neither clear nor generally accepted, Schiewe (Citation2013) proposed an extended meaning: Geovisual Analytics should refer to a combination of visual and computational methods and tools for extracting hypotheses and information from spatial data.
Both the Geovisualization and the Geovisual Analytics emphasize a multi-disciplinary character. In this context, Cartography can be seen as a central discipline (). It provides not only design principles for (cartographical) representations, but also concepts and implementations for interactive visualizations with geospatial reference.
Figure 3. Interplay of cartography with other disciplines, including Geovisualization and Geovisual analytics (source: Schiewe Citation2013)
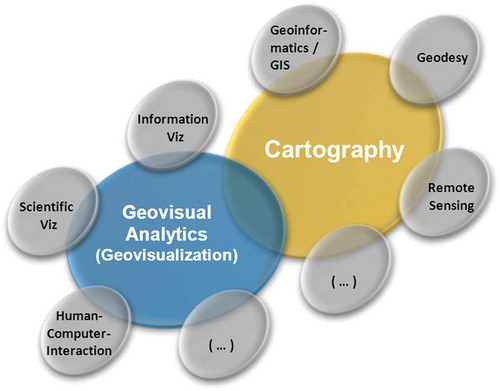
In summary, it can be stated that the interdisciplinary influence in or cooperation with Cartography has been steadily increasing since the 1990s. This is due to the fact that other disciplines (in particular, Computer Science) develop either special areas (e.g. Information Visualization), or more holistic approaches (e.g. Geovisualization). The boundaries of these areas from each other and from Cartography are not crisp, there are clear methodological overlap areas. Of course, this variety of disciplines can be seen as a problem or competition for Cartography. However, there is still the disciplinary core of Cartography, which includes the processing and coding of geospatial data and information. On the other hand, this diversity offers new potential beyond the disciplines for the further development and adaptation of concepts and methods in Cartography.
3. Need for cartographic societies?
Looking at the statutes of professional societies, the promotion of the discipline, the training and further education as well as the maintenance of national and international cooperation are always mentioned as their main purposes. In essence, a professional society serves as a platform for networking.
When it comes to concrete advertising for members, networking measures such as the discounted access to conferences and technical journals are usually cited. With respect to publications, both the German Cartographic Society (DGfK) and the German Society for Photogrammetry, Remote Sensing and Geoinformation (DGPF) recently followed the network idea of publishing their journals (KN – Journal of Cartography and Geographic Information, and PFG – Photogrammetry, Remote Sensing and Geoinformation, resp.) and switched to a globally operating publisher in order to create a larger international audience and allow open access publications.
Members continue to require platforms for personal exchanges. Despite ongoing virtualization, face-to-face meetings are still strongly demanded. At the same time, there is also a desire for spatially flexible offers. Here, the corona pandemic has had a strong catalyst effect with regard to the organization of online meetings. The DGfK has meanwhile set up a monthly CartoCafé, in which around 30 to 40 participants discuss given scientific, practical or organizational topics from the field of Cartography. A first evaluation among the participants revealed that this offer provides the desired added value, but should definitely not replace face-to-face events.
While there is consensus on the need for professional societies, the question of their granularity is debatable. This can be viewed in different ways:
Geographical granularity is concerned with the question which regions a society should cover. While international societies such as the International Cartographic Association (ICA) operate worldwide, there are different approaches at national level. The German DGfK shows a division into 16 regional sections. Depending on population density, proximity to university locations and administrative offices as well as the commitment of the members, the sections differ greatly in their activities.
Thematic granularity: From time to time, there are discussions concerning a merge of societies of related disciplines. At the moment, the rather strongly compartmentalized setting in Germany – having associations for Geodesy, Cartography, Photogrammetry, Hydrography, Mine Surveying, and others – appears to be manifested. Nevertheless, joint events take place or joint working groups (such as the commissions on 3D city models or on Virtual and Augmented Reality, both between DGfK and DGPF) are successfully carried out. In light of the increased interdisciplinarity (see section 3.4), networking with other disciplines is becoming increasingly important. As an example, in the case of the DGfK, there are currently collaborations with partners from school geography and data journalism.
In the end, the discussions about granularity always lead to an assessment of a necessary critical mass of participants or engagement. But the psychological aspect should not be neglected either: tradition and affiliation of members to a technical core (in the case of Cartography: visualization as a unique selling point compared to Geodesy or Photogrammetry) play a role that should not be underestimated. However, whether the current setting of the societies will remain meaningful and attractive in the future must be constantly discussed and reevaluated.
4. Summary
The traditional functions of maps continue to exist (e.g. as prestige or esthetic objects, or for data storage), but the focus changes constantly (currently toward maps as services). With that there is still a broad need for cartographic research and development. At the same time the degree of interdisciplinary integration is growing – especially as new special areas grow out of other disciplines (especially from Computer Science). The delimitation of these special areas such as Information Visualization, Geovisualization of Geovisual Analytics from each other and from Cartography in particular is not crisp; in fact, there are obvious methodological overlap areas.
Some people see these developments as a problem for Cartography. However, there is still its disciplinary core, which includes the processing, reduction and coding of geospatial data and information. The increased interdisciplinarity should rather be seen as an opportunity to derive new potential for the further development and adaptation of external concepts and methods for Cartography.
This growing interdependency and complexity also strengthens the importance of professional societies as they basically offer a platform for networking within – and outside – the discipline. The current communication formats within these platforms are currently evolving – toward a hybrid variant that includes traditional presence offers (e.g. conferences, workshops) as well as new online versions.
Acknowledgments
Thanks to M.Sc. Juiwen Chang for programming and outputs within the aChor project.
Disclosure statement
No potential conflict of interest was reported by the author(s).
Data and Method Availability Statement
Data set presented in (deprive index of Hamburg, 2016) is open data: http://suche.transparenz.hamburg.de/dataset/sozialmonitoring-integrierte-stadtteilentwicklung-bericht-2016-anhang
Methods for the project aChor (section 3.2; ) are available under the GitHub account: https://github.com/Ariel505/aChor
Additional information
Funding
Notes on contributors
Jochen Schiewe
Jochen Schiewe is a full professor for Geoinformatics and Geovisualization at HafenCity University Hamburg, Germany, where he chairs the Lab for Geoinformatics and Geovisualization (g2lab). He received his PhD degree from University of Hannover, Germany, and his habilitation (venia legendi) from University of Vechta, Germany. His research interests are in the fields of cartographic algorithms, uncertainty modeling and visualization, and media maps. Since 2019, he is president of the German Cartographic Society (DGfK).
References
- Andrienko, G., N. Andrienko, D. Keim, A. M. MacEachren, and S. Wrobel. 2011. “Challenging Problems of Geospatial Visual Analytics.” Journal of Visual Languages and Computing 22 (4): 251–256. doi:10.1016/j.jvlc.2011.04.001.
- Barrows, A. 2016. “Introduction: Time and Literature after the Spatial Turn.” In Time, Literature, and Cartography after the Spatial Turn. Geocriticism and Spatial Literary Studies, edited by A. Barrows, 1–31. New York: Palgrave Macmillan. doi:10.1057/978-1-137-56901-1_1
- Chang, J., and J. Schiewe. 2018. “An Open Source Tool for Preserving Local Extreme Values and Hot/cold Spots in Choropleth Maps.” Kartographische Nachrichten 68 (6): 307–309.
- Çöltekin, A., S. Bleisch, G. Andrienko, and J. Dykes. 2017. “Persistent Challenges in Geovisualization – A Community Perspective.” International Journal of Cartography 3 (sup1): 115–139. doi:10.1080/23729333.2017.1302910.
- Griffin, A. L., A. C. Robinson, and R. E. Roth. 2017. “Envisioning the Future of Cartographic Research.” International Journal of Cartography 3 (sup1): 1–8. doi:10.1080/23729333.2017.1316466.
- Keim, D., J. Kohlhammer, G. Ellis, and F. Mansmann. 2010. Mastering the Information Age – Solving Problems with Visual Analytics. Goslar: Eurographics Association.
- Kraak, M. J. 2008. “From Geovisualisation Toward Geovisual Analytics.” The Cartographic Journal 45 (3): 163–164.
- MacEachren, A. M., and M.-J. Kraak. 2001. “Research Challenges in Geovisualization.” Cartography and Geographic Information Science 28 (1): 3–12. doi:10.1559/152304001782173970.
- Perkins, C. 2003. “Cartography: Mapping Theory.” Progress in Human Geography 27 (3): 341–351. doi:10.1191/0309132503ph430pr.
- Robinson, A. C., U. Demšar, A. B. Moore, A. Buckley, B. Jiang, K. Field, M.-J. Kraak, S. P. Camboim, and C. Sluter. 2017. “Geospatial Big Data and Cartography: Research Challenges and Opportunities for Making Maps that Matter.” International Journal of Cartography 3 (sup1): 32–60. doi:10.1080/23729333.2016.1278151.
- Roth, R. E., A. Çöltekin, L. Delazari, H. F. Filho, A. Griffin, A. Hall, J. Korpi, et al. 2017. “User Studies in Cartography: Opportunities for Empirical Research on Interactive Maps and Visualizations.” International Journal of Cartography 3 (sup1): 61–89. doi:10.1080/23729333.2017.1288534.
- Schiewe, J. 2013. “Geovisualization and Geovisual Analytics: The Interdisciplinary Perspective on Cartography.” Kartographische Nachrichten Special Issue 2013: 122–126.
- Schiewe, J. 2018. “Task-Oriented Visualization Approaches for Landscape and Urban Change Analysis.” ISPRS International Journal of Geo-Information 7 (8): 8. doi:10.3390/ijgi7080288.
- Schiewe, J. 2019. “Conceptual Framework for Enhancing Visual Change Point Analysis in Generalized Multi-temporal Displays.” Proceedings of the International Cartographic Association 2: 114. doi:10.5194/ica-proc-2-114-2019.
- Thomas, J. J., and C. A. Cook. 2005. Illuminating the Path: The Research and Development Agenda for Visual Analytics. Washington: IEEE Press.