
 ?Mathematical formulae have been encoded as MathML and are displayed in this HTML version using MathJax in order to improve their display. Uncheck the box to turn MathJax off. This feature requires Javascript. Click on a formula to zoom.
ABSTRACT
Taking cities as objects being observed, urban remote sensing is an important branch of remote sensing. Given the complexity of the urban scenes, urban remote sensing observation requires data with a high temporal resolution, high spatial resolution, and high spectral resolution. To the best of our knowledge, however, no satellite owns all the above characteristics. Thus, it is necessary to coordinate data from existing remote sensing satellites to meet the needs of urban observation. In this study, we abstracted the urban remote sensing observation process and proposed an urban spatio-temporal-spectral observation model, filling the gap of no existing urban remote sensing framework. In this study, we present four applications to elaborate on the specific applications of the proposed model: 1) a spatio-temporal fusion model for synthesizing ideal data, 2) a spatio-spectral observation model for urban vegetation biomass estimation, 3) a temporal-spectral observation model for urban flood mapping, and 4) a spatio-temporal-spectral model for impervious surface extraction. We believe that the proposed model, although in a conceptual stage, can largely benefit urban observation by providing a new data fusion paradigm.
1. Introduction
Nowadays, most people live in cities. The proportion of the population living in cities has risen from 5% in 1900 to 55% in 2018 (Hoole, Hincks, and Rae Citation2019). The United Nations (UN) World Urbanization Prospects estimated that more than two-thirds of the world population (close to 7 billion) would live in cities by 2050. Such a huge urban population poses great challenges to the land, ecological environment, and energy of the city. For example, by 2018, the global artificial impervious areas reached 797,076 km2, significantly increasing the risk of urban flooding (Gong et al. Citation2019). From another perspective, carbon emissions produced by cities account for about 75% of the whole carbon emissions in the world (Zhu et al. Citation2019). The UN has made sustainable cities as one of the 17 goals of the United Nations 2030 sustainable development agenda (Scott and Rajabifard Citation2017). To achieve this goal, it is necessary to collect various data that facilitate urban monitoring. Fortunately, remote sensing has become an effective means of data acquisition due to its advantages of fast, low cost, and wide range detection capability. However, compared with other thematic remote sensing techniques, urban remote sensing is much more difficult due to the diversity of observation objects, means, and purposes.
The objects in urban remote sensing observation are generally characterized by multi-dimension, multi-scale, and multi-mode. For multi-dimension, horizontal or/and vertical observation are both required in urban remote sensing observation. For example, the land cover classification might require only horizontal observation (Yan, Schultz, and Zipf Citation2019), but energy demand estimation, aiding positioning, and other similar applications, demand vertical observation (Li et al. Citation2019). Beyond that, when exploring the effect of urban structure on urban biophysical processes, horizontal and vertical observations are both required (Zhu et al. Citation2019). For multi-scale, objects in urban remote sensing observation can be divided into three scales: point, line, and plane, among which the image feature points belong to point scale (Shao, Chen, and Liu Citation2015), roads are line objects (Domingo, Thibaud, and Claramunt Citation2019), and impervious surfaces are plane objects (Shao et al. Citation2016). For multi-mode, the observed objects can be divided into two modes: static and time-sensitive objects, among which buildings belong to static targets (Shao et al. Citation2020b) and vehicles belong to time-sensitive objects. Moreover, due to the rapid urbanization process, urban land cover and land use are interchanging in a dynamic manner, especially in developing countries (e.g., China and India (Zhang, Weng, and Shao Citation2017)). In fact, dynamic land cover and land use in urban fabrics also belong to time-sensitive objects.
Due to the high heterogeneity of the urban environment, ground objects tend to be more fragmented. The problem of mixed pixels should not be ignored when using images with medium and low spatial resolution, which remains a challenging work in urban areas and demands higher spatial resolution images. However, higher spatial resolution images do not necessarily translate to higher precision outputs, given the existence of noises, such as microscopic features and socio-economic activities. For example, Li et al. explored the influence of spatial resolution on urban impervious surface extraction using Landsat TM (30 m) and SPOT (10 m) images (Li et al. Citation2011). They found that the overall accuracy of imperviousness estimation using Landsat TM data was considerably higher than that of using SPOT data. Beyond that, the homologous spectrum is another problem to be considered in urban remote sensing. At this point, images with a higher spectral resolution are required. To sum up, we argue that the ideal data for urban remote sensing is with higher spatial resolution and higher spectral resolution. However, in order to obtain the signal-to-noise ratio that meets the imaging requirements, higher spatial resolution and higher spectral resolution are, most of the time, a pair of inherent contradictions.
The purposes behind urban remote sensing observation are multi-faceted. For example, monitoring the status of land cover and land use, analyzing the driving factor of urbanization (Kabite, Muleta, and Awoke Citation2020), and exploring its interaction and coupling effect on the urban ecological environment are the common purposes (Nistor Citation2019; Tafesse and Suryabhagavan Citation2019). Monitoring the human and vehicle behaviors to retain the safety of urban traffic and the health of residents is also one important purpose of urban remote sensing (Almagbile Citation2019; Mohammed and Al-qaness Citation2019). Other purposes include deformation safety of urban infrastructure (Wang et al. Citation2017), energy consumption (Faroughi et al. Citation2020), to list a few. It is worth noting that each purpose corresponds to certain data requirements, increasing the difficulty of urban observation.
According to the above descriptions regarding the observation objects, means, and purposes, urban remote sensing needs to thoroughly consider information from three dimensions: temporal dimension, spatial dimension, and spectral dimension. Ideally, urban remote sensing observation requires data with a high temporal resolution, high spatial resolution, and high spectral resolution. To the best of our knowledge, however, no satellite owns all the above characteristics. Thus, it is necessary to coordinate data from existing remote sensing satellites to meet the needs of urban observation. But few studies have explored such issues in depth. In this study, we abstracted the observation process of urban remote sensing and proposed an urban spatio-temporal-spectral observation model, considering temporal, spatial, and spectral features as model inputs. The theoretical, methodological, and contextual knowledge this study offers is expected to largely benefit further urban remote sensing observation.
2. Overview of Earth observation programs
2.1. Earth resources technology satellite (ERTS)
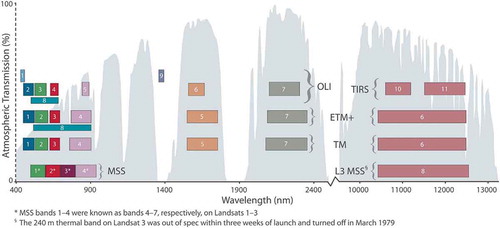
Back in the 1960s, William Pecora (Fischer Citation1966) envisioned the use of data collected from aircraft and spacecraft for practical resource purposes. In 1967, the Goddard Space Flight Center demonstrated the feasibility of implementing the ERTS, followed by a pre-design and hardware period. On 23 July 1972, the first Earth Resources Technology Satellite (ERTS-1) was launched to obtain data of the Earth’s surface for natural resources survey. It was renamed to “Landsat” in 1975. So far, eight Landsat series satellites have been launched, with only Landsat-7 and Landsat-8 currently in orbit. With the development of technology, the number of bands of Landsat images has increased from four to nine. The band range has become narrower, and the spectral quality has been greatly improved (). Continuity is the most important advantage of Landsat satellites, as they contain archived data for nearly 50 years. Thus, the Landsat series data has become an indispensable data source for earth observation and has been widely used in various fields, including land use and land cover (Xian, Homer, and Fry Citation2009), vegetation phenology (Senf, Seidl, and Hostert Citation2017), and urban hydrology (Shao et al. Citation2020a).
Figure 1. Landsat sensors, spectral channels, and band-passes, superimposed on atmospheric transmission percentage (gray background). MSS: Landsat-1 through −5; TM: Landsat-4 and −5; ETM+: Landsat-7; OLI and TIRS: Landsat-8. (Source: NASA/Landsat Legacy Project Team and American Society for Photogrammetry and Remote Sensing)
2.2. Earth observing system (EOS)
The EOS was conceived by National Aeronautics and Space Administration (NASA) in 1980s and began to take shape in the 1990s. Its primary initiative is to provide scientists with the earth information they needed to meet the goals set by the US Global Change Research Program (USGCRP) and the Intergovernmental Panel on Climate Change (IPCC) to develop a better understanding of our planet and to assist global policymakers in protecting and managing our environment and natural resources more effectively and efficiently (King, Herring, and Diner Citation1995). The missions of EOS revolve around the climate science areas, such as radiation, clouds, water vapor, precipitation, etc. The objectives of the EOS include: (1) establishing an integrated, sustained, and comprehensive program to observe the Earth on a global scale; (2) conducting focused and exploratory studies to improve understanding of the physical, chemical, biological and social processes that influence the Earth’s climate; (3) developing models of the Earth system to integrate and predict climate changes; (4) assessing impacts of natural events and human activities on the Earth’s climate.
2.3 Global Earth observation system of systems (GEOSS)
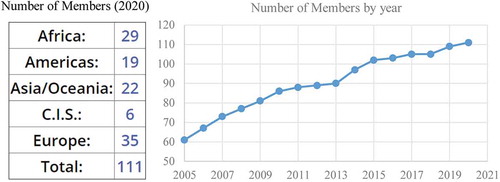
The GEOSS was launched by Group on Earth Observations (GEO) established in 2005 between the government of the multilateral cooperation mechanism of science and technology. Although GEO is not an official international organization, it has become the largest, most authoritative, and influential intergovernmental international organization in the field of Earth observation, with a total of 111 member countries to date (as shown in ). GEO aims to benefit mankind by supporting decision-making and action through integrated, coordinated, and sustainable earth observations, such as disaster prevention and reduction, energy and mineral resources management, food security and sustainable agriculture, and public health surveillance.
Figure 2. GEO numbers for the year 2020 and number of members by year (Source: http://www.earthobservations.org/geoss.php)
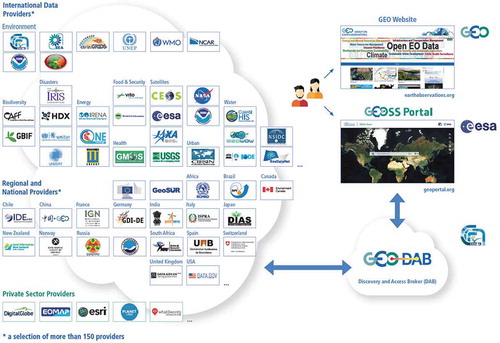
A key part of GEO’s missions is to build a system named GEOSS to better integrate observing systems and share data by connecting existing infrastructures. GEOSS is a set of coordinated, independent Earth observation, information, and processing systems that interact and provide access to diverse information for a broad range of users in both the public and private sectors. It aims to strengthen the Earth monitoring and facilitate information sharing from a large array of observing systems contributed by countries and organizations within GEO. shows the GEOSS platform. There are now more than 400 million open data resources in GEOSS from more than 150 national and regional providers. GEOSS’s first-decade strategic execution plan (2006–2015) has been completed, and the second-decade strategic implementation plan (2016–2025) is now underway.
Figure 3. The GEOSS platform. It proactively links existing and planned observing systems around the world (Source: http://www.earthobservations.org/geoss.php)
2.4 Copernicus program – the European Earth observation program
The Copernicus Program was renamed from Global Monitoring for Environment and Security (GMES). As a major space development jointly initiated by the European Commission and the European Space Agency, GMES was officially launched in 2003. Its main goals are to coordinate field observation data management and integration through the European and non-European countries (third party) existing and future satellite data to realize real-time dynamic monitoring of environment and safety and provide data for decision-makers, aiming to guarantee the sustainable development of the European and international competitiveness.
shows the launch schedule of the Copernicus Sentinel (S) satellites. There are currently seven satellites in orbit since the first Sentinel-1A was launched in 2014. By 2030, more than 20 satellites are planned to be in orbit. Taking advantage of the satellite networking technique, it aims to achieve near real-time observation worldwide once the full constellation is constructed.
Table 1. The launch schedule of copernicus sentinel satellites
2.5 Japanese Earth observing satellite program
The Japanese Earth observing satellite program consists of two series: (1) Marine Observation Satellite (MOS) and (2) land observation satellites. As Japan’s first Earth observation satellite, MOS-1 was launched in February 1987, which was designed to help fishermen track fish stocks, make accurate forecasts of ocean weather, and obtain oceanographic information. Following MOS-1, MOS-1b was launched in February 1989. Unfortunately, both satellites are no longer operational. Later on, Japan launched the JERS-1 and the Advanced Earth Observation satellites in 1992 and 1996, respectively. In cooperation with the United States, Japan launched the Tropical Rainfall Satellite in 1997. These satellites are designed for monitoring global and local climate change. After entering the twenty-first century, the study of global change sets new requirements for remote sensing data that highlight consistency. Thus, Japan launched the Advanced Land Observing Satellite (ALOS) on 24 January 2006, which contains three remote sensing instruments: The Panchromatic Remote-sensing Instrument that benefits Stereo Mapping (PRISM), the Advanced Visible and Near Infrared Radiometer type 2 (AVNIR-2) for precise land coverage observation, and the Phased Array type L-band Synthetic Aperture Radar (PALSAR) for day-and-night and all-weather land observation. Unfortunately, ALOS stopped working on 1 April 2011 due to the battery failure. However, its successor ALOS-2, was launched on 24 May 2014 to continue earth observations.
2.6 Chinese Earth observation satellite program
In the past few decades, China, as an essential member of the GEO, has been actively developing Earth observation technology and made some significant progress. By 2019, China has launched more than 200 Earth observation satellites, mainly including ZiYuan (ZY), GaoFen (GF), HuanJing (HJ), FengYun (FY, meteorological satellite) and HaiYang (HY, marine satellite). In urban remote sensing observations, ZY, GF, and HJ series satellites are the most commonly used satellites. In the following sessions, we described them in detail.
2.6.1 ZY series satellites
ZY series satellites are China’s Earth resources exploration satellites. The first-generation ZY satellite, ZY-1 (also known as Chi Na Brazil Earth Resource Satellite (CBERS-1)), was launched on 14 October 1999. It provides medium-resolution remote sensing images for the management and monitoring of agricultural, geological, hydrological, and environmental resources. Subsequently, China continued to launch a series of ZY-1 auxiliary satellites, such as CBERS-02, CBERS-02B, ZY1-02 C, CBERS-04, and ZY1-02D. In September 2000, October 2002, and November 2004, China launched the second-generation ZY satellites (i.e., ZY2-01, ZY2-02, and ZY2-03) to form an observation network. These satellites carried infrared and visible cameras, multi-spectral scanners, microwave radiometers, and multi-functional radar sensors, which can be used in various fields, such as land and resources exploration, environmental monitoring and protection, urban planning, and disaster prevention and mitigation. On 9 January 2012, China successfully launched the ZY-3, China’s first civilian high-resolution optical three-dimensional mapping satellite, providing three-dimensional information that fills the gap of stereo mapping in China (Li, Wang, and Jiang Citation2020). ZY-3 provides 2.1 m high-resolution stereo images and 6 m multi-spectral images covering the entire country. To decrease the revisit time, China launched ZY3-02 on 30 May 2016, forming an observation network with ZY3-01. The combination of ZY3-01 and ZY3-02 largely facilitates national stereoscopic mapping at 1:50,000 and 1:25,000 scale.
2.6.2 HJ series satellites
HJ series satellites target environmental and disaster monitoring. This series consists of two optical satellites (HJ-1A and HJ-1B) and a radar satellite (HJ-1 C). HJ-1A and HJ-1B were launched on 6 September 2008. HJ-1A satellite carried a 30 m resolution Charge-Coupled Device (CCD) camera and a 100 m resolution hyperspectral camera, with an imaging range of 700 km and 50 km, respectively. HJ-1B satellite was equipped with a 30 m CCD camera and a 150 m infrared multi-spectral camera, with an imaging range of 700 km and 720 km, respectively. HJ-1 C was launched on 19 November 2012 and equipped with S-band Synthetic Aperture Radar (SAR) with two working modes, namely strip mode and scan mode. Given the capability of large-scale, all-weather, all-day, dynamic monitoring from their multiple detection equipment, HJ-1 series satellites provide strong data support for emergency rescue, post-disaster rescue, and reconstruction work. All three satellites from the HJ series are currently in orbit.
2.6.3 GF series satellites
After decades of development, China has realized the technology of earth observation satellites with medium and low spatial resolution. In order to further meet the requirements of the national economic construction, social development, and national security, the Chinese government has listed GF Program in the national medium and long-term science and technology development plan outline in 2006 and implemented this program in 2010. GF series satellites are numbered from GF-1 to GF-7. By 2019, all missions have been completed. summarizes the key parameters of GF series satellites. Compared with the previously launched satellites, GF series satellites have numerous advantages. For example, GF-2 is China’s first civil optical high-resolution remote sensing satellite with a spatial resolution of meters level. GF-3 is China’s first C-band multi-polarization SAR satellite with a spatial resolution of 1 m. GF-4 is China’s first and the world’s highest resolution remote sensing satellite with geosynchronous orbit. GF-5 is China’s first hyperspectral satellite. GF-6 is China’s first optical remote sensing satellite for precision agriculture observation. GF-7 is China’s mapping satellite with the highest accuracy. The GF series satellites formed an earth observation system with high spatial resolution, high temporal resolution, and high spectral resolution. At present, these satellites are contributing to national security, resource survey and monitoring, environmental monitoring and evaluation, and fine management of urbanization.
Table 2. The key parameters of GF series satellites
In addition to the aforementioned Earth observation programs, there are other observation programs, such as the Global Atmospheric Watch, Array for Real-time Geostrophic Oceanography, and Global Precipitation Measurement Satellites Program. Similarly, these programs mainly focus on resource, environmental, atmospheric, and oceanic observations. To our best knowledge, there are no programs initially designed specifically for urban scenarios. Compared with the observation of a specific object, urban remote sensing observation is more complex, with the necessity of considering the temporal resolution, spatial resolution, and spectral resolution simultaneously. Due to the lack of special observing satellites for urban scenes, urban remote sensing observation can only be performed with the collaborative use of the existing satellite data based on the specific observation requirements.
3. Spatio-temporal-spectral observation model in urban remote sensing
Urban remote sensing observation is a complex but important task. Our previous discussion suggests that there is no special observation program initially designed for urban scenes. Therefore, urban remote sensing observation can only use data from existing satellites by considering temporal, spatial, and spectral features. To the best of our knowledge, there is no existing framework for remote sensing observation. In this section, we abstracted the urban remote sensing process and proposed an urban spatio-temporal-spectral observation model to provide a reference for urban remote sensing.
In remote sensing images, spatial features reflected by the spectral difference play an essential role in information extraction, especially for high spatial resolution images. In practice, the spatial resolution is the first feature that needs to be considered. When the spatial resolution meets the requirements, more spatial features can therefore be extracted. The commonly used spatial features include edge, shape, texture, height, and semantic features, to list a few, which can be expressed using the following formula:
where stands for the spatial features set,
,
,
,
and
represent the spatial features of edge, shape, texture, height, and semantic, respectively. These spatial features can be selected according to specific requirements. It is worth noting that if the spatial resolution is medium or low, the mixed-pixel issue should not be ignored.
Spectral features are important features in remote sensing images, reflecting the biochemical characteristics of ground objects. Different ground objects have different spectral signatures, which is the physical basis of remote sensing observation. However, in images with a lower spectral resolution, problems exist where the same objects are with different spectrums, and different objects are with the same spectrum. At this point, hyperspectral remote sensing that is able to obtain continuous and fine spectral curves of ground objects within a certain range is an effective way to solve this issue. The frequently used spectral features are shown in the following formula:
where stands for the pixel values of the spectral band,
represents the indexes derived from operations between the bands (e.g., Normalized Difference Vegetation Index (NDVI)). These two features are often extracted from multi-spectral images. The features
,
and
represent spectral derivative, spectral angle, spectral information divergence, and correlation coefficients, which are usually derived from hyperspectral images. Although hyperspectral images generally contain abundant spectral features, there may be strong correlations among features, resulting in severe information redundancy. Another limitation of hyperspectral remote sensing is its low spatial resolution.
Some tasks for urban monitoring, e.g., land use renewal, need to detect the changes of ground objects. In this case, the temporal resolution must be considered, and time-series images might be required. Therefore, many temporal features that benefit observations can be mined from time-series images. These features are shown in the following formula:
where and
are the spatial and spectral features at different times, respectively.
represents the dynamic time warping distance and
stands for the statistics features of time-series images (e.g., mean and variance).
In fact, urban remote sensing observation process is generally achieved by constructing appropriate models or algorithms based on the temporal, spatial, and spectral features of images. Therefore, we abstract the process as a spatio-temporal-spectral mode, where temporal, spatial, and spectral features serve as model inputs. Given different model outputs, an urban remote sensing observation model can be divided into two categories: 1) data quality improvement model and 2) information extraction model. The data quality improvement model refers to obtaining higher quality images by fusing multi-source data, which can be modeled as the following formula:
where represent multi-source images,
stands for fusion model, and
indicates the output of the model, i.e., images with higher quality.
Generally speaking, remote sensing images mainly contain spatial, spectral, and temporal features, which can be expressed by the following formula:
where stands for a remote sensing image,
,
and
represent the spatial, temporal, and spectral features set, respectively.
Given the difference in sensing techniques, multi-source images tend to focus only on a certain component. For example, high-resolution images own high spatial resolution but couples with low temporal and low spectral resolution. Therefore, the constraint relationship between multi-source images on each component should be established to fuse each component when a spatio-temporal-spectral observation model is constructed:
where is the feature constraint function and
is the fused image.
Furthermore, the output of spatio-temporal-spectral observation models can be information. Such a model with a specific task can be abstracted as:
where represent multi-source images,
stands for information extraction model, and
indicates the output of the model.
Similarly, under the constraint of task, features from three aspects (i.e., spatial, temporal, and spectral) can be extracted and further combined, thereby outputting useful information that benefits numerous urban monitoring tasks. This process can be expressed via the following formula:
where is the feature constraint function and
represents information extraction function.
Despite the rich spatial, temporal, and spectral features remote sensing images contain, not all of them are needed for specific tasks. We need to make certain choices based on urban observation tasks and purposes. In the following section, we further elaborate on the proposed model by presenting some applications.
4. Applications of urban spatio-temporal-spectral observation model
In this section, we gave four examples to elaborate on the specific applications of the proposed model. These applications included a spatio-temporal fusion model for synthesizing ideal data, a spatio-spectral observation model for urban vegetation biomass estimation, a temporal-spectral observation model for urban flood mapping, and a spatio-temporal-spectral model for impervious surface extraction.
4.1 Urban spatio-temporal fusion observation model
The temperature rise caused by urban heat island affects vegetation phenology. Exploring such effects is of high significance, as vegetation growth has a significant impact on water, energy, and carbon exchange, which in turn has important feedback on climate (Zipper et al. Citation2016). In phenological studies, the Moderate Resolution Imaging Spectroradiometer (MODIS) and the Advanced Very-High Resolution Radiometer (AVHRR) are the two most commonly used data given their ability to provide daily data for Earth surface observations (Ujoh, Igbawua, and Paul Citation2019). However, the spatial resolution of these data is very limited and cannot be applied directly to urban areas with high heterogeneity (Eliakim et al. Citation2013). With the availability of Landsat series satellites data by the United States Geological Survey (USGS) in 2008, they have quickly become a potential data source for urban phenology research, given their spatial resolution of 30 m and an 8-day revisit cycle. However, due to the influence of weather, light, and other limitations, the actual effective observation frequency of Landsat ranges from bi-weekly to bi-monthly or even less, falling short to meet the requirements of urban phenological study (Coops et al. Citation2012). Fortunately, with the launching of Sentinel-2 satellites in 2015, scholar started to combine Landsat and Sentinel-2 MSI to form a twin system, enabling intensive global observations with a revisit cycle of 2–3 days (Shao et al. Citation2019). However, the spatial resolution of these two satellites is inconsistent.
To address this problem, we proposed a spatio-temporal fusion model named super-resolution CNN (ESRCNN) to generate a new image with a finer spatial resolution of 10 m and a revisit cycle of 2–3 days (Shao et al. Citation2019). The spatio-temporal fusion model belongs to the first type of the proposed spatio-temporal-spectral model, i.e., data quality improvement model:
where represents Landsat-8 image acquired at time
,
represents Sentinel-2 image acquired at time
and
represents the fused image.
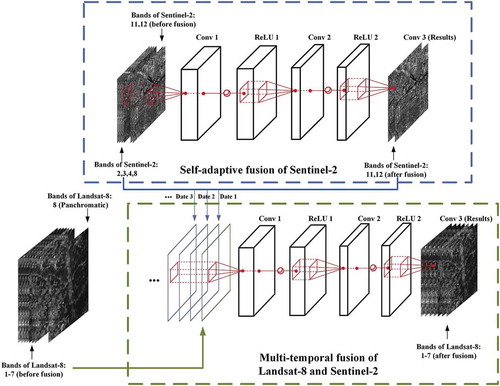
shows the structure of the ESRCNN model for fusing images from Landsat-8 and Sentinel-2 satellites. The ESRCNN model contains two major parts: a spatial resolution self-improving network for Sentinel-2 and a multi-temporal space fusion network for Landsat-8 and Sentinel-2 images. First, bands 2–4 (B, G, and R), 8 (NIR) of Sentinel-2 image with a resolution of 10 m and bands 11 and 12 of Sentinel-2 image resampled at 10 m using the nearest neighbor interpolation were input to the ESRCNN model, aiming to provide Sentinel-2 data with richer spectral and spatial information, and providing auxiliary data for the fusion in the second step. Second, the Landsat-8 bands 1–7 resampled at 10 m via the nearest neighbor interpolation, and Sentinel-2 data sets (bands 2–4, 8, 11–12 at 10 m) were input into the ESRCNN model to derive Landsat-8 images with a spatial resolution of 10 m. Note that our proposed fusion network can accommodate multi-temporal Sentinel-2 images (10 m) captured in relatively close days to the target Landsat-8 image as auxiliary data sets. More information about the spatio-temporal fusion model can be found in our previous study (Shao et al. Citation2019).
Figure 4. The structure of the ESRCNN model for fusing Landsat-8 and Sentinel-2 images. Conv represents the convolutional layer, and ReLU stands for the rectified linear unit(Shao et al. Citation2019)
shows the results of Landsat-8 fused with three-temporal Sentinel-2 images, respectively. From , we found that the spatial resolution of the fused results is considerably improved while the spectral information is well maintained. In addition, we observed changes in the land use and land cover due to the planting of crops from June 20 to 7 July 2017 (highlighted by the yellow circles in ). Although Sentinel-2 image on 7 July 2017 was also used as auxiliary data, the fused result did not present those changes. This indicates that the fusion model can identify the land use and land cover changes and then remove the spectral change related features inconsistent with the target image.
Figure 5. The multi-temporal fusion results (R: band 5, G: band 4, B: band 3). (a) – (c) are three 10 m Sentinel-2 images taken on June 20, June 27 and 7 July 2017. (d) – (f) are the original Landsat-8 reference image of 30 m and the fused Landsat-8 image of 30 m and 10 m on 15 June 2017, respectively (Shao et al. Citation2019)
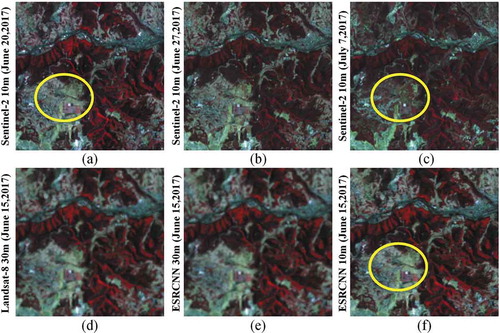
To sum up, by applying the proposed spatio-temporal fusion model, we can obtain images similar to Landsat-8 with a spatial resolution of 10 m and a temporal resolution of 2–3 days, thus providing effective data sources for urban remote sensing observations that demand both high temporal resolution and high spatial resolution.
4.2 Urban spatio-spectral observation model
Urbanization and urban vegetation are intertwined. Estimating the biomass of urban vegetation is conductive to understand vegetation growth, carbon assimilation process, and urban ecosystem (Mincey, Schmitt-Harsh, and Thurau Citation2013). Remote sensing technology has been widely used in vegetation biomass estimation by constructing the relationship between the features derived from remote sensing data and the measured biomass (Zhang et al. Citation2019; Shao, Zhang, and Wang Citation2017). However, previous studies in forest biomass tend to use medium- and low-resolution remote sensing images (e.g., Landsat and MODIS), which does not apply to dense urban fabrics as the characteristics of vegetation landscapes in urban areas are high heterogeneous. Therefore, it is necessary to use high spatial resolution images to estimate the urban vegetation biomass.
We selected Hengqin New District, Zhuhai City, Guangdong Province as study area and used WordView-3 and airborne Light Detection and Ranging (LiDAR) data to estimate the urban vegetation biomass. The height and canopy coverage of trees are closely related to biomass; therefore, three-dimensional spatial information is required. After referring to previous studies and our own experimentation, we selected 10 spatial features from three categories at the plot level from LiDAR data ().
Table 3. The features extracted from LiDAR data
In this study, a total of 22 features from WorldView-3 image were selected to estimate urban vegetation biomass, among which 14 were spectral features and eight were spatial features. The spectral features included reflectance from four bands and ten vegetation indices, and the spatial features included eight texture features (). We obtain the field biomass via the allometric equation.
Table 4. The features extracted from WroldView-3 images
In this study, we used a Random Forest (RF) algorithm to estimate the vegetation biomass. According to the above mentioned urban spatio-temporal-spectral observation model, the urban vegetation biomass estimation process can be modeled as follows:
where and
represent the selected spatial and spectral features.
represents the random forest algorithm.
denotes the above-ground biomass.
shows the biomass of Hengqin estimated by our proposed spatio-spectral observation model from 2009 to 2018. In this study, three indicators, i.e., coefficient of determination (R2), Root Mean Square Error (RMSE), and Relative Root Mean Square Error (RRMSE), were used to assess the accuracy of biomass estimation. The R22, RMSE and RRMSE of the proposed model are 0.6913, 26.98 Mg ha-1, and 0.4418 respectively, reflecting the effectiveness of the proposed model.
Figure 6. The biomass of Hengqin estimated by our proposed spatio-spectral observation model from 2009 to 2018
4.3 Urban temporal-spectral observation model
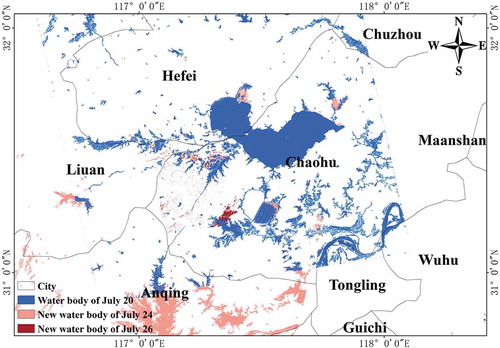
In July 2020, the Yangtze River watershed received intensive rains and caused massive flooding in the middle and lower reaches of the Yangtze River. Chaohu Lake, one of the five largest freshwater lakes in the middle and lower reaches of the Yangtze River with an area of 780 km2, experienced its highest water level in 150 years (13.43 m). The city of Hefei, surrounded by Chaohu Lake, is threatened with flooding. Therefore, monitoring the flooded area of Chaohu Lake is of great significance.
Due to the overcast during flood events, optical remote sensing sensors often fail to obtain effective data (Annis and Nardi Citation2019). As an active detector, SAR sensors are able to penetrate cloud cover, haze, dust and overcome other climatic conditions thanks to its long wavelength, which is not easily affected by meteorological conditions and sunshine level. Given these properties, SAR can observe the Earth in all-weather conditions and in both day night. Therefore, we selected SAR images to monitor the flooded area of Chaohu Lake in this study. Given the size of Chaohu Lake, the spatial resolution of the image does not need to be very high. Therefore, Radarsat-2 HH polarization image with 8 m spatial resolution was selected. According to the low backscatter coefficient of water bodies in SAR image, we used the thresholding method to extract the water bodies. We are also interested in monitoring the dynamics of water bodies so multi-temporal SAR images are required. According to EquationEquation (7)(7)
(7) and (Equation8
(8)
(8) ), the observation process can be expressed by the following equations:
where indicates the backscatter coefficient,
represents the backscatter coefficients of SAR image at time
.
and
respectively stand for the spectral and temporal features used in this study.
represents the threshold extraction function.
shows the extraction result of water bodies. Compared with July 20, the inundation area increased significantly on July 24. However, the inundation area did not notably expand, evidenced by the similar water body extent on July 24 and July 26. Such timely flood monitoring can provide policymakers with useful information to guide disaster response and mitigation.
Figure 7. The extraction result of water bodies
4.4 Urban spatio-temporal-spectral observation model of Earth-Ground collaboration
In urban areas, the existence of trees on both sides of the roads poses great challenge in impervious surface extraction, as it is impossible to judge whether the ground objects under the trees is impervious surface or not using aerial or aerospace remote sensing images alone. Recent advances in sensor technology and digitization have fostered some new data acquisition means, such as street view. The street view is a live-action mapping service that provides users with 360-degree panoramic views of a city, street, or other environments. The most commonly used street view maps include Google Street View, Baidu Street View, and Tencent Street View. Compared with remote sensing images, street view images have several merits. First, street view images record urban street-level scenes from the perspective of pedestrians, reflecting the facade information. Second, street view images have extensive spatial coverage and large data volume. For example, Baidu Street View covers 372 cities in China. Third, street view data collection is of high efficiency and low cost. Therefore, the combination of remote sensing data and street view data is expected to mitigate the occlusion problem of trees and shadows in the urban remote sensing observation.
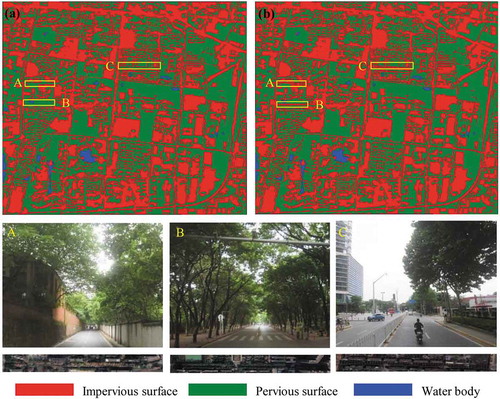
shows the comparison of impervious surface extraction results before and after combining street view images. In this example, we used GF-2 images with a spatial resolution of 2 m. We observed that using GF-2 images alone fails to extract the impervious surface accurately under the trees, as shown in region A, B, and C in . After combining the GF-2 with street view images, the impervious surface below the trees can be extracted effectively. However, we need to acknowledge that the street view images may not fully cover the entire study area. Thus, such a combination of satellite images and street views can only improve the impervious surface detection in areas where both data sources are available.
Figure 8. Comparison of impervious surface extraction results. (a) is the result of using remote sensing image alone, and (b) is the result of combing remote sensing image and street view image. The second and third lines correspond to street view images and remote sensing images of area A, B, and C in the results
5. Discussions
Due to the diversification of the purposes and objects in urban remote sensing observation, urban remote sensing has a relatively high requirement for data, with a preference for data with high spatial resolution, high temporal resolution, and high spectral resolution. Unfortunately, it is difficult to optimize all three types of resolution simultaneously due to technical bottlenecks of sensors. After reviewing the literature, we notice that there is no Earth observation program initially designed for urban scenes. Therefore, it is necessary to coordinate data from existing remote sensing satellites to meet the needs of urban observation.
To fill the aforementioned gap, we abstracted the urban remote sensing process and proposed an urban spatio-temporal-spectral observation model in this study. Illustrated by the applications in Section 4, we believe that the proposed model can largely benefit urban observation. First, we believe that the data requirements of the specific task of urban remote sensing observation should be carefully analyzed. Second, we need to prioritize resolution metrics. When certain resolution metrics meet the requirements, other relevant features can be further considered. Third, when the existing data do not meet the application requirements, we need to consider synthesizing new images to meet the requirements by means of image fusion, where the scale inconsistency among different images should not be ignored. Fourth, we need to mine the features of the observed objects from the three dimensions of time, space, and spectrum. The proposed model is a conceptual model now. In the future, we expect that specific feature constraint rules can be established given different observation requirements so as to specifically guide the selection of features and the construction of models.
6. Conclusions and prospects
Cities contain complex types of land use and land cover. Urban remote sensing needs to reflect the dynamics in complex urban fabrics by obtaining images with high spatial resolution, high spectral resolution, and high temporal resolution. To the best of our knowledge, however, no satellite sensors own all the above characteristics. Thus, it is necessary to coordinate data from existing remote sensing satellites to meet the needs of urban observation. In this study, we abstracted the urban remote sensing observation process and proposed an urban spatio-temporal-spectral observation model, filling the gap of no existing urban remote sensing framework. In this study, we present four applications to elaborate on the specific applications of the proposed model: 1) a spatio-temporal fusion model for synthesizing ideal data, 2) a spatio-spectral observation model for urban vegetation biomass estimation, 3) a temporal-spectral observation model for urban flood mapping, and 4) a spatio-temporal-spectral model for impervious surface extraction. We believe that the proposed model, although in a conceptual stage, can largely benefit urban observation by providing a new data fusion paradigm.
With hundreds and thousands of communication, navigation, and remote sensing satellites in space, we should acknowledge the importance of real-time and intelligent information services for remote sensing data fusion. In the future, the Internet for Satellites and the Internet of things for satellites should be further developed to contribute to the harmonious and sustainable development of human beings and cities.
Acknowledgments
The authors are sincerely grateful to the editors as well as the anonymous reviewers for their valuable suggestions and comments that helped us improve this paper significantly. Thanks sincerely to Ya Zhang, Xiaoxiao Feng, Hongping Zhang and Zhiqiang Wang for their help with this paper. Finally, we would like to express our special thanks to Prof. Xiao Huang of the University of Arkansas for his work in improving this manuscript.
Data Availability Statement
The data that support the findings of this study are available from the corresponding author, upon reasonable request.
Additional information
Funding
Notes on contributors
Zhenfeng Shao
Zhenfeng Shao received the PhD degree in photogrammetry and remote sensing from Wuhan University in 2004. Since 2009, he has been a Full Professor with the State Key Laboratory of Information Engineering in Surveying, Mapping and Remote Sensing (LIESMARS), Wuhan University. He has authored or coauthored over 70 peer-reviewed articles in international journals. His research interests include high-resolution image processing, pattern recognition, and urban remote sensing applications. Since 2019, he has served as an Associate Editor of the Photogrammetric Engineering & Remote Sensing (PE & RS) specializing in smart cities, photogrammetry and change detection. He was the recipient of the Talbert Abrams Award for the Best Paper in Image matching from the American Society for Photogrammetry and Remote Sensing in 2014, the New Century Excellent Talents in University from the Ministry of Education of China in 2012.
Wenfu Wu
Wenfu Wu received his master’s degree in photogrammetry and remote sensing from Wuhan University in 2019. He is now pursuing his PhD degree in photogrammetry and remote sensing at Wuhan University. His research interests include Synthetic Aperture Radar (SAR) image despeckling, the fusion of optical and SAR images, and the applications of deep learning in remote sensing.
Deren Li
Deren Li is a scientist in photogrammetry and remote sensing, and also enjoys dual membership of both the Chinese Academy of Sciences and the Chinese Academy of Engineering. He is a “National Level Young and Middle-aged Expert with Outstanding Contribution”, member of the Euro-Asia International Academy of Science, member of the 9th National Committee of the Chinese People’s Political Consultative Conference (CPPCC), At present, he is Professor and PhD supervisor of Wuhan University.
References
- Almagbile, A. 2019. “Estimation of Crowd Density from UAVs Images Based on Corner Detection Procedures and Clustering Analysis.” Geo-spatial Information Science 22 (1): 23–34. doi:https://doi.org/10.1080/10095020.2018.1539553.
- Annis, A., and F. Nardi. 2019. “Integrating VGI and 2D Hydraulic Models into a Data Assimilation Framework for Real Time Flood Forecasting and Mapping.” Geo-spatial Information Science 22 (4): 223–236. doi:https://doi.org/10.1080/10095020.2019.1626135.
- Coops, N. C., T. Hilker, C. W. Bater, M. A. Wulder, S. E. Nielsen, G. McDermid, and G. Stenhouse. 2012. “Linking Ground-based to Satellite-derived Phenological Metrics in Support of Habitat Assessment.” Remote Sensing Letters 3 (3): 191–200. doi:https://doi.org/10.1080/01431161.2010.550330.
- Domingo, M., R. Thibaud, and C. Claramunt. 2019. “A Graph-based Approach for the Structural Analysis of Road and Building Layouts.” Geo-spatial Information Science 22 (1): 59–72. doi:https://doi.org/10.1080/10095020.2019.1568736.
- Eliakim, H., V. Jan, R. Gerbert, and H. Martin. 2013. “Trends in Spring Phenology of Western European Deciduous Forests.” Remote Sensing 5 (12): 6159–6179. doi:https://doi.org/10.3390/rs5126159.
- Faroughi, M., M. Karimimoshaver, F. Aram, E. Solgi, A. Mosavi, N. Nabipour, and K.-W. Chau. 2020. “Computational Modeling of Land Surface Temperature Using Remote Sensing Data to Investigate the Spatial Arrangement of Buildings and Energy Consumption Relationship.” Engineering Applications of Computational Fluid Mechanics 14 (1): 254–270. doi:https://doi.org/10.1080/19942060.2019.1707711.
- Fischer, W. A. 1966. “The EROS (Earth Resources Observation Satellite) Program Of The Department Of The Interior.” American Journal of Obstetrics and Gynecology 172 (6): 281. doi:https://doi.org/10.2118/2703-MS.
- Gong, P., L. Xuecao, J. Wang, Y. Bai, and Y. Zhou. 2019. “Annual Maps of Global Artificial Impervious Area (GAIA) between 1985 and 2018.” Remote Sensing of Environment 236. doi:https://doi.org/10.1016/j.rse.2019.111510.
- Hoole, C., S. Hincks, and A. Rae. 2019. “The Contours of a New Urban World? Megacity Population Growth and Density since 1975.” Town Planning Review 90 (6): 653–678. doi:https://doi.org/10.3828/tpr.2019.41.
- Kabite, G., M. Muleta, and B. Awoke. 2020. “Spatiotemporal Land Cover Dynamics and Drivers for Dhidhessa River Basin (DRB), Ethiopia.” Modeling Earth Systems and Environment 6: 1089–1103. doi:https://doi.org/10.1007/s40808-020-00743-8.
- King, M. D., D. D. Herring, and D. J. Diner. 1995. “The Earth Observing System: A Space-based Program for Assessing Mankind’s Impact on the Global Environment.” Optics and Photonics News 6 (1): 34–39. doi:https://doi.org/10.1364/OPN.6.1.000034.
- Li, D., M. Wang, and J. Jiang. 2020. “China’s High-resolution Optical Remote Sensing Satellites and Their Mapping Applications.” Geo-spatial Information Science 1–10. doi:https://doi.org/10.1080/10095020.2020.1838957.
- Li, G., J. Zhao, V. Murray, C. Song, and L. Zhang. 2019. “Gap Analysis on Open Data Interconnectivity for Disaster Risk Research.” Geo-spatial Information Science 22 (1): 45–58. doi:https://doi.org/10.1080/10095020.2018.1560056.
- Li, W., Z. Ouyang, W. Zhou, and Q. Chen. 2011. “Effects of Spatial Resolution of Remotely Sensed Data on Estimating Urban Impervious Surfaces.” Journal of Environmental Sciences 23 (8): 1375–1383. doi:https://doi.org/10.1016/S1001-0742(10)60541-4.
- Mincey, S. K., M. Schmitt-Harsh, and R. Thurau. 2013. “Zoning, Land Use, and Urban Tree Canopy Cover: The Importance of Scale.” Urban Forestry & Urban Greening 12 (2): 191–199. doi:https://doi.org/10.1016/j.ufug.2012.12.005.
- Mohammed, A., and A. Al-qaness. 2019. “Device-free Human Micro-activity Recognition Method Using WiFi Signals.” Geo-spatial Information Science 22 (2): 128–137. doi:https://doi.org/10.1080/10095020.2019.1612600.
- Nistor, M.-M. 2019. “Vulnerability of Groundwater Resources under Climate Change in the Pannonian Basin.” Geo-spatial Information Science 22 (4): 345–358. doi:https://doi.org/10.1080/10095020.2019.1613776.
- Scott, G., and A. Rajabifard. 2017. “Sustainable Development and Geospatial Information: A Strategic Framework for Integrating a Global Policy Agenda into National Geospatial Capabilities.” Geo-spatial Information Science 20 (2): 1–18. doi:https://doi.org/10.1080/10095020.2017.1325594.
- Senf, C., R. Seidl, and P. Hostert. 2017. “Remote Sensing of Forest Insect Disturbances: Current State and Future Directions.” International Journal of Applied Earth Observation & Geoinformation 60: 49–60. doi:https://doi.org/10.1016/j.jag.2017.04.004.
- Shao, Z., J. Cai, F. Peng, H. Leiqiu, and T. Liu. 2019. “Deep Learning-based Fusion of Landsat-8 and Sentinel-2 Images for a Harmonized Surface Reflectance Product”. Remote Sensing of Environment, no. 235. doi:https://doi.org/10.1016/j.rse.2019.111425.
- Shao, Z., M. Chen, and C. Liu. 2015. “Feature Matching for Illumination Variation Images.” Journal of Electronic Imaging 24 (3): 033011. doi:https://doi.org/10.1117/1.JEI.24.3.033011.
- Shao, Z., F. Huyan, L. Deren, A. Orhan, and T. Cheng. 2020a. “Remote Sensing Monitoring of Multi-scale Watersheds Impermeability for Urban Hydrological Evaluation.” Remote Sensing of Environment 232. doi:https://doi.org/10.1016/j.rse.2019.111338.
- Shao, Z., F. Huyan, F. Peng, and L. Yin. 2016. “Mapping Urban Impervious Surface by Fusing Optical and SAR Data at the Decision Level.” Remote Sensing 8 (11): 945. doi:https://doi.org/10.3390/rs8110945.
- Shao, Z., P. Tang, Z. Wang, N. Saleem, S. Yam, and C. Sommai. 2020b. “BRRNet: A Fully Convolutional Neural Network for Automatic Building Extraction from High-Resolution Remote Sensing Images.” Remote Sensing 12: 1050. doi:https://doi.org/10.3390/rs12061050.
- Shao, Z., L. Zhang, and L. Wang. 2017. “Stacked Sparse Autoencoder Modeling Using the Synergy of Airborne LiDAR and Satellite Optical and SAR Data to Map Forest Above-Ground Biomass.” IEEE Journal of Selected Topics in Applied Earth Observations & Remote Sensing 10: 5569–5582. doi:https://doi.org/10.1109/JSTARS.2017.2748341.
- Tafesse, B., and K. V. Suryabhagavan. 2019. “Systematic Modeling of Impacts of Land-use and Land-cover Changes on Land Surface Temperature in Adama Zuria District, Ethiopia.” Modeling Earth Systems and Environment 5: 805–817. doi:https://doi.org/10.1007/s40808-018-0567-1.
- Ujoh, F., T. Igbawua, and M.O. Paul. 2019. “Suitability Mapping for Rice Cultivation in Benue State, Nigeria Using Satellite Data.” Geo-spatial Information Science 22 (4): 332–344. doi:https://doi.org/10.1080/10095020.2019.1637075.
- Wang, Y., X. X. Zhu, B. Zeisl, and M. Pollefeys. 2017. “Fusing Meter-Resolution 4-D InSAR Point Clouds and Optical Images for Semantic Urban Infrastructure Monitoring.” IEEE Transactions on Geoscience and Remote Sensing 55 (1): 14–26. doi:https://doi.org/10.1109/TGRS.2016.2554563.
- Xian, G., C. Homer, and J. Fry. 2009. “Updating the 2001 National Land Cover Database Land Cover Classification to 2006 by Using Landsat Imagery Change Detection Methods.” Remote Sensing of Environment 113 (6): 1133–1147. doi:https://doi.org/10.1016/j.rse.2010.02.018.
- Yan, Y., M. Schultz, and A. Zipf. 2019. “An Exploratory Analysis of Usability of Flickr Tags for Land Use/land Cover Attribution.” Geo-spatial Information Science 22 (1): 12–22. doi:https://doi.org/10.1080/10095020.2018.1560044.
- Zhang, L., Q. Weng, and Z. Shao. 2017. “An Evaluation of Monthly Impervious Surface Dynamics by Fusing Landsat and MODIS Time Series in the Pearl River Delta, China, from 2000 to 2015.” Remote Sensing of Environment 201: 99–114. doi:https://doi.org/10.1016/j.rse.2017.08.036.
- Zhang, L., Z. Shao, J. Liu, and Q. Cheng. 2019. “Deep Learning Based Retrieval of Forest Aboveground Biomass from Combined LiDAR and Landsat 8 Data.” Remote Sensing 11 (12): 1459. doi:https://doi.org/10.3390/rs11121459.
- Zhu, Z., K. C. Yuyu Zhou, E. C. Seto, C. D. Stokes, S. T. A. Pickett, and T. Hannes. 2019. “Understanding an Urbanizing Planet: Strategic Directions for Remote Sensing.” Remote Sensing of Environment 228: 164–182. doi:https://doi.org/10.1016/j.rse.2019.04.020.
- Zipper, S. C., J. Schatz, A. Singh, C. J. Kucharik, P. A. Townsend, and S. P. Loheide. 2016. “Urban Heat Island Impacts on Plant Phenology: Intra-urban Variability and Response to Land Cover.” Environmental Research Letters 11 (5): 054023. doi:https://doi.org/10.1088/1748-9326/11/5/054023.