
 ?Mathematical formulae have been encoded as MathML and are displayed in this HTML version using MathJax in order to improve their display. Uncheck the box to turn MathJax off. This feature requires Javascript. Click on a formula to zoom.
ABSTRACT
Building façades can feature different patterns depending on the architectural style, functionality, and size of the buildings; therefore, reconstructing these façades can be complicated. In particular, when semantic façades are reconstructed from point cloud data, uneven point density and noise make it difficult to accurately determine the façade structure. When investigating façade layouts, Gestalt principles can be applied to cluster visually similar floors and façade elements, allowing for a more intuitive interpretation of façade structures. We propose a novel model for describing façade structures, namely the layout graph model, which involves a compound graph with two structure levels. In the proposed model, similar façade elements such as windows are first grouped into clusters. A down-layout graph is then formed using this cluster as a node and by combining intra- and inter-cluster spacings as the edges. Second, a top-layout graph is formed by clustering similar floors. By extracting relevant parameters from this model, we transform semantic façade reconstruction to an optimization strategy using simulated annealing coupled with Gibbs sampling. Multiple façade point cloud data with different features were selected from three datasets to verify the effectiveness of this method. The experimental results show that the proposed method achieves an average accuracy of 86.35%. Owing to its flexibility, the proposed layout graph model can deal with different types of façades and qualities of point cloud data, enabling a more robust and accurate reconstruction of façade models.
1. Introduction
Advanced three-dimensional (3D) building models, along with detailed and computable information, play an important role in urban planning, thermal performance evaluation, and virtual reality, among other applications (Li, Wang, and Jiang Citation2021). In such building models, semantic façade models are key constituents. Unlike 3D solid models, which are solely used for visualization, semantic façade models indicate the location and label of each façade element and help identify the geometric and topological relationships among these elements. In this regard, the task of reconstructing a semantic façade model is considerably more difficult than semantic segmentation, which automatically extracts semantic façade entities from images or laser point clouds but does not describe their relationships (Salas Citation2020; Shan et al. Citation2020) To establish a common standard of storage and exchange for this type of model, the Open Geospatial Consortium introduced the CityGML (Gröger and Plümer Citation2012). Detailed façade information can be defined by Levels of Detail 3 (LoD3), which include the appearance, 3D geometry, and topology of façade entities.
The difficulty in automatically reconstructing semantic façade models can be ascribed to two factors. First, façade observations are often noisy, leading to a rough result of semantic entity extraction. Data-driven methods, such as dynamic programming (Cohen, Schwing, and Pollefeys Citation2014), conditional random field (Gadde et al. Citation2017), Restricted Boltzmann machine (Fathalla and Vogiatzis Citation2017), are difficult to completely eliminate the interference of noise, resulting in the detection results of facade elements with fuzzy boundaries and missing details. Even when using state-of-the-art deep learning methods, their robustness remains unreliable (Qi et al. Citation2017; Su et al. Citation2018; Zhang et al. Citation2019; Hensel, Goebbels, and Kada Citation2019). Recently, researchers have been attempted to improve the problems from the perspective of multi-source data integration. Lin et al. (Citation2019) use thermal infrared imager to obtain heat distribution of facade. With combination of image features, a high robustness facade element extraction model is developed. The use of thermal imager equipment, requires a large of labor and time costs in large-scale modeling. By improving the distortion correction method of panoramic images, Zhu et al. (Citation2020) excavate reliable information of building facades from panoramic photos. However, this method does not fundamentally solve noisy problem in images. Hu et al. (Citation2020) take advantage of regularized arrangement of facade elements in street-view images, and transform the alignment of facade elements into binary integer programming, which optimizes the position accuracy of facade elements and improves computational efficiency. In fact, facade element extraction still relies on deep learning method, such as YOLO v3 (Redmon and Farhadi Citation2018), which cannot solve the occlusion problem. Wu et al. (Citation2020) collected street-view images from search engines, social media, and mobile phones, and extracted facade information by constructing image point cloud. This method lacks the ability to extract semantic information on facades.
The second factor is the complexity and diversity of the façade structures themselves, which makes it difficult to describe façades structure with different styles in a flexible manner. Existing methods such as those based on façade grammar are often unable to derive façade structures. (Martinovic and Van Gool Citation2013; Weissenberg et al. Citation2013; Gadde, Marlet, and Paragios Citation2016; Dehbi et al. Citation2017). This is because the above methods have a consistent understanding of facade structure, that is, the facade structure is a combination of simple geometric elements. In fact, whether from the perspective of architectural construction or architectural design, the structure of facade is not determined by simple geometric or topological rules. It is affected by the design expectation of client, the style of architectural designer and the environmental conditions. The excavation of structure characteristics should not be based on the surface morphology, but should be combined with the causes of facade structure, the implied esthetic and people’s cognitive law.
In this regard, we propose a novel façade structure description method, i.e. facade layout graph model. The proposed approach is based on Gestalt principles (Koffka Citation1935; Schwartz and Krantz Citation2017) and the Principle of architectural form (Flemming Citation1990; Doersch et al. Citation2012; Jennath and Nidhish Citation2016). Based on Gestalt principles, visually similar elements (i.e. those with similar shapes, labels, and sizes) can be grouped as a cluster. This cluster then serves as a node of the graph. Moreover, the Principle of architectural form enables the theoretical interpretation of architectural knowledge and the esthetic design of façade structures. In this method, considering the application of topological graphs, we use a few parameters to represent the attributes of semantic entities (through nodes) and the topological relationships among them (through edges). Moreover, nodes formed using Gestalt principles can represent multiple entities by sharing attributes. Façades must be designed considering human suitability and environmental factors, such as lighting and energy saving, in order to ensure appropriate architectural functionality. Moreover, codes and directives have been stipulated to control the shape and size of façade elements in most countries or organizations (e.g. (MHCLG Citation2019)). We set the parameter domains based on these codes and directives.
As the primary contribution of this study, the proposed method deduces and reconstructs semantic facade model with low quality of data and complicated façade structure. By integrating the parameterized layout graph model using prior knowledge, we apply simulated annealing (Metropolis et al. Citation1953) to achieve non-convex optimization within a high-dimensional space. Moreover, Gibbs sampling coupled with simulated annealing (Geman and Geman Citation1984) is used to obtain a new candidate solution within the appropriate parameter domain.
The remainder of this paper is organized as follows. In Section 2, we introduce and discuss existing semantic façade reconstruction methods and related works. Subsequently, we present the detailed construction of the proposed layout graph model in Section 3.1, and the corresponding parameter configuration in Section 3.2. The optimal layout of the point cloud inference algorithms is presented in Section 3.3. The experimental results and analyses are discussed in Section 4. Lastly, the conclusions of this study are presented in Section 5.
2. Related work
Several studies have focused on semantic façade reconstruction. Instead of using machine learning methods to improve semantic segmentation accuracy, we reconstruct façade structures by exploring the geometric and topological relationship of the façade structure.
2.1. Grammar designing
Methods based on façade grammar, which include split grammar (Wonka et al. Citation2003), CGA shape grammar (Müller et al. Citation2007), and developed formal grammar (Ripperda and Brenner Citation2006, Citation2009), are closely related to the proposed methodology. The advantage of façade grammar is that it can describe a façade structure by designing a set of production rules (Alegre and Dellaert Citation2004; Becker Citation2009), benefiting from the fact that façades, being man-made objects, have regular shapes (rectangular, circular, triangular, etc.) and repetitive patterns. Using façade grammar, a façade structure can be split into numerous basal tiles using a split line, and each basal tile contains the semantic label and shape of the façade element. Horizontal and vertical production rules are used to derive these split lines. For example, the rule splitting the left-hand non-terminal symbol “floor” into “window” and “remaining_floor” with a vertical split line “v” at the position (85, 30). Either the optimization method or the learned probability distribution should govern the selection of the production rules and splitting positions when reconstructing a semantic façade model.
2.2. Grammar optimization method
Ripperda and Brenner (Citation2006) transformed façade grammar into the form of a parameter set and adopted the reversible-jump Markov chain Monte Carlo method to search for optimal combinations of the production rules from high-dimensional parameter spaces. This method is considerably time-consuming owing to the large parameter spaces involved. To reduce computational complexity, Koutsourakis et al. (Citation2009) used a Markov random field to guide the optimization process. This method uses a sequence of three rules – an extrusion, a vertical split operator, and a horizontal split operator – to decompose formal grammar into graphical models. Thereafter, efficiency is improved using intrinsically decoupling optimization. Teboul et al. (Citation2011) employed the hierarchical Markov decision process to phrase 1D grammar parsing problem. Reinforcement learning (RL) can be used sequentially to determine the optimal solution of rule combinations. Riemenschneider et al. (Citation2012) used irregular grids to parse complex shape grammar and the pixel-wise classifier to extract the position of label transitions; thus, an initial irregular grid could be determined. Using the Cocke–Younger–Kasami (CYK) algorithm, the rationality of attribute assignment for each grid can be ensured. Cao et al. (Citation2017) improved the efficiency and accuracy of the procedure of solving the Markov decision process using high-level topology optimization. The abovementioned optimization methods function efficiently under the premise of designing specific grammar rules to achieve precise reconstruction. However, the designed production rules need to be simple because the optimization process typically necessitates large computing times to ensure convergence.
2.3. Learning grammar
The concept of learning grammar production probability was further developed to obtain more flexible grammar rules. This concept is extended from the field of natural language processing. As this method requires a treebank, it is necessary to convert façades with ground truth into parsing trees in order to form datasets; this is a heuristic method for façade parsing. Martinovic and Van Gool (Citation2013) used the Bayesian model merging method to refine grammar parsing trees using labeled façade images. Repeated and redundant grammar rules are reorganized such that trees with a clear hierarchy can be created depending on different façade styles. Weissenberg et al. (Citation2013) proposed a method for the automated learning of façade grammar; this method involved three steps: compression, comparison, and virtual façade synthesis. A minimum description length was used to ensure the validity of synthetic grammar. Gadde, Marlet, and Paragios (Citation2016) used RL to analyze façade grammar, using which a less arbitrary and more systematic parsing tree could be generated. Dehbi et al. (Citation2017) used statistical relational learning to automatically learn weighted attribute context-free grammar, which enforces the robustness of reconstructing complex façades. However, this method is limited by the façade style selected in the training set; as it is a supervised learning method, datasets containing different façade styles cannot be mixed.
2.4. Structure deducing
Approaches for deducing façade structures have also been proposed. For example, Zhang et al. (Citation2013) reconstructed façade structures by leveraging their symmetry. Fan et al. (Citation2015) proposed a layout grid for describing a façade structure, and Liu et al. (Citation2019) used the Kronecker Product to model the repetitive patterns of façades. Recently, Li et al. (Citation2020) used several rules to improve the geometric correctness of reconstructing façades from unstructured 3D point clouds. Apart from the abovementioned approaches, methods for detecting façade openings have also been proposed (Zolanvari, Laefer, and Natanzi Citation2018; Xia and Wang Citation2019). However, despite being able to achieve façade reconstruction, these approaches do not adequately account for the structural differences in façades; in these methods, façades are reconstructed solely from selected datasets.
2.5. Graph model
The proposed method focuses on the geometric and topological relationships among façade elements, which are represented using a compound graph. This approach is partially inspired by the attribute parsing graph (Han and Zhu Citation2005; Schmittwilken et al. Citation2009). In an attribute graph, each element is indexed by the spatial relations among surrounding elements. By defining bottom-up generation rules, the entire structure can be deduced from elements in a Bayesian framework. However, validated applications of such attribute graphs involve consistent shapes and structures, such as the detection of Manhattan world structure (Liu, Zhao, and Zhu Citation2018) and human pose estimation (Park, Nie, and Zhu Citation2017). For this task, façade structures need to be described in a more flexible manner due to their complexity and variety. Xiong, Elberink, and Vosselman (Citation2014) and Xiong et al. (Citation2015) introduced a flexible roof topological graph for reconstructing building roofs, which is similar to the method proposed herein. The proposed layout graph model, based on the abovementioned works, is introduced in Section 3.
3. Layout graphs for reconstructing semantic façade models
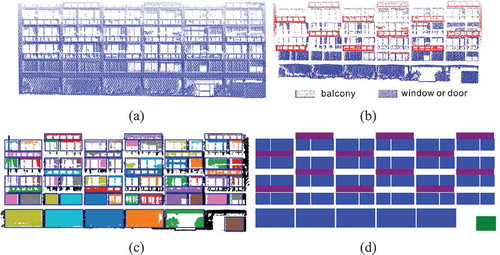
This study aims to reconstruct a semantic façade model using a point cloud. Given the unevenness of façade point clouds, we implement reconstruction using a novel framework (). Under this framework, we first segment façade components using the RANdom SAmple Consensus (RANSAC) method (Fischler and Bolles Citation1981). Similar to the works of Tuttas and Stilla (Citation2013) and Nguatem, Drauschke, and Mayer (Citation2014), coarse outlines of windows and doors were extracted by detecting edges and the direction of inliers. In our experiment, the coarse outlines of balconies could also be extracted by setting a direction of outlier. This was possible because windows are often indentations in the façade, whereas balconies protrude from the façade. To measure the coherence between components and the layout graph model, we project the refined façade structure onto a 2D plane. Depending on the size of the façade, three initial layout graph models of the window, balcony, and door are generated randomly. These models should conform with prior knowledge determined using the Principle of architectural form. By integrating these initial models with the extracted components, we can obtain the joint-prior probability and likelihood corresponding to the three components. On this basis, the problem of searching for an optimal configuration of the layout graph model can be formulated as Maximum A Posteriori (MAP) estimate Owing to the high-dimensional parameter space, instead of performing the MAP calculation directly, optimization is first carried out through simulated annealing coupled with a Gibbs sample, which corresponds to optimization within the Bayesian frame.
Figure 1. Overall workflow of the proposed framework
3.1. Layout graph model
Owing to its simple and flexible characteristics, we use the graph model to describe façade structures. The classical graph model is defined as , where V denotes the vertex of the graph, which is composed of objects with similar attributes, and E is the edge formed by connecting two vertices, which represents the geometric and topological relationship between these vertices (Kilgour and Hipel Citation2005). From the perspective of building reconstruction, a few methods applying this graph model to describe repetitive building components have been proposed. For instance, by considering each facet on the roof to be identical, a topological roof graph can be created Xiong et al. (Citation2015). In addition, some studies (Fan et al. Citation2015; Li et al. Citation2020) have described façade structures using topological graphs, focusing solely on basic façade elements such as windows. However, deriving façade structures using these methods is significantly complicated, because several constraints such as horizontal alignment, vertical alignment, array arrangement, and symmetry need to be satisfied.
Façades feature hierarchical structures depending on the Principle of architectural form. For example, the floor has a higher level than windows or balconies when considered as a semantic entity. Thus, when specifying the location of a window, we typically first specify the floor on which it lies. In this regard, the conventional graph is inadequate in terms of depicting hierarchical structures in the façade. Thus, we introduce a hierarchical graph model representing large and complicated structures; such graphs are typically termed as compound graphs (Sugiyama and Misue Citation1991; Dogrusoz et al. Citation2004). The advantage of a compound graph is that it describes a graph model that employs a node to represent a sub-graph. We exploit a compound graph model to describe the hierarchical façade layout and call it the façade layout graph model.
For the façade in , we have drawn a façade layout graph model with a two-level compound graph. The first level graph is termed Top Layout Graph (TLG) as it represents the floor layout. When elements on adjacent floors are similar, they can be grouped into a cluster according to the “Law of Proximity”, included in Gestalt principles. For example, the red node in represents the first three floors with the same attributes, and the green node represents the last two similar floors. Thus, a TLG is formed, and we denote it as , where Vt is a set of nodes; in this case, it contains two different nodes. The attributes of a node in Vt can be “sf”, “wf”, “hf”, “hgap”, “wb”, and “DLG” detailed descriptions are presented in . Et represents the geometric relationship among the nodes in Vt. In particular, it refers to the connection of different floors, which can be reflected in the 3D shape of a façade.
Figure 2. Façade layout graph and attributes
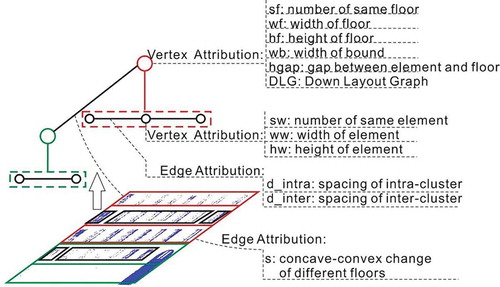
The second level graph is called the Down Layout Graph (DLG), representing the layout of façade elements. Each node in this graph can be generated from an element cluster consisting of one or more façade elements. The determination of an element cluster can be based on the “Law of Proximity” or the “Law of Similarity”, included in Gestalt principles. The edge in the DLG is represented by a collection of intra- and inter-cluster spacings. Accordingly, the DLG can be represented by .
, where “n” represents the number of nodes. The attributes of each node consist of a tuple of three items, such as
, as shown in . An edge is composed of two items, namely
, where “d_intra” have two types of values 0 and d2(n-1), which represents the intra-cluster spacing of the n-th node, and “d_inter” has one value d(2n-1), which is the inter-cluster spacing between two nodes connected by an edge. It should be noted that each cluster has an intra-cluster spacing. When there is only one element in a node, its intra-cluster spacing is set to 0.
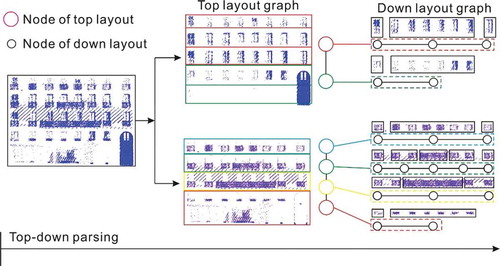
To describe a façade structure in the form of a layout graph model, we parse it using a top-down process, as shown in . First, we segment the refined façade into three components: windows, balconies, and doors. Considering the intrinsic connection of windows and balconies, we analyze their layout based on a potential sequence, such as windows→balconies→doors. Accordingly, the layout of windows can be parsed first. In this example, we parse the layout via visual interpretation. Thereafter, a TLG with two nodes can be generated according to the two types of floors, which are surrounded by the red and green rectangles. Each node in TLG possesses unique attributes, except for the geometric attributes (i.e. “wf”, “hf”, “wb”); the sub-graph, i.e. the DLG, is also unique. Therefore, we only need to analyze the elements of one floor in a node of the TLG and the others remain the same, similar to the DLG in . The two different DLGs correspond to the two nodes in the TLG. The parsing of balconies is based on the introduction of windows.
Figure 3. Top-down parsing of a façade using the layout graph model
To ensure that each façade layout graph has a unique form, we construct the nodes in the graph by following Gestalt principles. Two necessary principles are formulated to automatically implement the construction of nodes based on Gestalt principles:
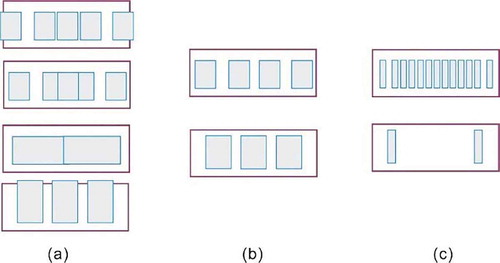
Principle 1: When all the elements in a DLG are similar to each other, each edge in this DLG must satisfy the condition that the intra-cluster spacing, “d_intra”, is less than the adjacent inter-cluster spacing, “d_inter”. Thus, elements in proximity can form a cluster, conforming to the “Law of Proximity.” Two examples are shown in .
Figure 4. Two descriptions of the façade graph model
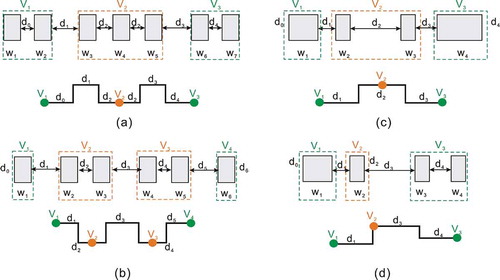
Principle 2: Elements with different widths or heights are treated under another condition, where the shape factor takes precedence over the spacing factor when grouping elements, because only elements with the same shape can express their attributes through a node. Two typical examples are depicted in .
To illustrate the difference between “d_intra” and “d_inter”, we use polylines to represent the edges in the graph, where a segment has a greater height, implying larger spacing. As shown in ), w1 and w2 can be clustered to form V1. This is because, when d0 < d1, w2 tends to form a cluster with w1 rather than w3. The spacing between w3 and w4 is equal to that between w4 and w5, suggesting that the three elements – w3, w4, and w5 – can be clustered to form V2. In ), a special node V1 is formed by a single element w1 when . Based on the edges in , it is evident inter-spacings are always greater than nearby intra-spacings when the elements are similar. illustrate a special case where the widths of the elements in one layer are different; thus, additional clusters are needed to record their attributes. The nodes V1 and V3 in ) and V1 and V2 in ) only contain one element; therefore, their intra-cluster spacings are 0.
3.2. Model parameters
The layout graph model is described by a parameter set Θ, which contains the attributes of the nodes and edges in the TLG and DLG; some configurations of the parameter set Θ are shown in . To generate a new layout graph model, in addition to the parameters mentioned above, we also need parameters that can describe the graph structure, such as the number of nodes in the TLG and DLG. By randomly configuring the parameter set Θ, we can obtain a large number of façade layouts. However, some incorrect and unreasonable façade layouts can also be constructed, such as the façades in , due to the absence of appropriate constraints. In façade reconstruction, many constraints can be represented by the topological relationships between elements.
Figure 5. Specific examples of façade layouts: (a) façades that could not be reconstructed; (b) façades that were correctly reconstructed; and (c) façades comprising correct elements, with layouts not in conformance with the Principle of architectural form, i.e. they are significantly crowded or sparse
Before describing the topological constraints, we first impose a constraint on the geometric properties of the façade elements. Conventionally, the design of residential buildings, composite buildings, and shopping malls need to comply with certain codes and standards (Horton Citation2015; MTRTS Citation2016; European Union Citation2018; MHCLG Citation2019). For instance, to ensure that people are comfortable within the building space, the State of Victoria (Citation2017) stipulates that the floor height must be greater than 2.5 m, and SNSW (Citation2015) specifies that the floor height needs to be greater than 2.2 m. In multi-floor and multi-functional buildings, the height of the ground floor should be greater than that of the other floors to provide additional space for use, such as retail or commercial uses. SNSW (Citation2015) stipulates that the ground floor height should be greater than 3.3 m. Buxton (Citation2015) determined that the standard height for the ground floor of a shopping mall should be no less than 3.2 m. In addition to suitability, energy and daylight savings are also important factors to be considered. For instance, WAPC (Citation2018) states that the height of a window should be greater than 1.6 m, and the State of Victoria (Citation2017) stipulates that the minimum width of a window should be 1.2 m. We studied several codes and directives related to building design and energy saving, which provide a reference for setting the initial domain of the geometric attribute of façades; these are described in .
Table 1. Definitions of parameters in layout model
As façade elements are geometrically and topologically related, we cannot generate them arbitrarily. Under constraints, the process of generating a new façade layout can be outlined as follows:
Step 1. First, the initial floor height, i.e. “hf”, is obtained randomly. The domain of “hf” is defined in . Accordingly, the total number of floors is then obtained by calculating
, where “H” is the height of the façade and ⌊·⌋ represents the round-down function.
Step 2. The number of nodes (nns) in the TLG is calculated considering that each node represents at least one floor. The attribute “sf” of each node can be determined using a stochastic allocation algorithm based on the Banker algorithm (Louchard and Schott Citation1991). According to the Banker algorithm, when allocating the number of floors in one node, “sf” should be greater than 0. Lastly, the sum of “sf” for all the nodes must be equal to the total number of floors. A pseudopod code is presented in Algorithm 1.
Table
Step 3. The value of “wf” is determined based on the façade width “W”, and the initial values of “wb” and “hgap” are set as 0 for each node in the TLG.
Step 4. To obtain the configuration of the DLG for one node in the TLG, a procedure similar to that used for forming the TLG is used. Thus, the heights “hw” and widths “ww” of the façade elements are randomly generated according to their domain, as defined in . As spacings exist between the elements on one floor, the value of “sp” needs to be generated randomly according to its domain, which is defined in . Therefore, the number of elements can be calculated as
Step 5. Similar to step 2, the number of nodes in the DLG can be generated randomly considering that each node contains at least one element. A stochastic allocation algorithm can be used to determine the attribute “sw”.
Step 6. Finally, the remaining width on one floor can be calculated as
3.3. Model formulation
In the proposed framework, the façade model can be generated using a parameter set. This procedure adopts the bottom-up approach. As shown in , we consider the window structure as an example. At the beginning of reconstruction, two window layouts are reconstructed according to the DLGs. Thereafter, according to the attributes of the red nodes in the TLG, a three-layered structure surrounded by a red rectangle is reconstructed, where each layer contains the same window layout as the layer under it. The two-layered structure on the right, surrounded by a green rectangle, is reconstructed in a similar manner. By combining these two structures, we can reconstruct a façade with windows. The position of each element on one floor can be cumulatively acquired using the attributes “wf” and the edges in the DLG. Thus, the coordinates of elements in the i-th floor can be calculated using EquationEquation (1)(1)
(1) :
Figure 6. Bottom-up reconstruction using the layout graph
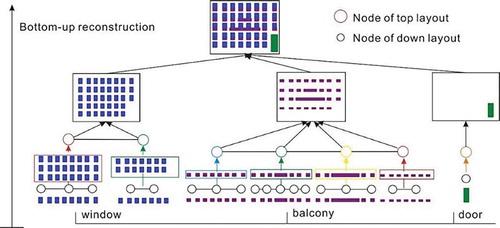
where “ndj” denotes the j-th node in the DLG, “ed” denotes the edges in the DLG, “nti” refers to the nodes in the TLG, and “nm” is a counter. When j = 0, we have ,
,
.
By mapping the generated model to the given data, coherence can be measured. In this context, we transform the problem of determining the optimal model for the given data into a MAP strategy (EquationEquation (2)(2)
(2) ). Posterior probability can be defined via a joint-prior estimator and the likelihood function:
where Θ refers to the parameter set containing Θwindow, Θbalcony, and Θdoor. Pr(Θ) represents the joint-prior estimates of the reconstructed model; and L(Dt|Θ) represents the likelihood function of the reconstructed model and the given data Dt. The weight can be adjusted according to the quality of point cloud data. In most practical scenarios, the weight can be set as
. According to our test results, the weight has an effect only under extreme conditions, i.e. when very few contours are extracted. This is because the acceptance of a model requires a high likelihood and also a reasonable prior estimate. We consider the window as an example to introduce the function.
3.3.1. Joint-prior estimates
In building façades that are significantly crowded or sparse, the components typically do not conform to the Principle of architectural form or the lighting requirements of the building (Goia, Haase, and Perino Citation2013), as demonstrated in ). A rational control function is established to assess whether the generated model conforms to the preferences of the inhabitants. Three prior conditions are designed for this function.
Under the first condition, the total width of windows on one floor is constrained. A detailed introduction of this condition can be found in Wang, Fan, and Zhou (Citation2020), and it is also expressed in EquationEquation (3)(3)
(3) . The smaller the value of Pr1(Θ), the more reasonable is the façade layout; this ensures that windows on the façade are not excessively sparse or crowded.
where is the ratio of the reference width of the window to the façade. We sum up this function by investigating several façades and verifying the effectiveness of the experiments.
Under the second condition, the ratio of the area of the window to that of the wall is constrained, considering the Window-to-Wall Ratio (WWR). Typically, the optimal WWR has minor variations in different regions or directions with respect to the sun. For example, Lee et al. (Citation2013) reported that the optimal WWR in Asia was 0.25 in the south and 0.5 in the north. Goia (Citation2016) investigated the optimal WWR for office buildings in Europe and reported it to be 0.3–0.45. Shaeri et al. (Citation2019) analyzed the relationship between the WWR and the energy saving in urban buildings, reporting an optimal WWR value of 0.3–0.5 for Bushehr. In our experiments, we believe that the closer the WWR is to 0.3, the better is the façade layout.
The third condition pertains to the inherent topological relationship among façade elements. For example, balconies are always adjacent to windows. Therefore, we combine different components to determine whether the generated model is feasible. For each floor, the relationship can be formulated as follows:
where (xwindow, ywindow) and (xbalcony, ybalcony) represent the coordinates of lower-left corner of a window and a balcony respectively, hbalcony means the height of a balcony.
The abovementioned three conditions are simultaneously implemented, and the following function is used to normalize the prior estimate:
3.3.2. Likelihood function
Likelihood indicates the degree of coherence between the generated model and given data. This can be obtained by mapping the reconstruction model to an actual façade point cloud. The higher the degree of coherence, the better is the parameter configuration. In the reconstructed models, windows are represented by a rectangular Bounding Box (BBox). After mapping these BBoxes to the refined façade structure, we can measure the degree of coherence by counting the number of laser points within the BBox area, denoted as L1. However, using this calculation function alone may generate a large component, because the larger the area, the greater is the number of points. Therefore, a point density calculation method is also required to ensure the reliability of the likelihood function, denoted as L2.
(a) Point counting function
To simplify the calculation complexity, we first project the façade plane onto a 2D plane, where the x-axis represents the width of the façade and the y-axis represents height. Each generated rectangle in the model is regular with respect to the coordinate axes. The Euclidean distance from each laser point to the center of the rectangle is calculated, where the distances along the x- and y-directions are expressed as xd and yd, respectively. When and
are satisfied simultaneously, the measured laser point can be assigned to the window class. The total number of laser points corresponding to the windows can be expressed by point_window(Θwindow). We set the total laser points in the façade as length(Dt); then, the function can be built as follows:
(b) Point density function
Point density is defined by the number of laser points contained within a single rectangle. Using the previous function, L1, point_window(Θwindow) was obtained. Thus, the point density can be calculated using EquationEquation (9)(9)
(9) :
In this manner, the total area of all the rectangles in the generated model can be calculated easily.
Similar to the procedure for the window, the coherence of the balcony and door can also be calculated. Consequently, the total likelihood function can be obtained as follows:
3.3.3. Global optimization
We aim to calculate the value of Θ* according to the MAP. Searching for optimal model parameters is a non-convex optimization problem. Simulated annealing can be used to obtain the global optimal within a high-dimensional space. Theoretically, simulated annealing can escape from local optima in a probabilistic manner, ensuring convergence to the optimal global solution for any initial parameters (Lafarge et al. Citation2008).
The steps involved in simulated annealing used for this purpose are as follows:
Table
In this task, we set and
. When the temperature decreases to
or the current solution does not change even after
, we assume that the algorithm has converged. The abovementioned values represent the optimal configurations for simulated annealing, as summarized in our experiment. When generating new hypothetical parameters, Gibbs sampling can be used to ensure that each generated solution is meaningful for a particular façade.
3.3.4. Gibbs sampling
When generating a new solution from the parameter space, two problems need to be addressed. First, owing to the existence of several non-independent parameters in the layout model, direct sampling from the parameter space is difficult. Second, random sampling from a high-dimensional space can yield invalid solutions. To address these issues, we adopt Gibbs sampling to generate candidate solutions, influenced by the geometric and topological relationships among the elements. To increase the rate of convergence, we also control the Gibbs sampling process by designing the proposition kernel Qm.
3.3.5. Proposition kernels
At different stages of the algorithm, we select different kernels for sampling under different probabilities. The proposed kernels narrow the dimension at different stages, limiting the scope of finding the optimal solution. This narrowing allows the algorithm to produce as many meaningful parameter combinations as possible. Three kernels (Q1, Q2, and Q3) are proposed in this work, and the corresponding changes are shown in , where we consider the window as an example.
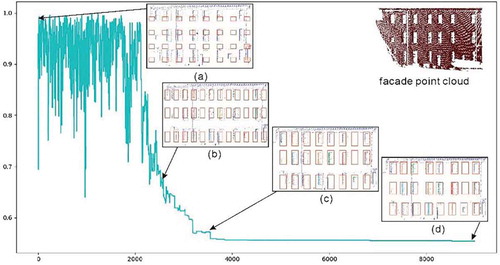
Q1: TLG kernel. This kernel plays an important role during the initial stage of the algorithm. Under this kernel, the DLG is fixed to only one node, which prevents large changes in the horizontal direction. Thus, we can search for the optimal configuration of the TLG. The change in state from (a) to (b) in expresses the application of Q1.
Q2: DLG kernel. In this kernel, the number of windows and the width of the window can be selected as primary parameters when searching for the optimal solution. This can cause significant changes in the prior estimate and affect the area of windows; this is illustrated by the change in state from (b) to (c) in .
Q3: Optimization kernel. In this kernel, we only disturb the formation of nodes and edges in the TLG and DLG. Disturbing the formation is necessary for finding a true global optimal solution. In the iterations close to a better solution, some parameters may not help optimize the model. Several changes still occur in the layout model under the same conditions of window size and number of windows. The changes in inter-cluster and intra-cluster spacings of the DLG can generate different models, similar to the change in state from (c) to (d) in .
Figure 7. Changes in posterior estimates during iteration, where the x-axis represents the number of solutions, and on the y-axis represents the posterior probability for each iteration
In the simulated annealing process, the kernel is selected dynamically. The kernel is selected based on two aspects. The first is the posterior probability of the current solution. There exists a case where a better solution is effectively found during the initial stage. In this case, additional iterations on this kernel are unnecessary. Therefore, a new kernel can be assigned a greater probability to help the optimization enter the next stage. Second, when iterating up to a certain time, finding better solutions under some conditions can be difficult. In this case, a suitable kernel should be selected to escape from potential local optima. The selection probability of kernels is detailed in .
Table 2. Selection probability of kernel under different conditions
4. Experiment and evaluation
In the experiments, we tested the ability of the façade layout graph model to reconstruct semantic façades. The Intersection over Union (IoU) was used as a criterion for the quantitative evaluation of reconstruction accuracy. Three datasets were used for the experiments.
4.1. Experimental data
Dataset-A was obtained through a single mobile laser scanner from a vehicle-based system. Each laser point records, in detail, the x-, y-, and z-axis coordinates; scanning time; and reflectivity. Dataset-B is a part of public dataset “Paris-Lille-3D” (Roynard, Deschaud, and Goulette Citation2018), where each point is characterized (x, y, z, x_origin, y_origin, z_origin, GPS_time, reflectance, label, and class), and the point density is approximately 1000–2000 points per square meter. This dataset was acquired using a multi-beam LiDAR sensor from a vehicle-based system. Thus, the point density in most areas can be considered similar; however, an anisotropic pattern also exists. It should be noted that the Paris-Lille-3D dataset was collected on a street in Paris. The buildings in Paris feature many different architectural layouts; therefore, this dataset serves as practical proof for validating the proposed method. Dataset-C is a subset of the public dataset SEMANTIC3D.NET (Hackel et al. Citation2017), acquired via a static terrestrial laser scanner. Point clouds acquired via static scanners exhibit differences in the point density under varying distances. Therefore, this dataset can be used to verify the robustness of the proposed method for different qualities of façade data. An overall description of these datasets is provided in .
Table 3. Description of datasets
We manually segmented façade and non-façade points. Notably, sloped roofs were included in the non-façade class; this is because a sloped roof can increase the height of the façade, sequentially increasing the actual façade area and affecting the calculation of the rational control function.
4.2. Reconstruction results
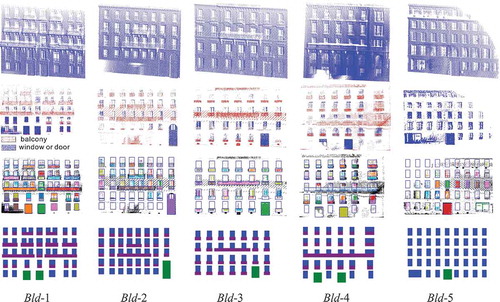
In experiments, we use this procedure of to reconstruct regular, complex and low-quality facades. We selected Bld-1-5 from Dataset-B to show the reconstruction of regular facades. Bld-6 is also from Dataset-B to show the reconstruction of complex facade. Bld-7 and Bld-8 are from Dataset-C, which are low-quality point clouds, so they are used to verify low-quality facade reconstruction. Moreover, entire results of the three datasets can be found in .
4.2.1. Regular façades
Regular façades have similar layouts, which reflect the shape of elements and the spacing between them. Thus, we can use the proposed optimization method with constraints to accurately infer the optimal façade model. shows the reconstruction results of regular façades; structural refining results are shown in the second row of this figure. Different components were separated using the RANSAC method; however, for the sake of presentation, they are combined in this figure. The final results obtained using the proposed method to search for optimal models are depicted in the third row of the figure. Similar to the second row, results of different components are combined. It is evident that some balconies are overlapped by windows, such as in the second façade. This is because some noise from the façade data is retained even after façade refinement, which affects the determination of the optimal model. In the optimization process, to obtain a better prior estimate, the size of the window is increased. From the results in the fourth row, we can verity that these overlaps are eliminated by using bottom-up generation.
Figure 8. Results of complete façade reconstruction
4.2.2. Complex façades
The proposed method is also capable of reconstructing complex data. In a complex façade, the layout of each floor is usually different, and the geometric attributes of the façade elements are also different. When refining such a façade structure, it can be difficult to identify window contours, as shown in ). Thus, to reconstruct this type of façade, a higher weight of the prior estimation is required for the optimization. To avoid large windows, we limit the upper boundary of the domain of window width (i.e. “ww”) during the derivation of the façade, which helps obtain a more accurate result compared to unrestricted inference.
Figure 9. Results of reconstructing the complex façade of Bld-6
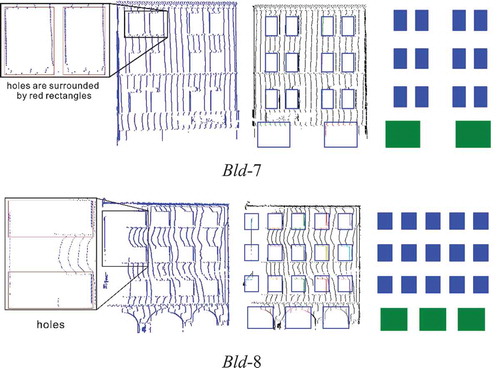
4.2.3. Low-quality façades
In the point cloud data acquired via a static laser scanner, low-quality façades often exist because of the small angle of incidence and the long distance between the façade and the scanner (Dong et al. Citation2020). Refining the structure is not necessary for such façades because only a few points are recorded. The probability of a window being recorded is much lower than that for a façade; therefore, holes in the façade can be considered as windows. Accordingly, we use a modified form of the likelihood function (EquationEquation (10)(10)
(10) ), i.e.
, for the optimization. From the results in , we can verity that holes are found and the semantic facade models are reconstructed correctly. It should be noted that the doors in Bld-7 is randomly generated according to the rule that door is located at the bottom of facade. Moreover, in Bld-8, the deduced facade layout divides the large holes on the left side of this facade into two windows with the same layout as other parts. This partition method reduces the complexity of facade layout graph by reducing the number of nodes in DLG.
Figure 10. Results of low-quality façade reconstruction
4.3. Quality assessment
To perform a quantitative evaluation of the proposed method, the ground truth of the test data is required as a reference. In this experiment, we manually extract elements from the tested façades, and these elements are classified via visual interpretation.
We adopted the IoU as a criterion to evaluate the precision of the reconstructed façades. The IoU is denoted by the ratio of the number of points present in the ground truth as well as the reconstructions to the total number of points present across both results (Rezatofighi et al. Citation2019).
Doors are often reconstructed using a stochastic value in the reconstruction process due to the missing points on the ground floor; this leads to a low IoU score. In our experiment, the position and size of the detected windows are essential for obtaining an accurate reconstructed model. Thus, we also introduce an Accuracy score, expressed as
For Bld-1 to Bld-6, the Accuracy score was close to 1. This is because we derive their layouts from the refined façade structure, which contains points that belong to the façade elements; the higher the number of points included, the better is the result. In contrast, the Accuracy score of Bld-7 and Bld-8 is close to 0, because we infer their layouts from as few points as possible.
indicates that the proposed method achieves good performance in terms of accuracy; however, its IoU is low. This is because we do not consider the Principle of architectural form when creating the reference ground truth, which led to a smaller BBox than that derived. Additionally, in point cloud data, it is difficult to accurately determine edges. Therefore, the derived façade models only possessed the maximum fitting of the given data and not the most accurate result. From the perspective of Accuracy, the derived models fit the façade structure to the maximum extent possible, proving the effectiveness of the method. It is worth mentioning that better reconstruction results were obtained for the low-quality façades than for other façades. This is mainly because, in these façades, windows and doors are clearly represented as holes, making it easy to obtain accurate results using the designed function.
Table 4. IoU and Accuracy scores for the test data
4.4. Limitations
Although the proposed layout graph model can describe different types of façade structures, as evidenced by the experimental results, it is not sufficiently refined, which is reflected by its descriptions of complex façade structures. We assign six attributes to each node in the TLG, including the DLG. The DLG contains nodes with three attributes and edges with two attributes. When the façade structure changes, it is necessary to increase the number of nodes in the TLG, which results in at least 11 attributes being increased, such as the 96 parameters used to represent the layout of Bld-6. However, this is still simpler than the grammar-based approach, which uses 153 rules to generate façade structures. Moreover, based on our observations, the models derived via the proposed approach can be stored and delivered in a more concise storage spacing compared to those from previous approaches. This process of simplifying model can be learned via a combination of rules in learning grammar and Occam’s razor, and the parameter set used in the proposed approach can be refined using inheritance rules. Furthermore, through this method, we obtain a refined result with a reduction of 17 parameters (shown in ). However, automation of the refining process could not be achieved. In the following work, we plan to explore methods to make the proposed model more refined.
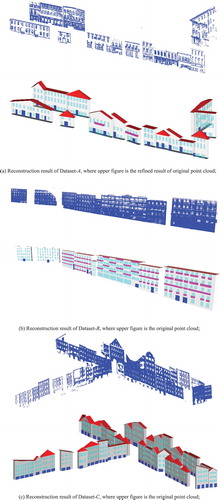
Figure 11. Layout graph of the window, balcony, and door for Bld-6. In the window layout, we refine the DLG. Nodes with identical attributes can be constructed using attribute inheritance, thereby reducing the number of parameters. In the balcony layout, we apply the same attribute inheritance method to the TLG to refine the structure of the layout graph. (a) Reconstruction result of Dataset-A, where upper figure is the refined result of original point cloud; (b) Reconstruction result of Dataset-B, where upper figure is the original point cloud; (c) Reconstruction result of Dataset-C, where upper figure is the original point cloud
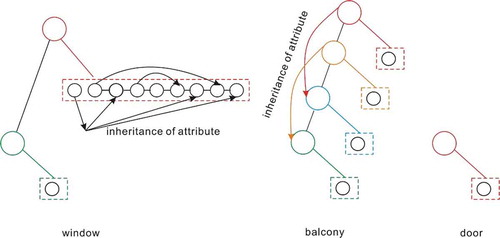
Figure 12. Overall reconstruction results of chosen datasets, where the cyan denoted windows, the pink denoted balconies and the blue denoted doors. Among these results, facades are generated using the CityGML LoD3 standard. Roofs in these buildings were generated by using Random3DCity engine (Biljecki, Ledoux, and Stoter Citation2016)
5. Conclusions
From the experimental results, it is evident that the proposed façade layout graph model is suitable for reconstructing different types of façades. As advantages, this model features a clear hierarchy and enables the intuitive interpretation of façade structures. In particular, we use the same type of graph for both the TLG and the DLG. The derivation of these two levels of the graph model is based on the Principle of architectural form and Gestalt principles. Therefore, the facade layout model can be parsed and reconstructed in a simple manner, similar to the top-down and bottom-up strategies. For the derivation of the optimal model, we use structural knowledge of the building to design constraint conditions, thereby reducing the domain of parameters. Simultaneously, under these constraints, we use Gibbs sampling to obtain new candidate models.
The geometric and topological relationships among high-level façade structures are reflected by the clustering of floors in the TLG, while those among low-level façade elements are represented by the clustering of elements in the DLG. Based on the description of these relationships, we impart additional information to the semantic façade model, as compared to simply reconstructing it from semantic segmentation; this is expected to enable computers to understand façades in a more intelligent manner. Moreover, when using the proposed method for describing façade structures, façades can be easily edited without affecting other floors, such as adjusting the location and size of façade elements and deleting or adding façade elements; this will be conducted in our future work.
Data availability statement
The data and source codes used in this work are available under the link: https://github.com/wangyuefeng2017/SA-GIBBS-semantic-facade-reconstruction.
Additional information
Funding
Notes on contributors
Hongchao Fan
Hongchao Fan is Professor for 3D Geoinformatics at the Norwegian University of Science and Technology (NTNU). He received his master’s degree in Geodesy and Geoinformatics at the University of Stuttgart and obtained his Ph.D. at the Technical University of Munich in Germany. His research interests include 3D city modeling, spatial data mining from VGI data and laser scanning.
Yuefeng Wang
Yuefeng Wang is PhD candidate in Wuhan University. His research interests include 3D building reconstruction and 3D GIS.
Jianya Gong
Jianya Gong is Professor for GIS at the Wuhan University, and also an academician of Chinese Academy of Science. His research interests include geo-spatial data structure and data model, geographical information system software, geo-spatial data sharing and interoperability, photogrammetry, GIScience, and remote sensing applications.
References
- Alegre, F., and F. Dellaert. 2004. “A Probabilistic Approach to the Semantic Interpretation of Building Facades.” Paper presented at the International Workshop on Vision Techniques Applied to the Rehabilitation of City Centres, Lisbon, Portugal, October.
- Becker, S. 2009. “Generation and Application of Rules for Quality Dependent Façade Reconstruction.” ISPRS Journal of Photogrammetry and Remote Sensing 64 (6): 640–653. doi:https://doi.org/10.1080/10095020.2020.1838957.
- Biljecki, F., H. Ledoux, and J. Stoter. 2016. “Generation of Multi-lod 3D City Models in Citygml with the Procedural Modelling Engine Random3dcity.” Paper presented at the Proceedings of the ISPRS Annals of Photogrammetry, Remote Sensing & Spatial Information Sciences, 51–59, Split, Croatia, September 7-9.
- Buxton, P. 2015. Metric Handbook: Planning and Design Data. 5th ed. Buxton: Routledge.
- Cao, J., H. Metzmacher, J. O’Donnell, J. Frisch, V. Bazjanac, L. Kobbelt, and C. Van Treeck. 2017. “Facade Geometry Generation from Low-resolution Aerial Photographs for Building Energy Modeling.” Building and Environment 123: 601–624. doi:https://doi.org/10.1016/j.buildenv.2017.07.018.
- Cohen, A., A. G. Schwing, and M. Pollefeys. 2014. “Efficient Structured Parsing of Facades Using Dynamic Programming.” Paper presented at the Proceedings of the IEEE Conference on Computer Vision and Pattern Recognition, 3206–3213, Columbus, USA, June 23- 28.
- Dehbi, Y., F. Hadiji, G. Gröger, K. Kersting, and L. Plümer. 2017. “Statistical Relational Learning of Grammar Rules for 3D Building Reconstruction.” Transactions in GIS 21 (1): 134–150. doi:https://doi.org/10.1111/tgis.12200.
- Doersch, C., S. Singh, A. Gupta, J. Sivic, and A. Efros. 2012. “What Makes Paris Look like Paris?” ACM Transactions on Graphics 31 (4): 1–10. doi:https://doi.org/10.1145/2185520.2185597.
- Dogrusoz, U., E. Giral, A. Cetintas, A. Civril, and E. Demir. 2004. “A Compound Graph Layout Algorithm for Biological Pathways.” Paper presented at the International Symposium on Graph Drawing, 442–447, New York, USA, September.
- Dong, Z., F. Liang, B. Yang, Y. Xu, Y. Zang, J. Li, Y. Wang, W. Dai, H. Fan, and J. Hyyppä. 2020. “Registration of Large-scale Terrestrial Laser Scanner Point Clouds: A Review and Benchmark.” ISPRS Journal of Photogrammetry and Remote Sensing 163: 327–342. doi:https://doi.org/10.1016/j.isprsjprs.2020.03.013.
- European, Union. 2018. “Amending Energy Performance of Buildings Directive (2018/844/EU).” Official Journal of the European Union. https://ec.europa.eu/energy/topics/energy-efficiency/energy-efficient-buildings/energy-performance-buildings-directive_en
- Fan, L., P. Musialski, L. Liu, and P. Wonka. 2015. “Structure Completion for Facade Layouts.” ACM Transactions on Graphics 33 (6): 1–11. doi:https://doi.org/10.1145/2816795.2818105.
- Fathalla, R., and G. Vogiatzis. 2017. “A Deep Learning Pipeline for Semantic Facade Segmentation.” Paper presented at the proceedings of British Machine Vision Conference, 1–13, London, United Kingdom, September 4- 7.
- Fischler, M. A., and R. C. Bolles. 1981. “Random Sample Consensus: A Paradigm for Model Fitting with Applications to Image Analysis and Automated Cartography.” Communications of the ACM 24 (6): 381–395. doi:https://doi.org/10.1145/358669.358692.
- Flemming, U. 1990. “Syntactic Structures in Architecture: Teaching Composition with Computer Assistance.” In The Electronic Design Studio: Architectural Knowledge and Media in the Computer Era, edited by M. McCullough, W. J. Mitchell and P. Purcell, 31–48. Cambridge: MIT Press. Mass.
- Gadde, R., V. Jampani, R. Marlet, and P. V. Gehler. 2017. “Efficient 2D and 3D Facade Segmentation Using Auto-context.” IEEE Transactions on Pattern Analysis and Machine Intelligence 40 (5): 1273–1280. doi:https://doi.org/10.1109/TPAMI.2017.2696526.
- Gadde, R., R. Marlet, and N. Paragios. 2016. “Learning Grammars for Architecture-specific Facade Parsing.” International Journal of Computer Vision 117 (3): 290–316. doi:https://doi.org/10.1007/s11263-016-0887-4.
- Geman, S., and D. Geman. 1984. “Stochastic Relaxation, Gibbs Distributions, and the Bayesian Restoration of Images.” IEEE Transactions on Pattern Analysis and Machine Intelligence 6 (6): 721–741. doi:https://doi.org/10.1109/TPAMI.1984.4767596.
- Goia, F. 2016. “Search for the Optimal Window-to-wall Ratio in Office Buildings in Different European Climates and the Implications on Total Energy Saving Potential.” Solar Energy 132: 467–492. doi:https://doi.org/10.1016/j.solener.2016.03.031.
- Goia, F., M. Haase, and M. Perino. 2013. “Optimizing the Configuration of a Façade Module for Office Buildings by Means of Integrated Thermal and Lighting Simulations in a Total Energy Perspective.” Applied Energy 108: 515–527. doi:https://doi.org/10.1016/j.apenergy.2013.02.063.
- Gröger, G., and L. Plümer. 2012. “CityGML–Interoperable Semantic 3D City Models.” ISPRS Journal of Photogrammetry and Remote Sensing 71: 12–33. doi:https://doi.org/10.1016/j.isprsjprs.2012.04.004.
- Hackel, T., N. Savinov, L. Ladicky, J. D. Wegner, K. Schindler, and M. Pollefeys. 2017. “Semantic3d. Net: A New Large-scale Point Cloud Classification Benchmark.” Paper presented at the Proceedings of the ISPRS Annals of Photogrammetry, Remote Sensing and Spatial Information Sciences, 91–98, Hannover, Germany, June 6- 9.
- Han, F., and S.-C. Zhu. 2005. “Bottom-up/top-down Image Parsing by Attribute Graph Grammar.” Paper presented at the 10th IEEE International Conference on Computer Vision, 1778–1785, Beijing, China, October 17-21.
- Hensel, S., S. Goebbels, and M. Kada. 2019. “Facade Reconstruction for Textured LOD2 Citygml Models Based on Deep Learning and Mixed Integer Linear Programming.” Paper presented at the Proceedings of the ISPRS Annals of Photogrammetry, Remote Sensing and Spatial Information Sciences, 37–44, Enschede, Netherlands, June 10- 14.
- Horton, D. 2015. “Montana Commercial Energy Code Summary.” National Center for Appropriate Technology. http://deq.mt.gov/Energy/eec/EnergyCode
- Hu, H., L. Wang, M. Zhang, Y. Ding, and Q. Zhu. 2020. “Fast and Regularized Reconstruction of Building Facades from Street-View Images Using Binary Integer Programming.” Paper presented at the Proceedings of the ISPRS Annals of Photogrammetry, Remote Sensing and Spatial Information Sciences, V-2-2020, 365–371, Edition (digital), August 31- September 2.
- Jennath, K. A., and P. Nidhish. 2016. “Aesthetic Judgement and Visual Impact of Architectural Forms: A Study of Library Buildings.” Procedia Technology 24: 1808–1818. doi:https://doi.org/10.1016/j.protcy.2016.05.226.
- Kilgour, D. M., and K. W. Hipel. 2005. “The Graph Model for Conflict Resolution: Past, Present, and Future.” Group Decision and Negotiation 14 (6): 441–460. doi:https://doi.org/10.1007/s10726-005-9002-x.
- Koffka, K. 1935. Principles of Gestalt Psychology. New York: Harcourt, Brace & World.
- Koutsourakis, P., L. Simon, O. Teboul, G. Tziritas, and N. Paragios. 2009. “Single View Reconstruction Using Shape Grammars for Urban Environments.” Paper presented at the IEEE 12th international conference on computer vision, 1795–1802, Kyoto, Japan, September 27- October 4.
- Lafarge, F., X. Descombes, J. Zerubia, and M. Pierrot-Deseilligny. 2008. “Structural Approach for Building Reconstruction from a Single DSM.” IEEE Transactions on Pattern Analysis and Machine Intelligence 32 (1): 135–147. doi:https://doi.org/10.1109/TPAMI.2008.281.
- Lee, J.-W., H.-J. Jung, J.-Y. Park, J. Lee, and Y. Yoon. 2013. “Optimization of Building Window System in Asian Regions by Analyzing Solar Heat Gain and Daylighting Elements.” Renewable Energy 50: 522–531. doi:https://doi.org/10.1016/j.renene.2012.07.029.
- Li, D., M. Wang, and J. Jiang. 2021. “China’s High-resolution Optical Remote Sensing Satellites and Their Mapping Applications.” Geo-spatial Information Science 24 (1): 85–94. doi:https://doi.org/10.1080/10095020.2020.1838957.
- Li, J., B. Xiong, R. Qin, and A. Gruen. 2020. “A Flexible Inference Machine for Global Alignment of Wall Openings.” Remote Sensing 12 (12): 1968. doi:https://doi.org/10.3390/rs12121968.
- Lin, D., M. Jarzabek-Rychard, X. Tong, and H.-G. Maas. 2019. “Fusion of Thermal Imagery with Point Clouds for Building Façade Thermal Attribute Mapping.” ISPRS Journal of Photogrammetry and Remote Sensing 151: 162–175. doi:https://doi.org/10.1016/j.isprsjprs.2019.03.010.
- Liu, J., E. Z. Psarakis, Y. Feng, and I. Stamos. 2019. “A Kronecker Product Model for Repeated Pattern Detection on 2d Urban Images.” IEEE Transactions on Pattern Analysis and Machine Intelligence 41 (9): 2266–2272. doi:https://doi.org/10.1109/TPAMI.2018.2858795.
- Liu, X., Y. Zhao, and S.-C. Zhu. 2018. “Single-view 3D Scene Reconstruction and Parsing by Attribute Grammar.” IEEE Transactions on Pattern Analysis and Machine Intelligence 40 (3): 710–725. doi:https://doi.org/10.1109/TPAMI.2017.2689007.
- Louchard, G., and R. Schott. 1991. “Probabilistic Analysis of Some Distributed Algorithms.” Random Structures & Algorithms 2 (2): 151–186. doi:https://doi.org/10.1002/rsa.3240020203.
- Martinovic, A., and L. Van Gool. 2013. “Bayesian Grammar Learning for Inverse Procedural Modeling.” Paper presented at the Proceedings of the IEEE Conference on Computer Vision and Pattern Recognition, 201–208, Portland, USA, June 23- 28.
- Metropolis, N., A. W. Rosenbluth, M. N. Rosenbluth, A. H. Teller, and E. Teller. 1953. “Equation of State Calculations by Fast Computing Machines.” The Journal of Chemical Physics 21 (6): 1087–1092. doi:https://doi.org/10.1063/1.1699114.
- MHCLG (Ministry of Housing, Communities and Local Government). 2019. “Energy Performance of Buildings Directive.” Ministry of Housing, Communities and Local Government. https://www.gov.uk/government/publications/energy-performance-of-buildings-directive-second-cost-optimal-assessment
- MTRTS (Mesquite TEXAS Real. Texas. Service). 2016. “Amendments-Community Appearance Manual-Version 1.5: Principles and Requirements for Facade Design.” City of Mesquite: Community Development Department. https://www.cityofmesquite.com/DocumentCenter/View/584/Community-Appearance-Manual-Version-15
- Müller, P., G. Zeng, P. Wonka, and L. Van Gool. 2007. “Image-based Procedural Modeling of Facades.” ACM Transactions on Graphics 26 (3): 85. doi:https://doi.org/10.1145/1276377.1276484.
- Nguatem, W., M. Drauschke, and H. Mayer. 2014. “Localization of Windows and Doors in 3D Point Clouds of Facades.” Paper presented at the Proceedings of the ISPRS Annals of the Photogrammetry, Remote Sensing and Spatial Information Sciences, 87–94, Zurich, Switzerland, September 5- 8.
- Park, S., B. X. Nie, and S.-C. Zhu. 2017. “Attribute And-or Grammar for Joint Parsing of Human Pose, Parts and Attributes.” IEEE Transactions on Pattern Analysis and Machine Intelligence 40 (7): 1555–1569. doi:https://doi.org/10.1109/TPAMI.2017.2731842.
- Qi, C. R., L. Yi, H. Su, and L. J. Guibas. 2017. “Pointnet++: Deep Hierarchical Feature Learning on Point Sets in a Metric Space.” Paper presented at the Proceedings of the 31st Conference on Neural Information Processing Systems, 5105–5114, Long Beach, USA, December 4- 8.
- Redmon, J., and A. Farhadi. 2018. “YOLOv3: An Incremental Improvement.” arXiv E-prints. 1804.02767: 1–6.
- Rezatofighi, H., N. Tsoi, J. Gwak, A. Sadeghian, I. Reid, and S. Savarese. 2019. “Generalized Intersection over Union: A Metric and A Loss for Bounding Box Regression.” Paper presented at the Proceedings of the IEEE/CVF Conference on Computer Vision and Pattern Recognition, 658–666, Salt Lake, USA, June 15- 20.
- Riemenschneider, H., U. Krispel, W. Thaller, M. Donoser, S. Havemann, D. Fellner, and H. Bischof. 2012. “Irregular Lattices for Complex Shape Grammar Facade Parsing.” Paper presented at the IEEE Conference on Computer Vision and Pattern Recognition, 1640–1647, Providence, USA, June 16- 21.
- Ripperda, N., and C. Brenner. 2006. “Reconstruction of Façade Structures Using a Formal Grammar and Rjmcmc.” Paper presented at the 28th DAGM Symposium, 750–759, Berlin, Germany, September 12- 14.
- Ripperda, N., and C. Brenner. 2009. “Application of a Formal Grammar to Facade Reconstruction in Semiautomatic and Automatic Environments.” Paper presented at the Proceedings of the 12th AGILE Conference on GIScience, 1–12, Hannover, Germany, June 2- 5.
- Roynard, X., J.-E. Deschaud, and F. Goulette. 2018. “Paris-Lille-3D: A Large and High-quality Ground-truth Urban Point Cloud Dataset for Automatic Segmentation and Classification.” The International Journal of Robotics Research 37 (6): 545–557. doi:https://doi.org/10.1177/0278364918767506.
- Salas, E. A. L. 2020. “Waveform LiDAR Concepts and Applications for Potential Vegetation Phenology Monitoring and Modeling: A Comprehensive Review.” Geo-spatial Information Science 1–22. doi:https://doi.org/10.1080/10095020.2020.1761763.
- Schmittwilken, J., M. Y. Yang, W. Förstner, and L. Plümer. 2009. “Integration of Conditional Random Fields and Attribute Grammars for Range Data Interpretation of Man-made Objects.” Annals of GIS 15 (2): 117–126. doi:https://doi.org/10.1080/19475680903464696.
- Schwartz, B. L., and J. H. Krantz. 2017. Sensation and Perception. New York: Sage Publications.
- Shaeri, J., A. Habibi, M. Yaghoubi, and A. Chokhachian. 2019. “The Optimum Window-to-wall Ratio in Office Buildings for Hot‒humid, Hot‒dry, and Cold Climates in Iran.” Environments 6 (4): 45. doi:https://doi.org/10.3390/environments6040045.
- Shan, J., Z. Hu, P. Tao, L. Wang, S. Zhang, and S. Ji. 2020. “Toward a Unified Theoretical Framework for Photogrammetry.” Geo-spatial Information Science 23 (1): 75–86.
- SNSW (State of New South Wales). 2015. “Apartment Design Guide.” State of New South Wales Government Policy and Legislation: Housing and NSW Department of Planning and Environment. https://www.planning.nsw.gov.au/Policy-and-Legislation/Housing/Apartment-Design-Guide
- State of Victoria. 2017. “Better Apartments Design Standards.” Victorian State Government and the Department of Environment, Land, Water and Planning. https://www.planning.vic.gov.au/policy-and-strategy/better-apartments
- Su, H., V. Jampani, D. Sun, S. Maji, E. Kalogerakis, M.-H. Yang, and J. Kautz. 2018. “Splatnet: Sparse Lattice Networks for Point Cloud Processing.” Paper presented at the Proceedings of the IEEE Conference on Computer Vision and Pattern Recognition, 2530–2539, Salt Lake, USA, June 18- 23.
- Sugiyama, K., and K. Misue. 1991. “Visualization of Structural Information: Automatic Drawing of Compound Digraphs.” IEEE Transactions on Systems, Man, and Cybernetics 21 (4): 876–892. doi:https://doi.org/10.1109/21.108304.
- Teboul, O., I. Kokkinos, L. Simon, P. Koutsourakis, and N. Paragios. 2011. “Shape Grammar Parsing via Reinforcement Learning.” Paper presented at the the Proceedings of the IEEE Conference on Computer Vision and Pattern Recognition, 2273–2280, Colorado, USA, June 20- 25.
- Tuttas, S., and U. Stilla. 2013. “Reconstruction of Facades in Point Clouds from Multi-aspect Oblique ALS.” Paper presented at the Proceedings of the ISPRS Annals of Photogrammetry, Remote Sensing & Spatial Information Sciences, 91–96, Antalya, Turkey, November 12- 13.
- Wang, Y., H. Fan, and G. Zhou. 2020. “Reconstructing Facade Semantic Models Using Hierarchical Topological Graphs.” Transactions in GIS 24 (4): 1073–1097. doi:https://doi.org/10.1111/tgis.12616.
- WAPC (Western Australian Planning Commission). 2018. “R-Codes State Planning Policy 3.1 Residential Design Codes.” Western Australian Planning Commission Department of Planning Lands and Heritage. https://www.dplh.wa.gov.au/getmedia/5dce3eb2-abe9-4fc3-bbab-92cc89f0b5cf/State_Planning_Policy_3-1-Residential_Design_Codes-for-mobile
- Weissenberg, J., H. Riemenschneider, M. Prasad, and L. Van Gool. 2013. “Is There a Procedural Logic to Architecture?” Paper presented at the Proceedings of the IEEE Conference on Computer Vision and Pattern Recognition, 185–192, Portland, USA, June 23- 28.
- Wonka, P., M. Wimmer, F. Sillion, and W. Ribarsky. 2003. “Instant Architecture.” ACM Transactions on Graphics 22 (3): 669–677. doi:https://doi.org/10.1145/882262.882324.
- Wu, J., J. Mao, S. Chen, G. Zhuoma, L. Cheng, and R. Zhang. 2020. “Building Facade Reconstruction Using Crowd-Sourced Photos and Two-Dimensional Maps.” Photogrammetric Engineering and Remote Sensing 86 (11): 677–694. doi:https://doi.org/10.14358/PERS.86.11.677.
- Xia, S., and R. Wang. 2019. “Façade Separation in Ground-based LIDAR Point Clouds Based on Edges and Windows.” IEEE Journal of Selected Topics in Applied Earth Observations and Remote Sensing 12 (3): 1041–1052. doi:https://doi.org/10.1109/JSTARS.2019.2897987.
- Xiong, B., S. O. Elberink, and G. Vosselman. 2014. “A Graph Edit Dictionary for Correcting Errors in Roof Topology Graphs Reconstructed from Point Clouds.” ISPRS Journal of Photogrammetry and Remote Sensing 93: 227–242. doi:https://doi.org/10.1016/j.isprsjprs.2014.01.007.
- Xiong, B., M. Jancosek, S. O. Elberink, and G. Vosselman. 2015. “Flexible Building Primitives for 3D Building Modeling.” ISPRS Journal of Photogrammetry and Remote Sensing 101: 275–290. doi:https://doi.org/10.1016/j.isprsjprs.2015.01.002.
- Zhang, H., K. Xu, W. Jiang, J. Lin, D. Cohen-Or, and B. Chen. 2013. “Layered Analysis of Irregular Facades via Symmetry Maximization.” ACM Transactions on Graphics 32 (4): 1–13.
- Zhang, X., F. Lippoldt, K. Chen, H. Johan, M. Erdt, X. Zhang, F. Lippoldt, K. Chen, H. Johan, and M. Erdt. 2019. “A Data-driven Approach for Adding Facade Details to Textured LoD2 CityGML Models.” Paper presented at the VISIGRAPP (1: GRAPP), 294–301, Prague, Czech Republic, February 25- 27.
- Zhu, Q., M. Zhang, H. Hu, and F. Wang. 2020. “Interactive Correction of a Distorted Street-view Panorama for Efficient 3-d Façade Modeling.” IEEE Geoscience and Remote Sensing Letters 17 (12): 2125–2129. doi:https://doi.org/10.1109/LGRS.2019.2962696.
- Zolanvari, S. I., D. F. Laefer, and A. S. Natanzi. 2018. “Three-dimensional Building Façade Segmentation and Opening Area Detection from Point Clouds.” ISPRS Journal of Photogrammetry and Remote Sensing 143: 134–149. doi:https://doi.org/10.1016/j.isprsjprs.2018.04.004.