
 ?Mathematical formulae have been encoded as MathML and are displayed in this HTML version using MathJax in order to improve their display. Uncheck the box to turn MathJax off. This feature requires Javascript. Click on a formula to zoom.
ABSTRACT
High-Speed Rail (HSR) has increasingly become an important mode of inter-city transportation between large cities. Inter-city interaction facilitated by HSR tends to play a more prominent role in promoting urban and regional economic integration and development. Quantifying the impact of HSR’s interaction on cities and people is therefore crucial for long-term urban and regional development planning and policy making. We develop an evaluation framework using toponym information from social media as a proxy to estimate the dynamics of such impact. This paper adopts two types of spatial information: toponyms from social media posts, and the geographical location information embedded in social media posts. The framework highlights the asymmetric nature of social interaction among cities, and proposes a series of metrics to quantify such impact from multiple perspectives – including interaction strength, spatial decay, and channel effect. The results show that HSRs not only greatly expand the uneven distribution of inter-city connections, but also significantly reshape the interactions that occur along HSR routes through the channel effect.
1. Introduction
The High-Speed Railway (HSR) offers advantages in on-time departure/arrival time, comfortable travel experience, and less CO2 emission in comparison to air travel (Yang et al. Citation2018a; Tian et al. Citation2021). Hence, many countries have been making great efforts to develop HSRs, such as those being planned under the Biden administration (Savidge Citation2021). The effects of regional rail investments is a longstanding topic of interest in the fields of regional/urban planning, real estate, housing, tourism, transportation, politics and economic geography because regional rail is a popular public investment used to promoting the economic agglomeration level of the regional economy, mobility of skilled labor-force, and the reduction of greenhouse gas emissions (Pagliara and Mauriello Citation2020; Shao, Tian, and Yang Citation2017; Yu et al. Citation2020; Audikana Citation2021; Tian et al. Citation2021). Researchers examine regional rail benefits from various perspectives, for example, a conventional perspective of investigating the effects is by comparing land or housing values along the rail corridor before and after the start of the rail service. However, fewer studies investigate the regional rail effects in terms of urban interaction, although promoting urban interaction is a primary objective for regional rail investment (Guo, Li, and Han Citation2020). Examinations of urban interaction resulting from regional rail project present important implications for benefit-cost analysis of regional rail investment and planning.
Furthermore, scholars of regional science, urban studies, and geography have long been interested in the interactions between cities and regions as they convey the spatial structure of a region (Zhen et al. Citation2019). The urban interaction involves the movement of people and cargo between places. The urban interaction also can refer to virtual connections, such as information communication between places (Yang et al. Citation2019; Ye and Wei Citation2019). Conventionally, survey data were used to measure urban interaction, such as volumes of passengers between two cities (Xiao et al. Citation2013), migration flows (Flowerdew and Lovett Citation2010), trade flow (Hesse Citation2010), and telecommunications (Guldmann Citation2005). Compared with survey data, social media data offer a high temporal resolution, and are accessible at a large size with minimal cost (Cao et al. Citation2015; Wang et al. Citation2016; Li et al. Citation2017;Yang et al. Citation2019; Ghani et al. Citation2019).
HSR, a type of regional trail commuting between cities and running much faster than traditional rail, significantly impacts urban systems, regional development, and the level of urban spatial interaction (Zhang, Wan, and Yang Citation2019). Due to their high speed and large capacity, it has largely become substitutes for domestic air transportation between cities (Chen Citation2017; Gao, Su, and Wang Citation2019). The development of high-speed rail is a key urban infrastructure investment and economic development policy across a couple of countries (Wang, Acheampong, and He Citation2020b), especially for developing countries. HSRs are reshaping the maps of the spatial interaction, and reconstructing its network structure of cities. These inter-city interaction and relationship brought by HSR tends to play a more prominent role in promoting urban integration and development in areas with more developed economies (Guo, Li, and Han Citation2020), including knowledge-intensive economy (Wang, Acheampong, and He Citation2020b). The HSR network, with its reduced travel time, has greatly increased the mobility of people between cities and facilitated the spatial redistribution of urban population, with the consequence of population gain and lose further exacerbated by HSR (Deng et al. Citation2019). HSR inter-regional commuting can be seen as a type of “temporary” migration (Guirao, Campa, and Casado-Sanz Citation2018), give rise to a horizontal and polycentric city network and promote regional integration (Xu et al. Citation2019), and lead to a decrease in the disparity in population accessibility (Wang and Duan Citation2018). Understanding and quantifying the impact of HSR’s interaction on cities, therefore, is crucial for long-term urban and regional development policy and planning. Quantifying dynamic inter-city interaction brought by HSR is challenging. Commonly used indicators – such as per capita income or industrial output – fail to completely capture the effects of HSR. Besides, since these indicators describe the characteristics of individual cities, it is challenging to quantify the interaction between cities, especially if their mutual influences are uneven. Big spatio-temporal data extracted from social media not only contains rich spatial and temporal information, but it also contains information that details the interactions between cities (Han, Tsou, and Clarke Citation2015; Andris Citation2016; Zhang et al. Citation2021).
This paper develops a framework for measuring the bi-directional interaction between cities impacted by HSR by using a toponym from social media as a proxy. The contributions of this paper are summarized below:
Designing new metrics for HSR impacts by examining spatial attenuation effects and asymmetric interactions between cities.
Deriving a method to examine the channel effect of HSR, which refers to whether the two cities located at the endpoints of the HSR obtain far greater benefits than other cities through which the HSR passes.
Presenting a case study using social media data to demonstrate the applicability of the framework.
2. Related work
2.1. Spatial impact of HSR
Researchers have previously analyzed the line topology of HSR and studied the relationship and impact of HSR and urban spatial structure (Wang and Zhang Citation2019; Zhang, Wan, and Yang Citation2019). Urban accessibility to HSR is evaluated using network analysis. Inspired by the gravity model for global city network (Taylor and Derudder Citation2004), it was found that inter-city relatedness – as well as radiation and gravity models along the Beijing-Shanghai HSR – were consistent (Liao Citation2014). The network centrality indicator was then used to investigate the spatial impact of HSR in urban networks (Cao, Feng, and Zhang Citation2019; Wang, Du, and Huang Citation2020a); it was found that, with the opening of the HSR network, overall connectivity between cities increased significantly (Jiao, Wang, and Jin Citation2017). These static studies focus on the spatial impact of the HSR line itself.
Previous research indicates that the development of HSR has greatly improved tourism, and affected labor migration and house values in small and medium cities situated along an HSR line (Chen and Haynes Citation2015). There are other studies that take third-party data into consideration to measure the effect of HSR on everyday life and the urban economy. For example, survey data and regression models have been used to examine the effect of HSR on tourism (Guirao and Campa Citation2015); labor and economic activity (Guirao, Lara-Galera, and Campa Citation2017; Li et al. Citation2016); housing prices (Cheng, Loo, and Vickerman Citation2015; Diao, Zhu, and Zhu Citation2016), nighttime light data (Deng et al. Citation2020), and ticket fares (Cavallaro et al. Citation2020). The use of passenger flow data allowed for the spatial structure of 99 HSR cities in China to be analyzed, showing that the city network is multi-centered, particularly in the central and eastern cities (Yang et al. Citation2018b). The impacts of high-speed rail development on airport-level traffic are examined by combining airport-level data, by considering not only the availability of air-HSR intermodal linkage between the airport and HSR station but also the position of the airport’s city in the HSR network (Liu et al. Citation2019). HSR and inter-city coach timetable data have been utilized to evaluate city centrality and city-pair connectivity to compare hierarchical structures (Wang, Du, and Huang Citation2020a). Nevertheless, researchers continue to face limitations in evaluating the impact of HSR. The spatial and temporal scales of economic and demographic data are limited by administrative districts, and some detailed data – such as the number of passengers and survey data of scenic spots – are difficult to obtain (Ye and Carroll Citation2011).
2.2. Spatial relatedness in the big data era
On the other hand, spatiotemporal interaction data is accessible via social media data, which is widely utilized in mapping disasters (Zheng et al. Citation2018), social activities (Tsou et al. Citation2013), public health (Hay et al. Citation2013), spatial planning (Massa and Campagna Citation2014), and event detection (Sakaki, Okazaki, and Matsuo Citation2013). All of these studies illustrate the use of social media in the spatial social sciences. In examining HSR impact on tourism, for instance, check-in data collected revealed a high correlation between HSR and tourism. As such, this data can act as a proxy for real tourism arrivals (Liu and Shi Citation2017). Existing studies have also focused on mining spatial and temporal distribution patterns, instead of measuring spatial interaction between geographic units.
Inter-city flows based on big data provide new perspectives for evaluating spatial interactions. Such connections can be derived using transportation and human travel data (Liu, Andris, and Ratti Citation2010; Phithakkitnukoon et al. Citation2011), or telecommunications data (Gao et al. Citation2013), but these data are difficult to obtain due to privacy and security concerns. Social media account follower data have therefore been used to analyze topological features and to map the spatial distribution of inter-city social interactions in China (Li et al. Citation2013). Data of this type can also be challenging to work with, because user status updates visible on social media are rarely updated, making it difficult to measure the impact of HSR.
Toponyms (place names) from social media also provide a new type of data for mining spatial patterns and relationships (Meijers and Peris Citation2018). Previously, this data has been used to examine how food environments influence food choices (Chen and Yang Citation2014). It has also been used to address the connective strength and differences between geographical entities (Liu et al. Citation2013; Lin, Wu, and Li Citation2019), and to simulate urban growth in metropolitan areas (Lin and Li Citation2015). In addition, toponym data has been used to understand social media users’ geographical awareness of US cities by allowing surveyors to study how Twitter users exchanged and recognized toponyms from various US cities (Han, Tsou, and Clarke Citation2015). The above study was based on the notion of toponym co-occurrence, assuming there is an inter-city association when the names of two cities occur together within the same text or web page. Toponym co-occurrence considers two toponyms is equivalently weighted in the same text, and such results reveal the undirected instead of directed interaction. Thus, the methods that rely on toponym co-occurrences cannot be directly used to quantify asymmetric interaction between cities.
Human behavior can also be reflected in the number of social media posts made by a person, or a community, or even as a whole, as well as the type of content posted. Social events – including emergencies, big events, holidays, and vacations – are common subjects for social media posts (Xu et al. Citation2020; Ghani et al. Citation2019; Dolan et al. Citation2019). In this paper, we utilize toponymy data and geotag information from social media posts to model inter-city interactions and changes in these interactions resulting from HSR.
3. Methods
In existing studies (Han, Tsou, and Clarke Citation2015; Meijers and Peris Citation2018), mentioning the name of a place in a tweet would indicate the awareness of that location. Given this assumption, we use “awareness” to represent the basic interactions between cities implicit in social media data.
3.1. Representing urban interactions with social media data
The city interactions used in this study is very similar to those in the web page texts collected with search engines (Devriendt et al. Citation2011). Rather than only the spatial information (toponym) co-occurring in web page texts, this paper adopts two types of spatial information: toponym information from social media posts, and location information included in social media posts. A post with text that contains the toponym of city j, posted in city i represents an instance of interaction from city i to city j. We refer to this as awareness from city i to city j. When a post mentions more than one city, each city can count once.
From a spatiotemporal perspective, inter-city social interaction extracted from social media can be expressed as a four-tuple (Toponym, location, Count, Time Duration). The “toponym” is the name of city j, the “location” is the name of city i, the “count” is the number of posts, and the “time duration” is the temporal slot for evaluation. A data example is shown in .
Table 1. Data example
3.2. A framework
A larger value of awareness between two cities indicates a high level of interaction between these two cities. The suggested framework measures the strength of such relatedness from two dimensions. The first dimension describes the statistical perspective and the spatial perspective. The second dimension has two scales: global and channel effect. All inter-city interactions are considered and measured on the “global” scale, while the “channel” scale was developed to express characteristics between the terminal cities of an HSR.
The framework of relations between cities is defined from both the statistical dimension and the spatial dimension, as shown in .
Table 2. The framework for assessing impact HSR
In fact, the awareness between cities is directional. The large value of awareness of city A on city B on social media not only means that there is a stronger influence from city B to city A, but it also represents an equally strong dependence of city A on city B. As such, in-awareness is defined as awareness received from other cities, and out-awareness may be defined as awareness given to other cities. The indices in consist of two sub-indices that evaluate both in-awareness and out-awareness, separately. The sub-indices of indices in are listed in . In addition, we will discuss the three indexes in , while relatedness index, spatial relatedness index, and channel effect index will be detailed in Sections 3.2.1, 3.2.2, and 3.2.3, respectively.
Table 3. The index list
The various indicators in the framework of different time periods are examined, and the dynamic effects of HSR rail can be evaluated by observing the changes of the indices before and after the HSR opening.
In a specific period, the relatedness of N cities in social media may be represented by an N × N matrix from the four-tuples in . Cij is the awareness index, which is the number of posts by all users located in city i, and whose text contains the name of city j, from city i to j. The larger Cij denotes the stronger awareness from city i to city j. Due to the differences between city i and city j, usually, Cij is not equal to Cji.
3.2.1. Relatedness index
Because Cij is represented by the number of posts between city i and city j, it is significantly connected with demographic factors (i.e. population, people composition, economy) of the two cities. In existing research, the populations of the two cities are employed to normalize the index. A drawback of this method is that the number of posts is not always significantly correlated with population. It is difficult to quantify the relationship between the number of posts and demographic factors. As shown in in section 4.1, the relationship between the number of posts and population varies in different cities.
Self-awareness is employed as the standard value to model inter-city relatedness, to consider the underlying population distribution. Both an awareness index and a dependence index are proposed in order to evaluate the regional relatedness, based on the regional asymmetry relatedness and the self-awareness.
To examine the total awareness of one city from all the other cities, the awareness index of city i is calculated as:
Where n is the number of cities. The higher IAIi shows that the city i is more concerned by all the cities.
Not only does Cij represent the awareness from city i to city j, but it can also be explained as an output between city i and city j. For examining the dependence of a city to the totality of the cities, the output index of city i is calculated as:
3.2.2. Spatial relatedness index
The Global Awareness Index (GAI) (Han, Tsou, and Clarke Citation2015) estimates in-awareness based on spatial decay in social media. The mathematical expression for calculating what connects three of China’s four first-tier cities – is given by:
Where Gij denotes normalized spatial distance, which is calculated by the actual spatial distance divided by the half length of the Earth’s circumference; and Pi is the population of the i-th city. Reasonably, the higher the GAI is, the more in-awareness there is, stemming from all the observed cities, and the greater the influence city i has on all the cities. In the GAI model (Han, Tsou, and Clarke Citation2015), the population is used to normalize the value of GAI to eliminate the impact of inter-city differences in size. For the same considerations as IAI and OAI, this paper adopts local-awareness instead of population, to model the spatial awareness index. In the SIAI model, Gij is adopted to denote the spatial weight between the i-th city and the j-th city. For a more general model, G can be a spatial adjacency matrix, a distance matrix, or a reverse distance matrix.
Since spatial interaction is bidirectional, the index should be modeled separately in both directions. As a result, the GAI is extended to the SIAI index, and its calculation formula is as follows:
where wij is the spatial weighted matrix, which is a variant of G. For n cities that are located along an HSR line, the wij is denoted by:
For a city, the higher the SIAI, the stronger the influence there is in space. As with SIAIi, the spatial out-awareness index is denoted by
Obviously, the higher SOAIi could represent that the i-th city has a stronger spatial out-awareness on all the other cities.
3.2.3. Channel effect
In general, cities at both ends of the HSR line tend to be important large cities. When an HSR line begins operations, the interaction between the two endpoint areas becomes greatly strengthened. How to quantitatively evaluate changes in interactions is a key concern for high-level decision makers and urban planners. According to economic theory, the channel effect refers to the behavior of majority shareholders, because they transfer capital and profits from the company to themselves (Carlson and Zmud Citation1999). The channel effect suggests that the more resources that are gained from the given channel, the richer communication using that channel, and ultimately the richer the perception of the channel. In this study, the channel effect refers to whether the two cities located at the endpoints of the HSR obtain far greater benefits than other cities through which the HSR passes.
The channel effect is said to be reflected by changes in the spatial in-awareness index and the spatial out-awareness index. The spatial attention index here is adopted to estimate the channel effect because the channel effect mainly focuses on how to evaluate the unbalanced influence of cities in a particular geographical city. The channel effect can be estimated by
Where the i-th city and the j-th city are the two cities in which the HSR line endpoints are located. The TSij and TSji are not equal due because their interactions are asymmetric. The two indices are combined into TS to check the overall channel effect of the high-speed rail line as follows:
Under the randomization assumption, the expected value of TS is:
When TS is greater than expected, it describes an indication that there is a channel effect in the research HSR line. The larger the value, the stronger the channel effect of the HSR line.
Similarly, a channel effect index can be derived from the perspective of economy as following:
where is the channel effect from city i and city j, and
is the GDP of city j. The TE index could be a reference for examining the TS index.
4. Case study
4.1. Data
HSRs in China were first built in 2004 following an announcement by the Chinese government of a long-term plan for railway development. The Beijing-Tianjin high-speed railway that opened on 1 August 2004 was the first HSR line to reach 350 km per hour. Since then, China built the largest HSR network in the world and has improved its existing railways over the course of a decade. As of the end of 2014, the total length of China’s HSR exceeded 16,000 km, accounting for more than 50% of the total length of the global HSR.
China has built the Beijing-Shenzhen HSR line as shown in from 2005 to 2012. The line consists of three parts, the Wuhan-Guangzhou rail, the Guangzhou-Shenzhen rail, and Beijing-Wuhan began running on 26 December 2009, 26 December 2011, and 26 December 2012, respectively. The line connects many cities, and had been in operation for several years so far, accumulating a presence and influence on social media. Recognizing this, we use this line to conduct our research.
Figure 1. Cities and rails
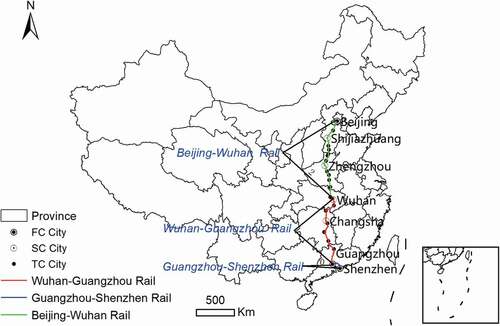
The Beijing-Shenzhen HSR line – which connects three of China’s four first-tier cities – is the main transportation corridor from northern China to southern China. The HSR passes through 35 cities which are classified into four groups as shown in by the size and the role of those cities.
Table 4. The cities located in Beijing-Shenzhen HSR line
The First Group (FC) is composed of Beijing, Guangzhou, and Shenzhen, which are three of four of China’s first-tier cities. The Second Group (SC) consists of Shijiazhuang, Zhengzhou, Wuhan, and Changsha, which are provincial capital cities. The Third Group (TC) includes 17 prefecture-level cities. In addition, the MC group includes small cities and consists of county-level cities. Actually, every MC city is a part of prefecture-level city in the TC group, and so the cities in the MC group will be removed from the following experiments. The interaction between the first three groups (24 cities) was selected as the research focus for this study.
Sina Weibo is a Chinese social media platform described as a cross between Twitter and Facebook platforms. Each post on Weibo is limited to 140 Chinese characters and some pictures. Weibo provides a web search query that can sort through and show posts – as well as provide the number of posts – based on filters, such as post location, content, and time. A search URL example can be organized to “https://s.weibo.com/weibo/? q = 深圳®ion = custom:11:1000&typeall = 1×cope = custom:2010–01-01-0:2010–01-31-23”. Where “深圳” is the Chinese name of Shenzhen city; “custom:11:1000” is used to refine the posts located in Beijing cities; “typeall = 1” means the return results will include all type of posts; “timescope = custom:2010–01-01-0:2010–01-31-23” means the return posts posted in January 2010.
A crawler was developed to simulate the process of post searches and the results were saved as a dataset. The dataset consists of a four-tuple (toponyms, location, count, time duration) as shown in . As such, the interaction between cities in each period forms an origin-destination matrix.
Inter-city interaction Cij was recorded on a month granularity for the 24 research cities in the three groups. The dataset contained 576 records (24 × 24) per month. A total of 27,648 (24 × 24 × 48) records were accumulated over 4 years, and thus the datasets from one city to another city are comprised of 48 Cij.
To examine the correlation between posts and HSR, the cities were classified into 2 groups. The first group cities named “JW” are located along the “Beijing-Wuhan-trail”, and the second group cities named “WG” are located along the “Wuhan-Guangzhou-trail”. The number of posts between the two groups and in each group were calculated and plotted in . In December 2012, the “Beijing-Wuhan- trails” started running, so the “JW” and “WG” cities were directly connected by HSR. During this period, it was observed that the number of posts from “JW” to “WG” increased rapidly. This is clear evidence that the posts in social media can reflect the changes in the relationship between cities.
Figure 2. Number of posts of “JW” cities and “WG” cities
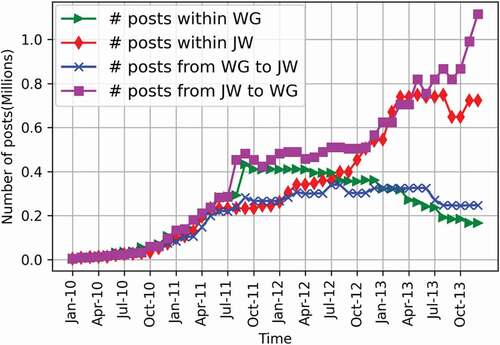
There are fluctuations in the number of posts per month as shown in , largely because posting behavior is closely related to human behavior, which carries a degree of uncertainty.
Table 5. The difference in post numbers in Beijing and Shenzhen over four years
To reduce the uncertainty of the number of posts, records of every Cij, were classified into four groups cataloged by the year. The median value calculated based on a calendar year was employed to represent the value of a year. The new data consisting of median values from each year contained 2034 records for 24 cities over 4 years.
4.2. Results
4.2.1. Population and inter-city social interaction
The population and four groups of Cii (the awareness from city i to itself) were examined for these variations from 2010 to 2013. The data from the five groups are normalized by the maximum value of each group as shown in . The cities in the figure are arranged according to total population from left to right.
Figure 3. Difference between population and the number of local posts in four years from 24 cities
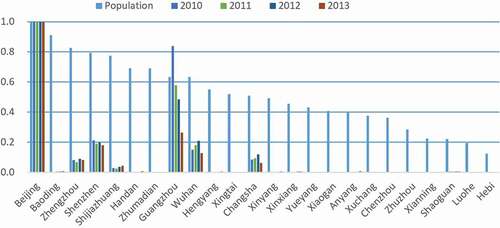
As shown in , a noteworthy difference exists between the number of people and the value of local-awareness (Cii). The value of Cii of three FC cities – Beijing, Guangzhou, and Shenzhen – is significantly higher than that of other cities. A Pearson correlation analysis is employed to examine the correlation between population and local-awareness of those cities. It reveals their differences, as the coefficients between population and Cii are 0.436, 0.486, 0.466, and 0.483 in the 4 years. It shows that population as a variable has some limitations in eliminating the impact of city size on human activities on social media.
The stability of Cii is further examined over time. As shown in , the trend of Cii remains relatively constant over the 4 years. A Pearson correlation analysis was also conducted to verify the interaction of Cii in the four groups. The correlation coefficients between the groups are greater than 0.89, and their statistical significance was less than 0.001 (2-tailed). This means that, although social media user activity is uncertain, the Cii is statistically relatively stable.
The above analysis shows that Cii – or the local-awareness – likely reflects social media activities more accurately than the population for city i. In addition, the distribution of the basic indices is examined as well. The distributional pattern of Cij is shown in . This distribution is long-tailed and consistent with the previous research (Scellato et al. Citation2010).
Figure 4. The distribution of Cij.
Finally, the significance of Cii is examined. It is seen that 66 of the total 2034 records showed Cij>Cjj, or where concern for other cities is greater than local-awareness. The number accounting for 3.24% of the total is statistically significant at the 0.05 level. The number of records of Cij>Cii – which stands for cities with a greater in-awareness rather than a greater local-awareness – is a total of 14 of 2034. The number accounting for 0.66% of the total record has a statistical significance at the 0.01 level. In other words, both inter-city in-awareness and inter-city out-awareness have significant spatial autocorrelation. In summary, the model based on Cii can better evaluate inter-city interaction than a model based on population.
4.2.2. Inter-city relatedness
The inter-city in-awareness index and out-awareness index are calculated and shown in from 2010 to 2013.
Table 6. In-awareness index and out-awareness index
illustrates that the mean and standard variance of the inter-city in-awareness index decreases over time, and the median similarly decreases in each of the preceding 3 years. In general, the trends show that inter-city influence and city differences are decreasing. They also demonstrate that the inter-city dependence and its differences are lessening, and the mean, median, and standard of inter-city out-awareness also continue to decrease.
Although the total rate of each city’s awareness from other cities is increasing (the conclusion in the last section according to the X index), the inter-city in-awareness index and the trend of inter-city out-awareness index are also on a downward trend. According to the definition of IAI and OAI, local-awareness has a higher growth than in-awareness.
Obviously, there are some gaps between the trends of IAI and OAI. These gaps are examined using the difference in the value of IAI and OAI in the same group in the first year (2010), and in the last year (2013) as shown in .
Figure 5. (a) The difference (IAI- OAI) of cities between IAI and OAI in 2010. (b) The difference (IAI- OAI) of cities between IAI and OAI in 2013
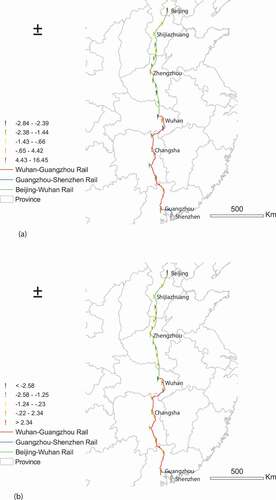
As can be seen from , in most cities, the value of out-awareness is greater than the value of in-awareness. To detail those differences, the ranked IAI and ranked OAI for seven central cities from 2010 to 2013 are listed in .
Table 7. Comparison IAI and OAI between in seven central cities
As can be seen from , the in-awareness index and out-awareness index are negatively correlated. The seven central cities (FC cities and SC cities) occupy the top seven spots in the rankings of the in-awareness index from 2010 to 2014, even though their out-awareness indices are very low.
4.2.3. Spatial in-awareness and spatial out-awareness
Spatial in-awareness and spatial out-awareness are used to evaluate inter-city interaction based on spatial decay theory. The values of these indices from 2010 to 2013 are shown in .
Figure 6. SIAI and SOAI from 2010 to 2013
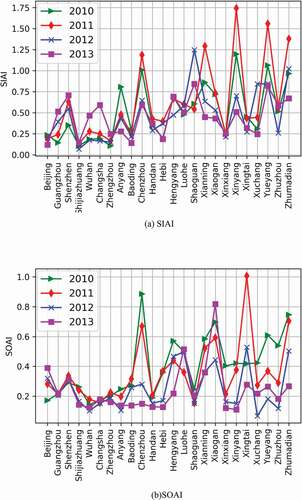
The cities in are sorted according to the grouping of the cities (FC, SC, TC) from left to right. To illustrate the differences between central cities and TC cities in SIAI and SOAI, the average level of central cities (FC cities and SC cities) and TC cities have been examined over the 4 years as shown in .
Table 8. Comparison of SIAI between the central cities and TC cities
illustrates that the SIAI and SOAI of the seven central cities are lower than those of the other cities. In other words, these seven central cities have less in-awareness and out-awareness than in other cities.
This paper considers the increase in SIAI and SOAI from 2010 to 2013 as shown in to examine the impact of HSR. also shows that the average SIAI of six of the seven central cities is on an upward trend while that of 11 of the 17 TC cities is decreasing. In other words, HSR improves the degree of influence of the central cities.
Figure 7. SIAI and SOAI differences from 2010 to 2013
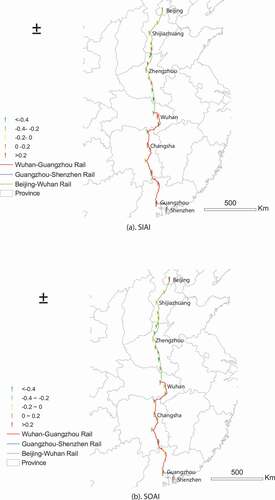
The increment of out-awareness indices are depicted in ). The average out-awareness and the individual out-awareness of five of the seven central cities increased between 2010 and 2013, while the average out-awareness and the individual out-awareness for 15 of the 17 TC cities decreased. These findings suggest that HSR improves the spatial out-awareness of central cities in the TC cities.
4.2.4. Impact and travel time
The great advantage of HSR is that it reduces inter-city travel times and provides additional convenience. The reduction in time is an important factor that causes people to choose HSR as their mode of transport. Previous studies have verified that the significant change in inter-city relatedness is created by HSR in the two-hour travel time (Wang et al. Citation2015). To quantify the interaction between HSR impact and travel time, we adopt SIAI and SOAI to conduct the inter-city relatedness over cities from 2010 to 2013.
Nearly 100 trains are running through cities in the Beijing-Shenzhen HSR. Even between the two cities, the trip times vary slightly due to stop conditions and changes in schedules. To simplify the calculation of the trip cost, trip time is set as the travel distance divided by the HSR average speed. The distance between cities can be evaluated using the spatial distance because the HSR is a relatively straight line. Results from the previous section show that HSR has opposing impacts on the seven central cities (FC & SC cities), as well as 17 non-central cities (TC). The spatial relatedness, SIAI and SOAI, will be examined by two groups separated based on whether or not the city is a central city. The experimental results are shown in .
Figure 8. The improvement of SIAI and SOAI between 2010 to 2013 within given hours
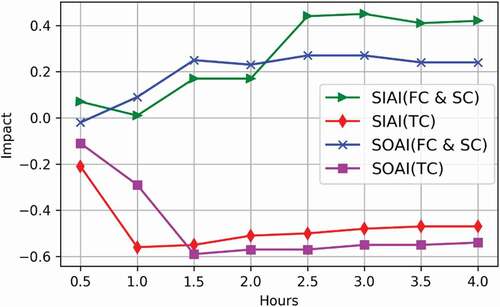
On the local scale, there is a significant improvement in the spatial in-awareness and spatial out-awareness in the seven central cities since the HSR began operations. These trends are consistent with global trends. The SIAI curve reached the top at 3 h, and slightly decreased after that. The SOAI curve peaked at 1.5 h, and remains stable within a larger spatial scale. The strengthened SIAI and SOAI for central cities indicates that local relatedness for each is strengthened, and their centrality is enhanced.
The trend of SIAI and SOAI in non-central cities conflicts with the trends in the central cities. The SIAI and SOAI touch the bottom of the curve at 1 h and 1.5 h, respectively, and then begin to rise slowly. These data show that they have less influence and connection with the HSR in operation. It can be seen from that the impact of HSR in the two groups varies based on travel time. This shows the differences in radiation between the two groups. HSR improves radiation of the central city within a distance of 3 h or more, while it decreases the non-central cities’ radiation in the near distance (about 1–1 h). This change in radiation shows that the influence scope of HSR is not balanced, wherein the central cities’ influence is larger than non-central cities’ in spatial scope.
4.2.5. Channel effect
The channel effect demonstrates that there is a stronger connection between the starting city and the ending city than other cities, which can be quantified by the difference between the endpoint relatedness of the HSR and the total relatedness. There were two different tunnels formed between 2010 and 2013 in the HSR from Beijing to Shenzhen, due to the fact that the HSR started its service from Wuhan to Shenzhen at first and began its service for the rest of the line later. The first tunnel running from Wuhan to Shenzhen opened in 2012. The tunnel was discontinued when the second tunnel was constructed due to the HSR running from Beijing to Wuhan in 2013, and a new tunnel from Beijing to Shenzhen was formed. Both channel effect indices are examined from 2010 to 2013 as shown in , where TE presents the channel effect index derived from perspective of economy.
Table 9. TE and TS indices from 2010 to 2013
At the year an HSR line begin running, the channel effects of the HSR line are shown with bold font.
It can be seen from that the TE index based on inter-city economy has some limitations when evaluating the channel effect: 1) The TE index does not reflect the inter-city channel effect correctly as the TE indices in bold show a lower-than-expected value, which is 0.0413 in this case. 2) The TE index need not indicate the impact of the HSR. For example, the TE index does not change significantly when a new HSR begins to run.
The TS index represents the inter-city influence caused by HSR, as a comparison point for the TE index. It shows a significant channel effect, as the TS indices are far greater than the expected value of 0.043 in both groups. In the first group, the trend of the TS indices in decreased in 2010 and 2011, but increased in 2012 after the HSR began running. The index decreased again in 2013, at which time the Wuhan-Shenzhen was no longer a tunnel since Wuhan was no longer the endpoint of the HSR. In the second group, the TS index increased significantly when the Beijing-Shenzhen tunnel formed. In addition, the channel effect is not symmetrical, especially in the first group where the index from Wuhan to Shenzhen (0.319) is far greater than the index for Shenzhen to Wuhan (0.043).
5. Discussion
Alongside HSR promotes economic growth (Chan and Yuan Citation2017; Coronado, Ureãąa, and Miralles Citation2019), it also fosters an uneven relationship of economic, labor migration, and house values among cities (GutiÚrrez, GonzÃąlez, and Gãŗmez Citation1996; Qin Citation2017; Jin et al. Citation2017; Biggiero et al. Citation2017; Shao, Tian, and Yang Citation2017). It is challenging to precisely quantify such change because it is multidimensional and across multiple disciplines.
The data recording the interaction between cities provide a new perspective to qualify the uneven relationships in the temporal context. Because social media data is featured with both spatial and temporal information, this paper captures interactions between cities based on social media data to develop a methodological framework evaluating inter-city relatedness and HSR influence. The framework generates a set of new metrics to advance the study of the impact of HSR.
In line with studies of spatial accessibility, HSR construction would lead to spatial cohesion for cities (Li et al. Citation2018). The study examines fine-grained unbalances from the perspective of central cities and non-central cities. The central cities have high in-awareness and low out-awareness, while non-central cities have lower in-awareness. Very interestingly, the results also show that non-central cities benefit more from HSR than central cities. This provides support from the computing perspective to explain why policy makers hope to build HSR through their cities.
The results of this study suggest that HSR promotes the spatial imbalance between central cities and non-central cities. Specifically, HSR improves the spatial interaction of central cities and reduces the spatial interaction of non-central cities. The spatial impact from HSR between the central city and the non-central city is different. In particular, the central city affects inter-city interactions of more than 3 h of travel distance, while the non-central city has a greater impact within 2 h of travel. Consequently, policymakers in central and non-central cities should adopt different strategies when formulating policies.
Viewing the HSR line as a corridor, the cities at both ends of the HSR form a natural channel between them. The end cities are usually big cities. The channeling effect between two HSR end cities tend to be more significant. At the same time, Spatial and Social Equity Railway Indexes (SpREI and SoREI) are derived to assess the variation in travel times, number of connections, prices and population affected by HSR (Cavallaro et al. Citation2020). These two indexes reveal that the inter-city connection has decreased due to the significant increase in ticket prices, so the introduction of HSRs might generate the inequalities in the territorial connections. Hence, the need of compensation is expected from the policy makers. Because of the large spatial coverage and high-volume investment, the impact of HSR construction on socio-economic, political, cultural, and society is large and long-lasting.
This study is limited by the bias of social media content, because most users are young people. Inaddition, there may be some noise or missing data in the interaction data obtained because somecities have more than one name, while some cities have the same name. The significantly large value of Cii in Guangzhou in 2010 is because Guangzhou hosted the 16th Asian Games from 12 November to 27 November 2010. It will be a follow-up study to develop algorithms to deal with the bursting mentions of a city due to special events while calculating urban interaction.
6. Conclusion
This research develops a methodological framework to evaluate impacts of regional rail investment, HSR in China mainland, on the urban system. The framework measures inter-city in-awareness and out-awareness, and combines the spatial decay to define spatial in-awareness and spatial out-awareness. It also proposes a measurement for the channel effect. The relatedness model in this framework can not only evaluate the inter-city asymmetric interaction, but can also evaluate the inter-city relatedness more effectively than the traditional methodology. In addition, the relatedness model can be used to examine inter-city interaction. Furthermore, the framework sensitively reflects the changes of inter-city relatedness via a new perspective and provides an effective method to evaluate HSR impacts. Finally, the Beijing-Shenzhen HSR, which connects three of China’s four first-tier cities, is used as a case study to demonstrate the applicability of the framework.
The follow-up research can incorporate more HSR lines to estimate the overall impact of HSR. In addition, migration data, traditional rail system and economic data between cities can be combined with social media data to assess HSR’s impact on inter-city traffic.
Disclosure statement
No potential conflict of interest was reported by the author(s).
Data availability statement
The data that support the findings of this study are available from the corresponding author, X. Ye, upon reasonable request. https://github.com/jfgong1/HSRcities/blob/main/cites-release.csv
Additional information
Funding
Notes on contributors
Junfang Gong
Junfang Gong is an associate professor in China University of Geosciences (Wuhan). She received her PhD degree from China University of Geosciences (Wuhan). Her research interest is spatial data analysis.
Shengwen Li
Shengwen Li is an associate professor in China University of Geosciences (Wuhan). He received his PhD degree in geographic information engineering from China University of Geosciences (Wuhan), in 2010. His research interests include spatial statistics, geospatial Artificial Intelligence, natural language processing.
Xinyue Ye
Xinyue Ye is Harold Adams Endowed Professor in Department of Landscape Architecture and Urban Planning, Texas A&M University. He received his PhD degree from the joint program of University of California-Santa Barbara and San Diego State University. His research interests are human dynamics and urban computing.
Qiong Peng
Qiong Peng received his PhD degree from University of Maryland. His research interests are housing market and urban science.
Sonali Kudva
Sonali Kudva is Professor of Instruction I at Department of Communication, University of Tampa. She received her PhD degree from Kent State University. Her research interest is on the relationships between mass media and society.
References
- Andris, C. 2016. “Integrating Social Network Data into GISystems.” International Journal of Geographical Information Science 30 (10): 2009–2031.
- Audikana, A. 2021. “Is Planning Still Political? the Politicization of High-speed Rail in Spain (1986–2016).” Political Geography 84: 102269. doi:https://doi.org/10.1016/j.polgeo.2020.102269.
- Biggiero, L., F. Pagliara, A. Patrone, F. Peruggini. 2017. “Spatial Equity and High-speed Rail Systems.” International Journal of Transport Development and Integration 1 (2): 194–202. doi:https://doi.org/10.2495/TDI-V1-N2-194-202.
- Campagna, M., 2014. “The Geographic Turn in Social Media: Opportunities for Spatial Planning and Geodesign”. Paper presented at the Proceedings of the International Conference on Computational Science and Its Applications, Guimaraes, Portugal, June 30 - July 3, 598–610.
- Cao, G., S. Wang, M. Hwang, A. Padmanabhan, Z. Zhang, K. Soltani. 2015. “A Scalable Framework for Spatiotemporal Analysis of Location-based Social Media Data”. Computers, Environment and Urban Systems 51: 70–82. doi:https://doi.org/10.1016/j.compenvurbsys.2015.01.002.
- Cao, W., X. Feng, and H. Zhang. 2019. “The Structural and Spatial Properties of the High-speed Railway Network in China: A Complex Network Perspective.” Journal of Rail Transport Planning & Management 9: 46–56. doi:https://doi.org/10.1016/j.jrtpm.2018.10.001.
- Carlson, J. R., and R. W. Zmud. 1999. “Channel Expansion Theory and the Experiential Nature of Media Richness Perceptions.” Academy of Management Journal 42 (2): 153–170.
- Cavallaro, F., F. Bruzzone, and S. Nocera. 2020. “Spatial and Social Equity Implications for High-Speed Railway Lines in Northern Italy.” Transportation Research Part A: Policy and Practice 135: 327–340.
- Chan, C.-S., and J. Yuan. 2017. “Changing Travel Behaviour of High-speed Rail Passengers in China.” Asia Pacific Journal of Tourism Research 22 (12): 1221–1237. doi:https://doi.org/10.1080/10941665.2017.1391303.
- Chen, X., and X. Yang. 2014. “Does Food Environment Influence Food Choices? A Geographical Analysis through ‘Tweets’.” Applied Geography 51: 82–89. doi:https://doi.org/10.1016/j.apgeog.2014.04.003.
- Chen, Z. 2017. “Impacts of High-speed Rail on Domestic Air Transportation in China.” Journal of Transport Geograph 62: 184–196. doi:https://doi.org/10.1016/j.jtrangeo.2017.04.002.
- Chen, Z., and K. E. Haynes. 2015. “Impact of High Speed Rail on Housing Values: An Observation from the Beijing-Shanghai Line.” Journal of Transport Geography 43: 91–100. doi:https://doi.org/10.1016/j.jtrangeo.2015.01.012.
- Cheng, Y.-S., B. P. Y. Loo, and R. Vickerman. 2015. “High-speed Rail Networks, Economic Integration and Regional Specialisation in China and Europe.” Travel Behaviour and Society 2 (1): 1–14. doi:https://doi.org/10.1016/j.tbs.2014.07.002.
- Coronado, J. M., J. M. D. Ureãąa, and J. L. Miralles. 2019. “Short- and Long-term Population and Project Implications of High-speed Rail for Served Cities: Analysis of All Served Spanish Cities and Re-evaluation of Ciudad Real and Puertollano.” European Planning Studies 27 (3): 434–460. doi:https://doi.org/10.1080/09654313.2018.1562652.
- Deng, T., C. Gan, A. Perl, D. Wang. 2020. “What Caused Differential Impacts on High-speed Railway Station Area Development? Evidence from Global Nighttime Light Data”. Cities 97: 102568. doi:https://doi.org/10.1016/j.cities.2019.102568.
- Deng, T., D. Wang, Y. Yang, H. Yang. 2019. “Shrinking Cities in Growing China: Did High Speed Rail Further Aggravate Urban Shrinkage?”. Cities 86: 210–219. doi:https://doi.org/10.1016/j.cities.2018.09.017.
- Devriendt, L., A. Boulton, S. Brunn, B. Derudder, F. Witlox. 2011. “Searching for Cyberspace: The Position of Major Cities in the Information Age.” Journal of Urban Technology 18 (1): 73–92. doi:https://doi.org/10.1080/10630732.2011.578410.
- Diao, M., Y. Zhu, and J. Zhu. 2016. “Intra-city Access to Inter-city Transport Nodes: The Implications of High-speed-rail Station Locations for the Urban Development of Chinese Cities.” Urban Studies 54 (10): 2249–2267. doi:https://doi.org/10.1177/0042098016646686.
- Dolan, R., J. Conduit, C. Frethey-Bentham, J. Fahy, S. Goodman. 2019. “Social Media Engagement Behavior.” European Journal of Marketing 53 (10): 2213–2243. doi:https://doi.org/10.1108/EJM-03-2017-0182.
- Flowerdew, R., and A. Lovett. 2010. “Fitting Constrained Poisson Regression Models to Interurban Migration Flows.” Geographical Analysis 20 (4): 297–307. doi:https://doi.org/10.1111/j.1538-4632.1988.tb00184.x.
- Gao, S., Yu Liu, Y. Wang, X. Ma. 2013. “Discovering Spatial Interaction Communities from Mobile Phone Data.” Transactions in GIS 17 (3): 463–481. doi:https://doi.org/10.1111/tgis.12042.
- Gao, Y., W. Su, and K. Wang. 2019. “Does High-speed Rail Boost Tourism Growth? New Evidence from China.” Tourism Management 72: 220–231. doi:https://doi.org/10.1016/j.tourman.2018.12.003.
- Ghani, N. A., S. Hamid, I A. Targio Hashem, E. Ahmed. 2019. “Social Media Big Data Analytics: A Survey”. Computers in Human Behavior 101: 417–428. doi:https://doi.org/10.1016/j.chb.2018.08.039.
- Guirao, B., A. Lara-Galera, and J. L. Campa. 2017. “High Speed Rail Commuting Impacts on Labour Migration: The Case of the Concentration of Metropolis in the Madrid Functional Area.” Land Use Policy 66: 131–140. doi:https://doi.org/10.1016/j.landusepol.2017.04.035.
- Guirao, B., and J. L. Campa. 2015. “The Effects of Tourism on HSR: Spanish Empirical Evidence Derived from a Multi-criteria Corridor Selection Methodology.” Journal of Transport Geography 47: 37–46. doi:https://doi.org/10.1016/j.jtrangeo.2015.07.010.
- Guirao, B., J. L. Campa, and N. Casado-Sanz. 2018. “Labour Mobility between Cities and Metropolitan Integration: The Role of High Speed Rail Commuting in Spain.” Cities 78: 140–154. doi:https://doi.org/10.1016/j.cities.2018.02.008.
- Guldmann, J.-M. 2005. “Competing Destinations and Intervening Opportunities Interaction Models of Inter-city Telecommunication Flows*.” Papers in Regional Science 78 (2): 179–194. doi:https://doi.org/10.1111/j.1435-5597.1999.tb00739.x.
- Guo, Y., B. Li, and Y. Han. 2020. “Dynamic Network Coupling between High-speed Rail Development and Urban Growth in Emerging Economies: Evidence from China.” Cities 105: 102845. doi:https://doi.org/10.1016/j.cities.2020.102845.
- GutiÚrrez, J., R. GonzÃąlez, and G. Gãŗmez. 1996. “The European High-speed Train Network.” Journal of Transport Geography 4 (4): 227–238. doi:https://doi.org/10.1016/S0966-6923(96)00033-6.
- Han, S. Y., M.-H. Tsou, and K. C. Clarke. 2015. “Do Global Cities Enable Global Views? Using Twitter to Quantify the Level of Geographical Awareness of U.S. Cities.” PLoS ONE 10 (7): e0132464–e0132464. doi:https://doi.org/10.1371/journal.pone.0132464.
- Hay, S. I., D B. George, C L. Moyes, J S. Brownstein. 2013. “Big Data Opportunities for Global Infectious Disease Surveillance.” PLoS Medicine 10 (4): e1001413–e1001413. doi:https://doi.org/10.1371/journal.pmed.1001413.
- Hesse, M. 2010. “Cities, Material Flows and the Geography of Spatial Interaction: Urban Places in the System of Chains.” Global Networks 10 (1): 75–91. doi:https://doi.org/10.1111/j.1471-0374.2010.00275.x.
- Jiao, J., J. Wang, and F. Jin. 2017. “Impacts of High-speed Rail Lines on the City Network in China.” Journal of Transport Geography 60: 257–266. doi:https://doi.org/10.1016/j.jtrangeo.2017.03.010.
- Jin, F., J. Jiao, Y. Qi, Yu Yang. 2017. “Evolution and Geographic Effects of High-speed Rail in East Asia: An Accessibility Approach.” Journal of Geographical Sciences 27 (5): 515–532. doi:https://doi.org/10.1007/s11442-017-1390-8.
- Li, Q., X. Chang, S-L. Shaw, Ke Yan, Y. Yue, B. Chen. 2013. “Characteristics of Micro-blog Inter-city Social Interactions in China.” Journal of Shenzhen University Science and Engineering 30 (5): 441–449. doi:https://doi.org/10.3724/SP.J.1249.2013.05441.
- Li, S., X. Ye, J. Lee, J. Gong, and C. Qin. 2017. “Spatiotemporal Analysis of Housing Prices in China: A Big Data Perspective.” Applied Spatial Analysis and Policy 10 (3): 421–433. doi:https://doi.org/10.1007/s12061-016-9185-3.
- Li, T., S. Zhang, X. Cao, F. Witlox. 2018. “Does a Circular High-speed Rail Network Promote Efficiency and Spatial Equity in Transport Accessibility? Evidence from Hainan Island, China.” Transportation Planning and Technology 41 (7): 779–795. doi:https://doi.org/10.1080/03081060.2018.1504186.
- Li, X., Bo Huang, R. Li, Y. Zhang. 2016. “Exploring the Impact of High Speed Railways on the Spatial Redistribution of Economic Activities - Yangtze River Delta Urban Agglomeration as a Case Study”. Journal of Transport Geography 57: 194–206. doi:https://doi.org/10.1016/j.jtrangeo.2016.10.011.
- Liao, W. 2014. “Radiated Region Studies of the Beijing-shanghai High-speed Rail Node Cities Based on the Gravity Model”. Paper presented at the Proceedings of the International Conference on Logistics, Informatics and Services Sciences, California, USA, July 23- 26, 787–793.
- Lin, J., and X. Li. 2015. “Simulating Urban Growth in a Metropolitan Area Based on Weighted Urban Flows by Using Web Search Engine.” International Journal of Geographical Information Science 29 (10): 1721–1736. doi:https://doi.org/10.1080/13658816.2015.1034721.
- Lin, J., Z. Wu, and X. Li. 2019. “Measuring Inter-city Connectivity in an Urban Agglomeration Based on Multi-source Data.” International Journal of Geographical Information Science 33 (5): 1062–1081. doi:https://doi.org/10.1080/13658816.2018.1563302.
- Liu, L., C. Andris, and C. Ratti. 2010. “Uncovering Cabdrivers’ Behavior Patterns from Their Digital Traces.” Computers, Environment and Urban Systems 34 (6): 541–548. doi:https://doi.org/10.1016/j.compenvurbsys.2010.07.004.
- Liu, S., Y. Wan, H-K. Ha, Y. Yoshida, and A. Zhang. 2019. “Impact of High-speed Rail Network Development on Airport Traffic and Traffic Distribution: Evidence from China and Japan.” Transportation Research Part A: Policy and Practice 127: 115–135.
- Liu, Y., F. Wang, C. Kang, Y. Gao, Y. Lu. 2013. “Analyzing Relatedness by Toponym Co-Occurrences on Web Pages.” Transactions in GIS 18 (1): 89–107. doi:https://doi.org/10.1111/tgis.12023.
- Liu, Y., and J. Shi. 2017. “How Inter-city High-speed Rail Influences Tourism Arrivals: Evidence from Social Media Check-in Data.” Current Issues in Tourism 22 (9): 1025–1042. doi:https://doi.org/10.1080/13683500.2017.1349080.
- Meijers, E., and A. Peris. 2018. “Using Toponym Co-occurrences to Measure Relationships between Places: Review, Application and Evaluation.” International Journal of Urban Sciences 23 (2): 246–268. doi:https://doi.org/10.1080/12265934.2018.1497526.
- Pagliara, F., and F. Mauriello. 2020. “Modelling the Impact of High Speed Rail on Tourists with Geographically Weighted Poisson Regression.” Transportation Research Part A: Policy and Practice 132: 780–790.
- Phithakkitnukoon, S., F. Calabrese, Z. Smoreda, and C. Ratti. 2011. “Out of Sight Out of Mind–How Our Mobile Social Network Changes during Migration”. Paper presented at the Proceedings of the 2011 IEEE Third International Conference on Privacy, Security, Risk and Trust and 2011 IEEE Third International Conference on Social Computing, Boston, USA, October 9- 11, 515–520.
- Qin, Y. 2017. “‘No County Left Behind?’ the Distributional Impact of High-speed Rail Upgrades in China.” Journal of Economic Geography 17 (3): 489–520.
- Sakaki, T., M. Okazaki, and Y. Matsuo. 2013. “Tweet Analysis for Real-Time Event Detection and Earthquake Reporting System Development.” IEEE Transactions on Knowledge and Data Engineering 25 (4): 919–931. doi:https://doi.org/10.1109/TKDE.2012.29.
- Savidge, N., 2021. “Biden Infrastructure Bill Could Be California High-speed Rail’s ‘Lifeline’ [Online].” Accessed 21 April 2021. https://www.mercurynews.com/2021/04/04/biden-infrastructure-bill-could-be-california-high-speed-rails-lifeline/
- Scellato, S., C. Mascolo, M. Musolesi, and V. Latora. 2010. “Distance Matters: Geo-social Metrics for Online Social Networks.” Paper presented at the Proceedings of the 3rd Workshop on Online Social Networks, Boston, USA, June 22.
- Shao, S., Z. Tian, and L. Yang. 2017. “High Speed Rail and Urban Service Industry Agglomeration: Evidence from China’s Yangtze River Delta Region.” Journal of Transport Geography 64: 174–183. doi:https://doi.org/10.1016/j.jtrangeo.2017.08.019.
- Taylor, P. J., and B. Derudder. 2004. World City Network: A Global Urban Analysis. London: Routledge.
- Tian, M., T. Li, X. Ye, H. Zhao, and X. Meng. 2021. “The Impact of High-speed Rail on Service Industry Agglomeration in Peripheral Cities.” Transportation Research Part D 93: 102745. doi:https://doi.org/10.1016/j.trd.2021.102745.
- Tsou, M.-H., J-A. Yang, D. Lusher, Su Han, B. Spitzberg, J M. Gawron, D. Gupta. 2013. “Mapping Social Activities and Concepts with Social Media (Twitter) and Web Search Engines (Yahoo and Bing): A Case Study in 2012 US Presidential Election.” Cartography and Geographic Information Science 40 (4): 337–348. doi:https://doi.org/10.1080/15230406.2013.799738.
- Wang, D., T. Chen, L. Lu, L. Wang, and A. L. Alan. 2015. “Mechanism and HSR Effect of Spatial Structure of Regional Tourist Flow: Case Study of Beijing-Shanghai HSR in China.” Dili Xuebao/Acta Geographica Sinica 70 (2): 214–233.
- Wang, J., D. Du, and J. Huang. 2020a. “Inter-city Connections in China: High-speed Train Vs. Inter-city Coach.” Journal of Transport Geography 82: 102619. doi:https://doi.org/10.1016/j.jtrangeo.2019.102619.
- Wang, L., R. A. Acheampong, and S. He. 2020b. “High-speed Rail Network Development Effects on the Growth and Spatial Dynamics of Knowledge-intensive Economy in Major Cities of China.” Cities 105: 102772. doi:https://doi.org/10.1016/j.cities.2020.102772.
- Wang, L., and X. Duan. 2018. “High-speed Rail Network Development and Winner and Loser Cities in Megaregions: The Case Study of Yangtze River Delta, China.” Cities 83: 71–82. doi:https://doi.org/10.1016/j.cities.2018.06.010.
- Wang, X., and W. Zhang. 2019. “Efficiency and Spatial Equity Impacts of High-speed Rail on the Central Plains Economic Region of China.” Sustainability 11 (9): 2583. doi:https://doi.org/10.3390/su11092583.
- Wang, Y., W. Jiang, S. Liu, X. Ye, and T. Wang. 2016. “Evaluating Trade Areas Using Social Media Data with a Calibrated Huff Model.” ISPRS International Journal of Geo-Information 5 (7): 112. doi:https://doi.org/10.3390/ijgi5070112.
- Xiao, Y., F. Wang, Yu Liu, J. Wang. 2013. “Reconstructing Gravitational Attractions of Major Cities in China from Air Passenger Flow Data, 2001-2008: A Particle Swarm Optimization Approach.” The Professional Geographer 65 (2): 265–282. doi:https://doi.org/10.1080/00330124.2012.679445.
- Xu, J., M. Zhang, X. Zhang, Di Wang, Y. Zhang. 2019. “How Does City-cluster High-speed Rail Facilitate Regional Integration? Evidence from the Shanghai-Nanjing Corridor”. Cities 85: 83–97. doi:https://doi.org/10.1016/j.cities.2018.12.003.
- Xu, Z., Y. Liu, N Y. Yen, L. Mei, X. Luo, X. Wei, C. Hu. 2020. “Crowdsourcing Based Description of Urban Emergency Events Using Social Media Big Data.” IEEE Transactions on Cloud Computing 8 (2): 387–397. doi:https://doi.org/10.1109/TCC.2016.2517638.
- Yang, H., G. Burghouwt, J. Wang, T. Boonekamp, M. Dijst. 2018a. “The Implications of High-speed Railways on Air Passenger Flows in China”. Applied Geography 97: 1–9. doi:https://doi.org/10.1016/j.apgeog.2018.05.006.
- Yang, H., M. Dijst, P. Witte, H. Van Ginkel, W. Yang. 2018b. “The Spatial Structure of High Speed Railways and Urban Networks in China: A Flow Approach.” Tijdschrift Voor Economische En Sociale Geografie 109 (1): 109–128. doi:https://doi.org/10.1111/tesg.12269.
- Yang, J.-A., M-H. Tsou, K. Janowicz, K C. Clarke, P. Jankowski. 2019. “Reshaping the Urban Hierarchy: Patterns of Information Diffusion on Social Media.” Geo-spatial Information Science 22 (3): 149–165. doi:https://doi.org/10.1080/10095020.2019.1641970.
- Ye, X., and M. C. Carroll. 2011. “Exploratory Space-time Analysis of Local Economic Development.” Applied Geography 31 (3): 1049–1058. doi:https://doi.org/10.1016/j.apgeog.2011.02.003.
- Ye, X., and X. Wei. 2019. “A Multi-Dimensional Analysis of El Niãąo on Twitter: Spatial, Social, Temporal, and Semantic Perspectives.” ISPRS International Journal of Geo-Information 8 (10): 436. doi:https://doi.org/10.3390/ijgi8100436.
- Yu, D., D. Murakami, Y. Zhang, X. Wu, D. Li, X. Wang, G. Li. 2020. “Investigating High-speed Rail Construction’s Support to County Level Regional Development in China: An Eigenvector Based Spatial Filtering Panel Data Analysis”. Transportation Research Part B: Methodological 133: 21–37. doi:https://doi.org/10.1016/j.trb.2019.12.006.
- Zhang, A., Y. Wan, and H. Yang. 2019. “Impacts of High-speed Rail on Airlines, Airports and Regional Economies: A Survey of Recent Research.” Transport Policy 81: A1–A19. doi:https://doi.org/10.1016/j.tranpol.2019.06.010.
- Zhang, Z., D. Yin, K. Virrantaus, X. Ye, and S. Wang. 2021. “Modeling Human Activity Dynamics: An Object-class Oriented Space–time Composite Model Based on Social Media and Urban Infrastructure Data.” Computational Urban Science 1 (1): 1–13. doi:https://doi.org/10.1007/s43762-021-00006-x.
- Zhen, F., X. Qin, X. Ye, H. Sun, Z. Luosang. 2019. “Analyzing Urban Development Patterns Based on the Flow Analysis Method”. Cities 86: 178–197. doi:https://doi.org/10.1016/j.cities.2018.09.015.
- Zheng, L., F. Wang, X. Zheng, B. Liu. 2018. “Discovering the Relationship of Disasters from Big Scholar and Social Media News Datasets.” International Journal of Digital Earth 12 (11): 1341–1363. doi:https://doi.org/10.1080/17538947.2018.1514082.