
 ?Mathematical formulae have been encoded as MathML and are displayed in this HTML version using MathJax in order to improve their display. Uncheck the box to turn MathJax off. This feature requires Javascript. Click on a formula to zoom.
ABSTRACT
The COVID-19 epidemic widely spread across China from Wuhan, Hubei Province, because of huge migration before 2020 Chinese New Year. Previous studies demonstrated that population outflows from Wuhan determined COVID-19 cases in other cities but neglected spatial heterogeneities of their relationships. Here, we use Geographically Weighted Regression (GWR) model to investigate the spatially varying influences of outflows from Wuhan. Overall, the GWR model increases explanatory ability of outflows from Wuhan by 20%, with the adjusted R2 increasing from ~0.6 of Ordinary Least Squares (OLS) models to ~0.8 of GWR models. The coefficient between logarithmic of outflows from Wuhan and COVID-19 cases in other cities is generally less than 1. The sub-linear scaling relationship indicates the increasing returns of outflows was restrained, proving the epidemic was efficiently controlled outside Hubei at the beginning without obvious local transmissions. Coefficients in GWR models vary in cities. Not only cities around Wuhan but also cities having close connections with Wuhan experienced higher coefficients, showing a higher vulnerability of these cities. The secondary or multi-level transmission networks deserve to be further explored to fully uncover influences of migrations on the COVID-19 pandemic.
1. Introduction
The Coronavirus Disease 2019 (COVID-19) was firstly reported in December, 2019 in Wuhan, the capital city of Hubei Province in Central China. To prevent the spread of the COVID-19 epidemic, Wuhan was officially locked down at 10:00 a.m. on January 23th, 2020 until being unblocked on April 8th, 2020 (Kraemer et al. Citation2020; Chinazzi et al. Citation2020). The lockdown of Wuhan significantly delayed the report of COVID-19 cases in other Chinese cities by about three days (Tian et al. Citation2020). However, the COVID-19 epidemic exactly met the Chinese annually Chunyun with typically 3 billion trips before and after the Lunar New Year in recent years. A large number of people have already moved to all over the country from Wuhan before January 23th, 2020 (Jia et al. Citation2020). Massive migration caused the COVID-19 epidemic rapidly spreading across China, further changing our world deeply (Altan and Dowman Citation2021; Xu et al. Citation2021).
The spread of infectious diseases is closely correlated with human mobility, particularly in modern societies with high frequency contacts and interactive movements of population (Balcan et al. Citation2009; Wesolowski et al. Citation2012). The number of COVID-19 cases confirmed in China has been verified to be highly correlated with population outflows from Wuhan no matter at the provincial level (Chinazzi et al. Citation2020; Tian et al. Citation2020) or the city level (Jia et al. Citation2020; Wei et al. Citation2021; Mu, Yeh, and Zhang Citation2020). Jia et al. (Citation2020) even proved that population outflow from Wuhan was the dominant predictive factor for COVID-19 cases in other Chinese cities. The incidences and spread of infectious diseases show obvious spatio-temporal heterogeneities (Thomas et al. Citation2020; Castro et al. Citation2021), and population outflows from Wuhan also show varying amounts as for different cities. Thus, the spatial heterogeneities in the relationship between outflows from Wuhan and COVID-19 cases in other Chinese cities should be concerned specifically (Chen et al. Citation2021). However, note that this topic has been largely ignored.
Mobile phone data effectively supports public health actions in combating COVID-19 and it has also been widely used in other urban studies (Oliver et al. Citation2020; Huang and Wang Citation2020). Mobile phone data has been used to calculate population flow, which is provided by telecommunication carriers (Jia et al. Citation2020) or internet companies with location-based services (LBS) by phone applications, such as Baidu and Tencent in China (Tian et al. Citation2020; Chinazzi et al. Citation2020; Kraemer et al. Citation2020). Inter-national modeling of the spread of COVID-19 has adopted airline transportation data (Chinazzi et al. Citation2020; Lau et al. Citation2020). In comparison, mobile phone data collected from telecommunication carriers is more accurate. Jia et al. (Citation2020) precisely counted population outflows from Wuhan to each Chinese city during the early January in 2020 using mobile phone data from one major national telecommunication carrier in China.
In this study, we aim at investigating the local relationships between population outflows from Wuhan and COVID-19 cases in Chinese cities. The Geographically Weighted Regression (GWR) technique is adopted to explore the spatial heterogeneity of their relationships. Practically, the GWR model has been frequently used in environmental science, public health, and many other cases, including COVID-19 related studies (Mollalo, Vahedi, and Rivera Citation2020).
2. Materials and methods
2.1. Study area and data
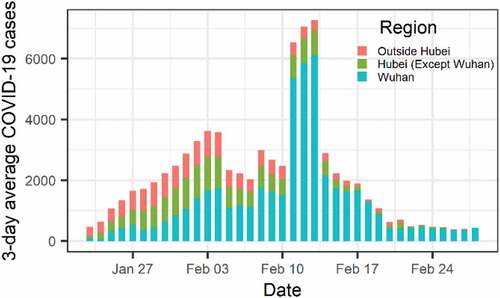
Our study areas are Chinese prefecture-level cities, excluding Hong Kong, Macao, and Taiwan (). The time-series confirmed COVID-19 cases of each prefecture-level city were download from China Data Lab at Harvard University (https://projects.iq.harvard.edu/chinadatalab/resources-covid-19), which were rearranged according to the daily reports from local Health Commissions of Chinese cities. The COVID-19 epidemic widely spread in China from early January, 2020, and it was nearly controlled by the end of February, 2020, excluding the Wuhan city (). As of 29 February 2020, there were 79,968 accumulative confirmed COVID-19 cases in China, among which 66,907 (83.7%) cases were in Hubei Province, and 48,557 (60.7%) cases were in Wuhan city ().
Figure 1. Spatial distributions of accumulative confirmed COVID-19 cases in China mainland on February 29th, 2020, and population outflows from Wuhan aggregated from January 1th to January 24th, 2020.
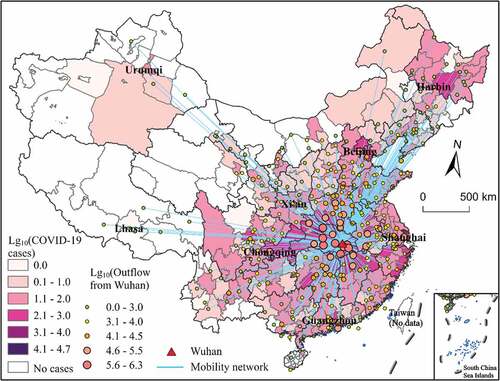
Figure 2. Temporal variations of 3-day averaged newly added COVID-19 cases in Wuhan, Hubei Province (excluding Wuhan), and outside Hubei in China mainland.
The population outflows from Wuhan to other Chinese cities comes from Jia et al. (Citation2020). They used mobile phone data to count and estimate migrations from Wuhan to other prefecture-level cities in the mainland China during the period from January 1st to January 24th, 2020. Any mobile phone user who had spent at least 2 hours in Wuhan and then moved from Wuhan during that period would be counted. In total, there were more than 11 million counts of movements living from Wuhan during that period. About 8.7 million movements happened within the Hubei Province, while there were about 2.8 million inter-provincial movements from Wuhan (Jia et al. Citation2020). The spatial distribution of population outflows from Wuhan to 296 prefecture cities in the mainland China is shown in . The outflow data from Wuhan during January 1–24, 2020 is available at the publisher website (https://www.nature.com/articles/s41586-020-2284-y#MOESM1). Detailed explanations on the outflow data from Wuhan can be found in Jia et al. (Citation2020).
2.2. Geographically weighted regression
Spatial heterogeneity or non-stationarity is a fundamental characteristic of geographical variables (Fotheringham, Crespo, and Yao Citation2015; Goodchild Citation2004), also known as the principle of spatial heterogeneity proposed by Goodchild (Citation2004). Traditionally, an Ordinary Least Squares (OLS) regression model assumes the spatial stationarity in relationships between explanatory variables and the dependent variable. It thus fails to capture the spatial variations of relationships among geographical variables. In this sense, a spatially varying coefficient modeling strategy is preferred in geographical analysis with concerning spatially heterogeneous features (Murakami et al. Citation2019). The Geographically Weighted Regression (GWR) technique has become one of the most important techniques for exploring the spatially varying relationships, and been applied in a wide range of fields (Lu et al. Citation2018). It can be generally expressed as equation (1) (Fotheringham, Brunsdon, and Charlton Citation2002):
where for each prefecture-level city i, yi is the accumulative number of confirmed COVID-19 cases on a certain day (from January 23th to February 29th, 2020), βi0 is the intercept, βij is the jth coefficient, Xij is the value of the jth explanatory variable, m is the number of explanatory variables and εi is a random error term. In this study, there is only one explanatory variable that is the population outflows from Wuhan.
GWR makes location-wise calibration with concerning a “bump of influence”: around each calibration location, nearer observations have more influence in estimating the localized set of coefficients than those farther away (Fotheringham, Charlton, and Brunsdon Citation1998). In details, GWR estimates each set of regression coefficients at each prefecture-level city i by the weighted least squares approach, and its matrix expression could be expressed as follows
where is the vector of m + 1 parameter estimates at prefecture-level city i, W(i) is the diagonal matrix denoting the geographical weighting of the observations for prefecture-level city i, X is the matrix of the explanatory variables with the first column of 1s for the intercept, y is the sample vector of the dependent variable, i.e. accumulative COVID-19 cases.
The weighting matrix (W(i)) is calculated with a specific kernel function and bandwidth optimized via the cross-validation (CV) score (Bowman Citation1984; Cleveland Citation1979) or the corrected Akaike Information Criterion (AICc) (Fotheringham, Brunsdon, and Charlton Citation2002). In practice, the Gaussian and Bi-square functions are the most used, and the former one is adopted in this study. Moreover, the bandwidth can be specified either by a fixed distance (known as fixed weighting scheme) or by a fixed number of nearest neighbors (known as adaptive weighting scheme), and the latter one is adopted here (Lu et al. Citation2017). In this study, the GWR model calibrations were carried out via an R package, namely GWmodel (Gollini et al. Citation2015; Lu et al. Citation2014).
2.3. Urban scaling law
Urban scaling law describes how urban attributes (such as GDP and built-up area) are correlated with the size of urban population in a power law form (Bettencourt Citation2013; Bettencourt et al. Citation2007; Jiao et al. Citation2020; Lei et al. Citation2021a):
where Y(t) is one attribute of a city at time t, like GDP etc., N(t) is the size of urban population of a city at time t, and Y0 and β are parameters. β is the scaling exponent.
We get a linear model (formula (4)) after taking the logarithm of both sides of the formula (3):
Now, the scaling exponent (β) is the slope of the linear regression model, which distinguishes scaling regimes (Lei et al. Citation2021b; Li et al. Citation2021; Xu et al. Citation2019). Social-interaction related attributes, like GDP, innovation, and infectious disease, super-linearly scale with urban population with the β greater than 1 (Ribeiro et al. Citation2020; Lei et al. Citation2021b). In contrast, urban infrastructure-related attributes, like built-up area, are sub-linearly scale with urban population with the β less than 1 (Xu et al. Citation2020).
In this study, we analyze the scaling relationship between population outflows from Wuhan as N(t) and COVID-19 cases in Chinese cities as Y(t). Both population outflows and COVID-19 cases are transformed into logarithmic scales in OLS and GWR models. We adopt the theory of scaling law to interpret coefficients (β) of regression models.
3. Results
3.1. OLS models
We firstly adopted the OLS regression model to investigate the global relationship between COVID-19 cases in each prefecture-level city and population outflows from Wuhan, which are in logarithmic scales. Scatter plots and OLS regression lines on four representative dates are presented in . The adjusted R2 values of these OLS models varies from 0.56 to 0.62, indicating the strong ability of population outflows from Wuhan in exploring COVID-19 cases in each prefecture-level city. The slopes of these OLS regression models vary from 0.44 to 0.57, revealing a sub-linear scaling relationship between population outflows from Wuhan and COVID-19 cases.
Figure 3. Global OLS regression models between population outflows from Wuhan and accumulative confirmed COVID-19 cases of Chinese prefecture-level cities on four specific dates (January 26th, February 5th, February 10th, and February 14th in 2020). Both explanatory variable and dependent variable are in logarithm scales. The cities in Hubei Province are in red color and the rest cities outside Hubei are in cyan color. The symbol sizes scale with the population of each city.
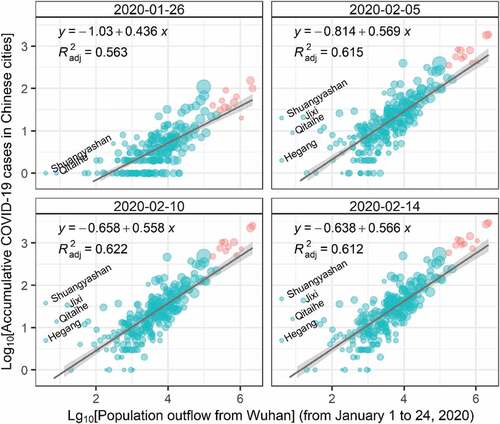
Generally, infectious diseases, like influenza, HIV, etc., super-linearly scale with city size because of the increase return of human interactions with city size (Rocha, Thorson, and Lambiotte Citation2015). Previous studies also revealed that COVID-19 cases super-linearly scale with city size in the United States and Brazil (Ribeiro et al. Citation2020; Stier, Berman, and Bettencourt Citation2021). For the early COVID-19 epidemic in China, population outflows from Wuhan determined the scale of population interaction. According to the theory of scaling law, without intervention, COVID-19 cases in a certain Chinese city was supposed to super-linearly scale with population outflows from Wuhan. However, we found a sub-linear scaling relationship between population outflows from Wuhan and COVID-19 cases in Chinese cities (). The sub-linear scaling relationship means that doubling population outflows from Wuhan results in 44%-57% increases of COVID-19 cases in prefecture-level cities. The sub-linear scaling relationship further demonstrates that the COVID-19 epidemic had been timely controlled in these cities outside Wuhan at the beginning, avoiding server local transmissions.
Although the OLS model generally performs well, there are at least two flaws presented in scatter plots (). On the one hand, several cities are clearly dispersed from the regress line, particularly for cities with small population outflows from Wuhan but relatively larger numbers of COVID-19 cases confirmed, like Shuangyashan, Jixi, Qitaihe, and Hegang. These four small cities are in Heilongjiang Province, the northeast of the mainland China that is more than 2000 km faraway from Wuhan. On the other hand, cities (in red) with huge population outflows from Wuhan are all above the regress line, indicating COVID-19 cases in these cities are generally under-estimated. Note that all the cities in red color are within the Hubei Province.
3.2. GWR models
The GWR technique models the spatial heterogeneity or non-stationarity in data relationships via spatially varying coefficient estimates, which are naturally mappable. In this case, we chose four models as representative dates, i.e. January 26th, February 5th, February 10th, and February 14th in 2020, to visualize their coefficient estimates in . Results show that the coefficient estimates of the explanatory variable, the logarithm of population outflows from Wuhan, vary from 0.05 to 1.16 in different cities. Generally, cities near to Wuhan have larger coefficient estimates (0.76–1.00), suggesting stronger influences of population outflows from Wuhan on COVID-19 cases in these cities. Moreover, cities in the Beijing-Tianjin Region, the Yangtze River Delta (like Shanghai), and the Pearl River Delta (like Guangzhou and Shenzhen) also have high coefficient estimates, although they are geographically far from Wuhan. Note that these cities are highly developed economically, leading to close connections with Wuhan.
Figure 4. Spatial distributions of coefficients in GWR models. The dependent variable is the accumulative confirmed COVID-19 cases in Chinese cities, and the explanatory variable is the total outflows from Wuhan to each city during January 1th – 24th, 2020. Both explanatory variable and dependent variable are in logarithm scales. Cities with non-significant (p > 0.05) coefficients are marked by oblique lines in red.
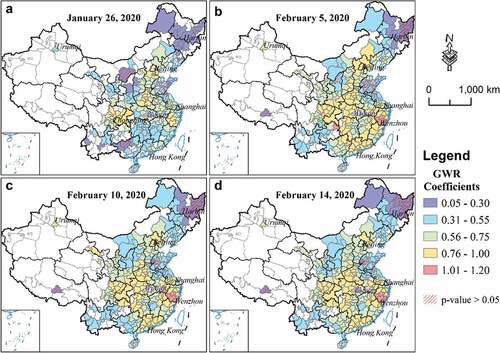
Coefficient estimates from the models in the early days are relatively small ()), but they increase apparently in later dates ())), showing the influence of population outflows from Wuhan is fully manifested. As shown in , the spatial heterogeneities of coefficient estimates become more apparent among prefecture-level cities. Specifically, coefficient estimates around Wenzhou in Zhejiang Province are typically larger than 1, which means population outflows from Wuhan has a super-linear scaling relationship with confirmed COVID-19 cases in this region. Wenzhou experienced the most severe COVID-19 epidemic among cities outside Hubei Province. Apart from relatively large population outflows from Wuhan to Wenzhou, the local transmission accounted for these outliers around Wenzhou according to the theory of scaling law.
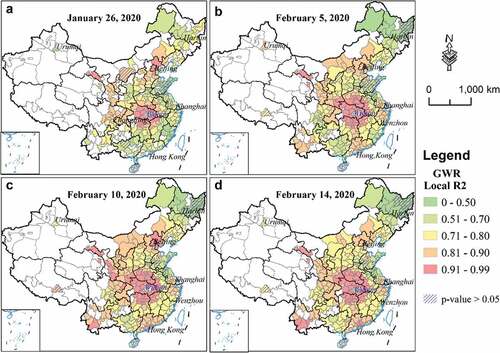
The local R2 values of the four GWR models on January 26th, February 5th, February 10th, and February 14th in 2020 are shown in . The local R2 is extremely high (over 0.9) in cities around Wuhan, showing a circle with a radius of 300–500 km. The local R2 gradually decreases from Wuhan’s neighbors to faraway cities, but with higher R2 in regions that are closely connected with Wuhan, such as the Beijing-Tianjin Region, the Yangtze River Delta Region, the Pearl River Delta Region, and the west region adjacent to Hubei Province. Cities in the northeast of China have lower R2 because of long distance and weak relation with Wuhan. In the early time, local R2 is relatively low ()) and most cities have higher local R2 in the later time ()), indicating the influence of population outflows from Wuhan is potentially more apparent.
Figure 5. Spatial distributions of local R2 in GWR models. The dependent variable is the accumulative confirmed COVID-19 cases in Chinese cities, and the explanatory variable is the total outflows from Wuhan to each city during January 1th – 24th, 2020. Both explanatory variable and dependent variable are in logarithm scales. Cities with non-significant (p > 0.05) coefficients are marked by oblique lines in blue.
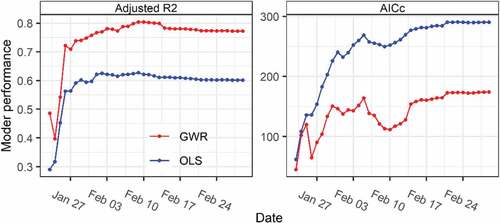
We further model the relationship between population outflows from Wuhan and COVID-19 cases of other Chinese cities on each day from January 23rd to February 29th in 2020 (38 days). The diagnostic information of these OLS and GWR model calibrations, including the adjusted R2 and AICc values are shown in . The adjusted R2 values of the OLS and GWR models present similar varying trends from the beginning to the end of this period. Obviously, the GWR models always perform better than the corresponding OLS models, particularly the adjusted R2 values of the GWR models after the date of 26 January 2020 tend to be stably around 0.8. In contrast, the adjusted R2 values of the corresponding OLS models vary from less than 0.3 to around 0.55 from January 23rd to January 26th, 2020, and then increase up to around 0.6 since January 26th. In this sense, the GWR models generally improve the explanatory ability of population outflows from Wuhan by nearly 20%. The values of the adjusted R2 are relatively small before Jan. 27th because people who were infected had not yet been diagnosed and reported in the early stage of the COVID-19 epidemic. The AICc values of OLS and GWR models also presents a similar varying trend during this period, but observe that the AICc values of GWR models decreases by nearly 50% compared to those of the corresponding OLS models. This further confirms that the local GWR models significantly outperform than the global OLS models in this case.
Figure 6. Adjusted R2 and corrected Akaike information criterion (AICc) values of the OLS and GWR models for accumulative COVID-19 cases. The dependent variable is the logarithm of accumulative confirmed COVID-19 cases in each prefecture-level city on each day from January 23th to February 29th, 2020. The explanatory variable is the logarithm of total population outflows from Wuhan to each prefecture-level city from January 1st to 24th, 2020.
3.3. Newly added COVID-19 cases
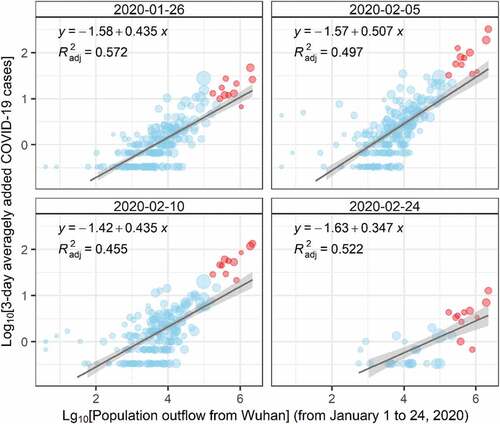
This study further analyzes the relationship between population outflows from Wuhan and 3-day averaged newly added COVID-19 cases, including OLS and GWR models. The scatter plots and OLS regression results of four typical dates are shown in . On January 26th, 2020, the adjusted R2 of the OLS regression is around 0.6; after that, the adjusted R2 of the OLS model drops to only about 0.5. In addition, the regression slope (scaling exponent) between newly added cases and outflows is less than 1, indicating that the increasing return of outflow size is also suppressed. At the same time, the regression slope decreases with time because the number of newly added cases decreased with time.
Figure 7. Global OLS regression models between population outflows from Wuhan and 3-day averagely added COVID-19 cases of Chinese prefecture-level cities on four specific dates (January 26th, February 5th, February 10th, and February 24th in 2020). Both explanatory variable and dependent variable are processed in logarithm scales. The cities in Hubei Province are in red and the rest cities outside Hubei are in light blue. The symbol sizes are scaled with the population of each city.
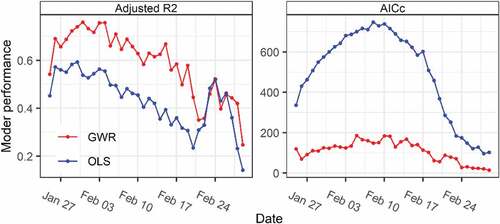
The OLS and GWR model for newly added COVID-19 cases are established on each day from January 25th to February 29th in 2020. The performance of OLS and GWR models represented by the adjusted R2 and AICc is shown in . Overall, the correlation between outflows from Wuhan and newly added COVID-19 cases in other Chinese cities gradually decreases over time (the adjusted R2 gradually decreases). The newly added COVID-19 cases in other Chinese cities are highly correlated with outflows from Wuhan at the early state of this epidemic. In the later period, the newly added cases in other cities were related to the local transmission. Therefore, the explanatory power of outflows from Wuhan has declined over time. In addition, only cities of Hubei Province reported newly added cases in late February, 2020 (). On the other hand, the performance of GWR models is significantly better than OLS models, with higher adjusted R2 and lower AICc of GWR models. In particular, the AICc of the GWR model is below 200 all the time, indicating that the GWR model is more robust.
Figure 8. Adjusted R2 and corrected Akaike information criterion (AICc) values of the OLS and GWR models for newly added COVID-19 cases. The dependent variable is the logarithm of 3-day averagely increased COVID-19 cases in each prefecture-level city on each day from January 25th to February 29th, 2020. The explanatory variable is the logarithm of total population outflows from Wuhan to each prefecture-level city from January 1st to 24th, 2020.
4. Discussion
The COVID-19 has been speedily spread outside Wuhan due to large-scale population movements near the Chinese New Year of 2020. Because of fast responses across the whole country including social distancing, patient isolation, fast testing and so on, the COVID-19 epidemic was quickly controlled outside Hubei Province without evident local community transmission. Thus, the number of confirmed COVID-19 cases could be largely determined by the population outflows from Wuhan. In an influential previous study, they concluded that population outflows from Wuhan had shown dominant effects on the spatio-temporal transmissions of COVID-19 in China (Jia et al. Citation2020).
This study contributes to revealing the spatial disparities of influences of population outflows from Wuhan on COVID-19 cases in Chinese cities. Overall, the global OLS regression model with the population outflows from Wuhan as the only explanatory variable can explain about 60% variance of the dependent variable (COVID-19 cases in Chinese cities), while the GWR model can explain nearly 80% variance of COVID-19 cases in Chinese cities, increasing the adjusted R2 values by 20% in comparison to OLS models (). Coefficients of GWR models show obvious spatial heterogeneity and spatial clusters. Besides cities around Wuhan, faraway cities having close relations with Wuhan also experienced higher coefficients, verifying stronger influences by population outflows from Wuhan there. Another novelty of this study is the perspective from the scaling law (Jiang and de Rijke Citation2021). The sub-linear (slope less than one) scaling relationship between outflows from Wuhan and COVID-19 cases in other Chinese cities proves that there was limited local transmission of this epidemic because of effective preventions.
Although population outflows from Wuhan principally determine numbers of COVID-19 cases in Chinese prefecture-level cities, there are 20% – 40% variances correlated to some other factors. Firstly, there are differences in the implementation of public health restriction and prevention policies in different cities, including time for action and efficiency, which ultimately leads to variances in the intensity of local interactions. Secondly, the outflows from Wuhan might have heterogeneous probabilities in causing the transmission of COVID-19 due to their diverse professions and areas of living and working within Wuhan. For instance, coefficient estimates in GWR models are the highest around Wenzhou, Zhejiang (). This is probably because the people returning to Wenzhou are mainly engaged in business activities in Wuhan. Businessmen have a wide range of activities and frequent meetings with customers. Therefore, this group is highly risky in contacting COVID-19 infected people in Wuhan. Thirdly, confirmed COVID-19 cases are related to local characteristics, such as population density, environmental and climate factors like temperature, humidity, etc. (Qi et al. Citation2020; Ghosh et al. Citation2020; Sethi and Mittal Citation2020; Liu Citation2020; Cordes and Castro Citation2020; Huang, Yang, and Yang Citation2021).
This study also has limitations. In this study, the population outflows from Wuhan obtained are the cumulative outflows from January 1st to January 24th, 2020. But note that outflows on different dates could have varying probabilities of carrying the virus. People moving out of Wuhan on the later date before the lockdown of Wuhan (January 23th) are likely to carry the virus and cause potential transmissions at a higher risk. On the other land, not all the travelers who moved out of Wuhan stayed at the first destination. A considerable number of people continued to move to the second or even more destinations. This situation should be more pronounced especially in Hubei Province. For cities within Hubei Province, there were more people with a history of living and traveling in Wuhan than those who directly moved from Wuhan to the city. Therefore, almost all cities within Hubei Province are above the OLS regression lines (). Further studies can be to build secondary or multiple transmission networks of virus in Hubei Province for addressing this issue.
5. Conclusions
The COVID-19 epidemic widely and quickly spread across China because of mass migration before the 2020 Chinese New Year. Population outflows from Wuhan largely determined COVID-19 cases in Chinese cities. The decisive effect of population outflows from Wuhan on COVID-19 cases in other Chinese cities directly confirms that strict public health preventions are effective to prevent the COVID-19 epidemic. The secondary spread of the COVID-19 epidemic is limited in China and local community transmissions have been largely avoided, as well.
In this study, the GWR technique is applied for exploring the spatially varying relationships between population outflows from Wuhan and COVID-19 cases in Chinese cities. The adjusted R2 values are improved from around 0.6 of OLS models to nearly 0.8 of GWR models. GWR models typically captured local variations of their relationships. Cities not only near to Wuhan but also with close connections with Wuhan are more vulnerable to the COVID-19 epidemic. Local techniques, like GWR, provide detailed suggestions for policymakers to take local situations adapted strategies instead of global ones.
Data availability statement
The time-series data of confirmed COVID-19 cases of each prefecture-level city is publicly available from China Data Lab at Harvard University (https://projects.iq.harvard.edu/chinadatalab/resources-covid-19). The outflow data from Wuhan during January 1-24, 2020 is publicly available at the website (https://www.nature.com/articles/s41586-020-2284-y#MOESM1).
Disclosure statement
No potential conflict of interest was reported by the author(s).
Additional information
Funding
Notes on contributors
Gang Xu
Gang Xu is an Associate Researcher at Wuhan University. His research interests include urban land use change, complex urban system and the application of GIS in public health.
Wenwu Wang
Wenwu Wang is an undergraduate student at the School of Remote Sensing and Information Engineering, Wuhan University. He recently focuses on the spatio-temporal modeling of the COVID-19 epidemic.
Dandan Lu
Dandan Lu is a Senior Engineer at Wuhan Geomatics Institute. She holds the Bachelor’s degree in Land Resource Management and the Master’s degree in Cartography and GIS. She recently focuses on the application of geo-technologies in urban management.
Binbin Lu
Binbin Lu is currently an associate professor at Wuhan University. His research interests include geocomputation, spatial statistics, geographically weighted (GW) modeling, open-source GIS, R coding and spatio-temporal big data analysis. He is the main developer and maintainer of an R package, namely GWmodel. It incorporates a number of GW techniques, including GW regression, GW summary statistics and GW principle component analysis.
Kun Qin
Kun Qin is a full Professor at Wuhan University. His research interests include geographical analysis, GIS modeling, and geo-computation for social sciences. He recently focuses on geographical networks analysis and modeling.
Limin Jiao
Limin Jiao is a full Professor at Wuhan University. His research interests include geographical analysis, urban land use change and environmental consequences, and complex urban system.
References
- Altan, Orhan, and Ian Dowman. 2021. ““The Changing World under the Corona Virus Threat-from Human Needs to SDGs and What Next?”.” Geo-spatial Information Science 24 (1): 50–57. doi:10.1080/10095020.2021.1886874.
- Balcan, Duygu, Vittoria Colizza, Bruno Gonçalves, Hu Hao, José J Ramasco, and Alessandro Vespignani. 2009. “Multiscale Mobility Networks and the Spatial Spreading of Infectious Diseases.” Proceedings of the National Academy of Sciences 106 (51): 21484–21489. doi:10.1073/pnas.0906910106.
- Bettencourt, L. M., J. Lobo, D. Helbing, C. Kuhnert, and G. B. West. 2007. “Growth, Innovation, Scaling, and the Pace of Life in Cities.” Proceedings of the National Academy of Sciences 104 (17): 7301–7306. doi:10.1073/pnas.0610172104.
- Bettencourt, Luís M. A. 2013. “The Origins of Scaling in Cities.” Science 340 (6139): 1438–1441. doi:10.1126/science.1235823.
- Bowman, Adrian W. 1984. “An Alternative Method of Cross-validation for the Smoothing of Density Estimates.” Biometrika 71 (2): 353–360. doi:10.1093/biomet/71.2.353.
- Castro, Marcia C, Sun Kim, Lorena Barberia, Ana Freitas Ribeiro, Susie Gurzenda, Karina Braga Ribeiro, Erin Abbott, Jeffrey Blossom, Beatriz Rache, and Burton H Singer. 2021. “Spatiotemporal Pattern of COVID-19 Spread in Brazil.” Science 372 (6544): 821–826. doi:10.1126/science.abh1558.
- Chen, Y., M. Chen, B. Huang, C. Wu, and W. Shi. 2021. “Modeling the Spatiotemporal Association between COVID-19 Transmission and Population Mobility Using Geographically and Temporally Weighted Regression.” Geohealth 5 (5): e2021GH000402. doi:10.1029/2021GH000402.
- Chinazzi, Matteo, Jessica T. Davis, Marco Ajelli, Corrado Gioannini, Maria Litvinova, Stefano Merler, Ana Pastore Y Piontti, et al. 2020. “The Effect of Travel Restrictions on the Spread of the 2019 Novel Coronavirus (COVID-19) Outbreak.” Science 368 (6489): 395. doi:10.1126/science.aba9757.
- Cleveland, William S. 1979. “Robust Locally Weighted Regression and Smoothing Scatterplots.” Journal of the American Statistical Association 74 (368): 829–836. doi:10.1080/01621459.1979.10481038.
- Cordes, Jack, and Marcia C Castro. 2020. “Spatial Analysis of COVID-19 Clusters and Contextual Factors in New York City.” Spatial and Spatio-temporal Epidemiology 34: 100355. doi:10.1016/j.sste.2020.100355.
- Fotheringham, A Stewart, Chris Brunsdon, and Martin Charlton. 2002. Geographically Weighted Regression: analysis of spatially varying relationships. New Jersey: John Wiley & Sons.
- Fotheringham, A. S., R. Crespo, and J. Yao. 2015. “Geographical and Temporal Weighted Regression (GTWR).” Geographical Analysis 47 (4): 431–452. doi:10.1111/gean.12071.
- Fotheringham, Stewart, Martin E Charlton, and Chris Brunsdon. 1998. “Geographically Weighted Regression: A Natural Evolution of the Expansion Method for Spatial Data Analysis.” Environment and Planning A 30 (11): 1905–1927. doi:10.1068/a301905.
- Ghosh, Aritra, Srijita Nundy, Sumedha Ghosh, and Tapas K. Mallick. 2020. “Study of COVID-19 Pandemic in London (UK) from Urban Context.” Cities 106: 102928. doi:10.1016/j.cities.2020.102928.
- Gollini, Isabella, Lu Binbin, Martin Charlton, Christopher Brunsdon, and Paul Harris. 2015. “GWmodel: An R Package for Exploring Spatial Heterogeneity Using Geographically Weighted Models.” Journal of Statistical Software 63 (17): 1–50. doi:10.18637/jss.v063.i17.
- Goodchild, Michael F. 2004. “The Validity and Usefulness of Laws in Geographic Information Science and Geography.” Annals of the Association of American Geographers 94 (2): 300–303. doi:10.1111/j.1467-8306.2004.09402008.x.
- Huang, Bo, and Jionghua Wang. 2020. “Big Spatial Data for Urban and Environmental Sustainability.” Geo-spatial Information Science 23 (2): 125–140. doi:10.1080/10095020.2020.1754138.
- Huang, Xin, Qiquan Yang, and Junjing Yang. 2021. “Importance of Community Containment Measures in Combating the COVID-19 Epidemic: From the Perspective of Urban Planning.” Geo-spatial Information Science 1–9. doi:10.1080/10095020.2021.1894905.
- Jia, Jayson S., Lu Xin, Yun Yuan, Ge Xu, Jianmin Jia, and Nicholas A. Christakis. 2020. “Population Flow Drives Spatio-temporal Distribution of COVID-19 in China.” Nature 582 (7812): 389–394. doi:10.1038/s41586-020-2284-y.
- Jiang, Bin, and Chris de Rijke. 2021. “A Power-law-based Approach to Mapping COVID-19 Cases in the United States.” Geo-spatial Information Science 1–7. doi:10.1080/10095020.2020.1871306.
- Jiao, Limin, Xu Zhibang, Xu Gang, Rui Zhao, Jiafeng Liu, and Weilin Wang. 2020. “Assessment of Urban Land Use Efficiency in China: A Perspective of Scaling Law.” Habitat International 99: 102172. doi:10.1016/j.habitatint.2020.102172.
- Kraemer, Moritz U. G., Chia-Hung Yang, Bernardo Gutierrez, Wu Chieh-Hsi, Brennan Klein, David M. Pigott, Louis Du Plessis, et al. 2020. “The Effect of Human Mobility and Control Measures on the COVID-19 Epidemic in China.” Science 368 (6490): 493. doi:10.1126/science.abb4218.
- Lau, Hien, Veria Khosrawipour, Piotr Kocbach, Agata Mikolajczyk, Hirohito Ichii, Maciej Zacharski, Jacek Bania, and Tanja Khosrawipour. 2020. “The Association between International and Domestic Air Traffic and the Coronavirus (COVID-19) Outbreak.” Journal of Microbiology, Immunology and Infection 53 (3): 467–472. doi:10.1016/j.jmii.2020.03.026.
- Lei, Weiqian, Limin Jiao, Xu Gang, and Zhengzi Zhou. 2021a. “Urban Scaling in Rapidly Urbanising China.” Urban Studies 00420980211017817. doi:10.1177/00420980211017817.
- Lei, Weiqian, Limin Jiao, Xu Zhibang, Zhengzi Zhou, and Xu. Gang. 2021b. “Scaling of Urban Economic Outputs: Insights Both from Urban Population Size and Population Mobility.” Computers, Environment and Urban Systems 88: 101657. doi:10.1016/j.compenvurbsys.2021.101657.
- Li, Ruiqi, Lu Llingyun, Tianyu Cui, Gu Weiwei, Ma Shaodong, Xu Gang, and H. Eugene Stanley. 2021. “Assessing the Attraction of Cities on Venture Capital from a Scaling Law Perspective.” IEEE Access 9: 48052–48063. doi:10.1109/ACCESS.2021.3068317.
- Liu, Lu. 2020. “Emerging Study on the Transmission of the Novel Coronavirus (COVID-19) from Urban Perspective: Evidence from China.” Cities 103: 102759. doi:10.1016/j.cities.2020.102759.
- Lu, Binbin, Chris Brunsdon, Martin Charlton, and Paul Harris. 2017. “Geographically Weighted Regression with Parameter-specific Distance Metrics.” International Journal of Geographical Information Science 31 (5): 982–998. doi:10.1080/13658816.2016.1263731.
- Lu, Binbin, Paul Harris, Martin Charlton, and Chris Brunsdon. 2014. “The GWmodel R Package: Further Topics for Exploring Spatial Heterogeneity Using Geographically Weighted Models.” Geo-spatial Information Science 17 (2): 85–101. doi:10.1080/10095020.2014.917453.
- Lu, Binbin, Wenbai Yang, Ge Yong, and Paul Harris. 2018. “Improvements to the Calibration of a Geographically Weighted Regression with Parameter-specific Distance Metrics and Bandwidths.” Computers, Environment and Urban Systems 71: 41–57. doi:10.1016/j.compenvurbsys.2018.03.012.
- Mollalo, Abolfazl, Behzad Vahedi, and Kiara M Rivera. 2020. “GIS-based Spatial Modeling of COVID-19 Incidence Rate in the Continental United States.” Science of the Total Environment 728: 138884. doi:10.1016/j.scitotenv.2020.138884.
- Mu, Xiaoyan, Anthony Gar-On Yeh, and Xiaohu Zhang. 2020. “The Interplay of Spatial Spread of COVID-19 and Human Mobility in the Urban System of China during the Chinese New Year.” Environment and Planning B: Urban Analytics and City Science 2399808320954211.
- Murakami, D., B. B. Lu, P. Harris, C. Brunsdon, M. Charlton, T. Nakaya, and D. A. Griffith. 2019. “The Importance of Scale in Spatially Varying Coefficient Modeling.” Annals of the American Association of Geographers 109 (1): 50–70. doi:10.1080/24694452.2018.1462691.
- Oliver, Nuria, Bruno Lepri, Harald Sterly, Renaud Lambiotte, Sébastien Deletaille, Marco De Nadai, Emmanuel Letouzé, Albert Ali Salah, Richard Benjamins, and Ciro Cattuto. 2020. “Mobile Phone Data for Informing Public Health Actions across the COVID-19 Pandemic Life Cycle.” Science Advances 6 (eabc0764): 1–6. doi:10.1126/sciadv.abc0764.
- Qi, H., S. Xiao, R. Shi, M. P. Ward, Y. Chen, W. Tu, Q. Su, W. Wang, X. Wang, and Z. Zhang. 2020. “COVID-19 Transmission in Mainland China Is Associated with Temperature and Humidity: A Time-series Analysis.” Sci Total Environ 728: 138778. doi:10.1016/j.scitotenv.2020.138778.
- Ribeiro, H. V., A. S. Sunahara, J. Sutton, M. Perc, and Q. S. Hanley. 2020. “City Size and the Spreading of COVID-19 in Brazil.” PLoS One 15 (9): e0239699. doi:10.1371/journal.pone.0239699.
- Rocha, Luis EC, Anna E Thorson, and Renaud Lambiotte. 2015. “The Non-linear Health Consequences of Living in Larger Cities.” Journal of Urban Health 92 (5): 785–799. doi:10.1007/s11524-015-9976-x.
- Sethi, Mahendra, and Shilpi Mittal. 2020. “Improvised Rental Housing to Make Cities COVID Safe in India.” Cities 106: 102922. doi:10.1016/j.cities.2020.102922.
- Stier, Andrew J., Marc G. Berman, and Luís M. A. Bettencourt. 2021. “Early Pandemic COVID-19 Case Growth Rates Increase with City Size.” Npj Urban Sustainability 1 (1). doi:10.1038/s42949-021-00030-0.
- Thomas, L. J., P. Huang, F. Yin, X. I. Luo, Z. W. Almquist, J. R. Hipp, and C. T. Butts. 2020. “Spatial Heterogeneity Can Lead to Substantial Local Variations in COVID-19 Timing and Severity.” Proceedings of the National Academy of Sciences of the United States of America 117 (39): 24180–24187. doi:10.1073/pnas.2011656117.
- Tian, Huaiyu, Yonghong Liu, Li Yidan, Wu Chieh-Hsi, Moritz U. Bin Chen, G. Kraemer, Li Bingying, et al. 2020. “An Investigation of Transmission Control Measures during the First 50 Days of the COVID-19 Epidemic in China.” Science 368 (6491): 638–642. doi:10.1126/science.abb6105.
- Wei, Ye, Jiaoe Wang, Wei Song, Chunliang Xiu, Ma Li, and Tao Pei. 2021. “Spread of COVID-19 in China: Analysis from a City-based Epidemic and Mobility Model.” Cities 110: 103010. doi:10.1016/j.cities.2020.103010.
- Wesolowski, Amy, Nathan Eagle, Andrew J Tatem, David L Smith, Abdisalan M Noor, Robert W Snow, and Caroline O Buckee. 2012. “Quantifying the Impact of Human Mobility on Malaria.” Science 338 (6104): 267–270. doi:10.1126/science.1223467.
- Xu Gang, Xiu Tianyu, Xi Li, Liang Xinlian, and Limin Jiao. 2021. “Lockdown Induced Night-Time Light Dynamics during the COVID-19 Epidemic in Global Megacities.” International Journal of Applied Earth Observation and Geoinformation 102: 1–10. doi:10.1016/j.jag.2021.102421.
- Xu, Gang, Xu Zhibang, Gu Yanyan, Weiqian Lei, Yupiao Pan, Jie Liu, and Limin Jiao. 2020. “Scaling Laws in Intra-urban Systems and over Time at the District Level in Shanghai, China.” Physica A: Statistical Mechanics and Its Applications 560: 125162. doi:10.1016/j.physa.2020.125162.
- Xu, Gang, Zhengzi Zhou, Limin Jiao, Ting Dong, and Li. Ruiqi. 2019. “Cross-sectional Urban Scaling Fails in Predicting Temporal Growth of Cities.” arXiv 1910.06732.