
 ?Mathematical formulae have been encoded as MathML and are displayed in this HTML version using MathJax in order to improve their display. Uncheck the box to turn MathJax off. This feature requires Javascript. Click on a formula to zoom.
ABSTRACT
Level set method has been extensively used for image segmentation, which is a key technology of water extraction. However, one of the problems of the level-set method is how to find the appropriate initial surface parameters, which will affect the accuracy and speed of level set evolution. Recently, the semantic segmentation based on deep learning has opened the exciting research possibilities. In addition, the Convolutional Neural Network (CNN) has shown a strong feature representation capability. Therefore, in this paper, the CNN method is used to obtain the initial SAR image segmentation map to provide deep a priori information for the zero-level set curve, which only needs to describe the general outline of the water body, rather than the accurate edges. Compared with the traditional circular and rectangular zero-level set initialization method, this method can converge to the edge of the water body faster and more precisely; it will not fall into the local minimum value and be able to obtain accurate segmentation results. The effectiveness of the proposed method is demonstrated by the experimental results of flood disaster monitoring in South China in 2020.
1. Introduction
Flooding is a recurrent and dramatic natural disaster that affects several areas in the world, both in tropical and temperate regions, which not only causes great damage to lives, property, industrial settlements, infrastructures, artistic and historical sites, but also dramatically affects local ecosystems (Annarita et al. Citation2016). As one of the most effective means for monitoring flood disasters, remote sensing can obtain large-scale and high-precision surface information. Synthetic-Aperture Radar (SAR) sensors are particularly useful for producing flood maps, owing to their all-weather and day-night operation capability (Biswajeet, Mahyat, and Mustafa Citation2016; Li et al. Citation2018; Donato et al. Citation2018). In particular, the new generation of SAR sensors, such as RadarSat-2, TerraSAR-X and China’s Gaofen-3 (GF-3) satellite sensor, provides many daily acquired radar images characterized with high spatial resolution, which is more powerful for the flood detection problems.
Image segmentation is very important in flood detection, in which it is difficult to acquire accurate edges of the segmentation region due to speckle noise in SAR images. Many algorithms targeting at image segmentation have been developed, including the simple ones using thresholding (Lee et al. Citation2001; Shi et al. Citation2013; Ma et al. Citation2018), and the sophisticated ones using deep learning. (Long, Shelhamer, and Darrell Citation2015). Recently, a popular method for solving image segmentation has been the level set method (Ayed et al. Citation2004; Ayed et al. Citation2005; Huang, Li, and Huang Citation2005; Lee and Seo Citation2006; Shuai, Hong, and Ge Citation2008; Silveira and Heleno Citation2009; Zhang et al. Citation2016; Meng et al. Citation2018; Chakravarty and Pradhan Citation2020). Merits of the method include the robustness to locate the boundary of an object and the ability to handle topological changes in the curves during their evolution. The most common model in the level set method is the Chan-Vese model (Chan and Vese Citation2001), which is based on the curve evolution techniques employing the Mumford-Shah functional (Mumford and Shah Citation1989) for segmentation and level sets. The Chan-Vese model can detect objects whose boundaries are not necessarily defined by a gradient and can be adapted more easily to topological changes. One of the problems that the level set method is facing is the determination of the right initial surface parameter, which implicitly affects the curve evolution and ultimately the segmentation result.
With the development of artificial intelligence, semantic segmentation based on deep learning has opened up exciting research possibilities (Badrinarayanan, Kendall, and Cipolla Citation2017; Yu and Koltun Citation2016; Chen et al. Citation2014, Citation2017; Lauko et al. Citation2020; Yy et al. Citation2021; Zhong et al. Citation2021). Before deep learning, text, and random forest-based classification are the most common methods for semantic segmentation. After the rise of deep learning methods, convolutional neural networks have achieved not only great success in image classification tasks, but also have greatly improved semantic image segmentation tasks. However, the application of convolutional neural networks in semantic segmentation also brings some problems, of which the main problem is pooling layers. The pooling layer increases the field of vision, but also loses accurate location information, which contradicts the accurate pixel location information required by semantic segmentation. There are two types of solutions to this problem, one of which is the encoder-decoder network structure. The encoder uses a pooling layer to reduce the spatial dimension, and the decoder gradually restores the details and spatial dimension of the target object. Usually, the rapid connection from the encoder to the decoder helps the decoder recover object details better. U-net is the representative of this kind of method (Zhou et al. Citation2020). The other method is to cancel the pooling layer and use dilated convolution.
In this paper, a new model called the U-Net level set method is introduced. Our main idea is to use the trained CNN model prediction results as a priori of the level set method. The prediction result is to initialize the zero-level set, which only needs to describe the general outline of the water body, rather than the accurate edges. Compared with the traditional circular and rectangular zero level set initialization method, the U-Net level set method can converge to the edge of the water body faster and more precisely. It does not fall into the local minimum value, and can obtain accurate segmentation results.
2. Flood detection using the attention U-Net and multiscale level set method
The general framework of this paper is as follows (): (1) The SAR image is decomposed to obtain different scale image data. (2) Image segmentation based on attention U-Net (Berman, Triki, and Blaschko Citation2018) is performed on the coarsest scale. (3) Upsampling the initial segmentation results. (4) The initial segmentation results, such as the initial zero level set, are optimized by the level set method to obtain the accurate segmentation results. (5) Removing shadow by integrating the DEM.
Figure 1. The overall technology roadmap.
2.1. Initial SAR image segmentation using attention U-Net
Convolutional Neural Network (CNN) has a strong feature representation ability. When annotated datasets are provided for the CNN model, it can learn the potential feature distribution instead of manually setting feature rules. Therefore, in this paper, the CNN method is used to obtain the initial SAR image segmentation map to provide deep a priori information for level set segmentation. Considering that SAR images do not have rich semantic features, an excellent medical image segmentation network is adopted for our task, namely the attention U-Net, which combines high-level semantic information with low-level features to learn potential features and obtain high-quality segmentation results. Additionally, attention U-Net combines self-attention mechanisms, which makes the network focus on the significant information of the SAR image, that is, to mine the potential category information of the complex image background. First, we introduce the present structure of a deep convolutional neural network.
2.1.1. Network structure
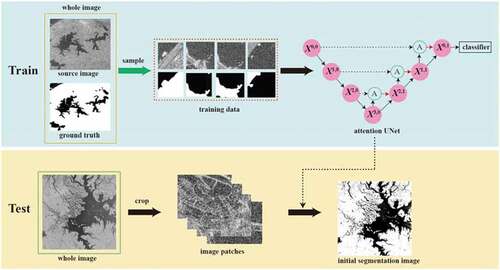
The SAR image segmentation framework of the deep convolutional neural network presented in this paper is shown in . The whole structure is divided into a training module and a test module. For the training module, the attention U-Net is used as the initial segmentation method, which consists of encoding layers and decoding layers. The remaining part of the network shows the encoding layers that learn feature representation. Every Xi,j node in the graph represents a convolution operation, and follows a ReLU activation function, which is composed of convolutional layers with a kernel of 3 × 3, a stride of 1, and zero-padding of 1, aiming to keep the input and output images of the same size. The downward arrows indicate a 2 × 2 max-pooling layer, the number of first convolutional channels is 32, and the number of convolutional layer channels doubles after each down sampling. The right part of the network shows the decoding layers that reconstruct feature maps. The upward arrows indicate up sampling, which uses the up-sampling layer in each step to obtain a high-resolution feature map. The “A” node represents attention gates, which receive the same-level feature map and the up-sampled feature map of the upper layer as inputs to highlight salient features and disambiguate irrelevant and noisy responses. The dot arrows indicate the concatenation connections, which merge the attention feature map and the corresponding upper feature map. Finally, a sigmoid activation function is used as the classifier to obtain segmentation confidence maps. For the detailed network structure parameters, please refer to (Oktay et al. Citation2018). During model training, the patch-based segmentation stage takes the whole images and the ground truth image annotation as input. For the test stage, image blocks are provided to a well-trained model and high confidence probability maps are obtained, and the pixel value is set to 1 for values greater than 0.5 and 0 for values less than 0.5. Finally, all binary segmentation image blocks are spliced together to obtain a complete initial segmentation image.
Figure 2. Initial SAR image segmentation framework of a deep convolutional neural network.
2.1.2. Loss function
To achieve a better image SAR segmentation task, the Dice similarity coefficient (Dice) is chosen as the loss function, which can directly optimize the evaluation index and achieve a better segmentation map. Dice is usually used to calculate the similarity between predicted segmentation images and the ground truth. Its value range is [0,1], where a higher value of Dice will result in a better performance. The mathematical definition is as follows:
where p is the network predicted value, y is the ground truth, c is the class, and is the Dice of the ground truth and the predicted images. Therefore, to optimize the segmentation results, the loss function is minimized, which can be defined as
For our binary classification segmentation task, the ground truth segmentation map has only two values 0,1, so can effectively remove all the pixels in the predicted segmentation map that are not activated in the ground truth segmentation map. For the activated pixels, the low confidence prediction is penalized, while a higher value is obtained for the better Dice coefficient. Therefore, Dice loss can effectively obtain better segmentation results.
2.1.3. Data preprocessing
To verify the effectiveness of our method, a pair of 3352 × 3052 SAR images and the corresponding ground truth are used as the original dataset in the training process. To enrich the experimental dataset, the whole slide is divided into 128 × 128 blocks as the training set with an overlapping stride of 32, which consists of a total of 1120 image block pairs. The ground truth is manually marked by geological experts, and the black and white parts of the ground truth represent river and land, respectively. Among them, the different pixel values represent different categories, and pixel values of 0 and 1 are specified for rivers and land. In the test phase, three images are chosen as the test images and uniformly divide the image into 128 × 128 images.
2.1.4. Implementation details
In this paper, many image patches are used to train our network. During the training stage, all input images are normalized by dividing by 255, and the batch size is 32. The Adam solver is applied with an initial learning rate of 0.001 and momentum parameters β1 = 0.500, β2 = 0.999. The learning rate will be reduced by 10 times until the training loss does not descend for 5 consecutive epochs, and the minimum learning rate is 10–8. Our framework is trained for approximately 135 epochs. In the test stage, the whole image is divided into 128 × 128 image blocks to input them into the trained model for testing and then obtain the preliminary segmentation image blocks, which are spliced according to the order of the previous division to obtain a complete initial segmentation image. Our framework is implemented in PyTorch (Paszke et al. Citation2017). All experiments are conducted under an Intel Xeon(R) CPU E5-2680 v4 @ 2.40 GHz, 256 GB of RAM, and an NVIDIA 1080Ti GPU with 11 GB of memory.
2.2. Accurate water extraction by multiscale level set optimization
2.2.1. SAR image water extraction by an adaptive level set method
To remove the influence of speckle and preserve important structural information, a multiscale level set algorithm is used. Multiscale images are acquired at several scales by decomposing the SAR image using a four-point average down-sampling scheme (see Section 2.2.2). Because the gamma model can well represent the distribution of SAR images if the speckle is fully developed, spatially uncorrelated and the radar reflectivity of the region is constant, it is employed to define the energy functional of the level set function of the original SAR image. Even if there is a correlation between neighboring pixels and the radar reflectivity feature texture, the gamma distribution can still be used as an approximation by adjusting the number of looks .
Chan and Vese (Citation2001) proposed a model that implemented the Mumford-Shah functional via the level set function for bimodal segmentation. Segmentation is performed using an active contour model without boundaries. Let be a bounded open subset of
, with
being its boundary. Let
be a given image and
be a curve in image domain
. Segmentation is achieved via the evolution of the curve
, which is the basic idea of the active contour model. In the level set method,
is represented by the zero-level set of a Lipschitz function
, the unknown variable
is replaced with the unknown variable
.
In this paper, it is assumed that the image is partitioned into two classes and
, which are separated by a curve
, and that classes
and
are modeled using the probability density functions (pdfs)
and
, respectively.
The partition is obtained by minimizing the following energy function:
The base of the log function is 2, which is the same as below.
A gamma model is used for high-resolution SAR image segmentation. Assuming that is a SAR image, the image in each region
is modeled by a gamma distribution of mean intensity
and number of looks
:
The Heaviside function and the one-dimensional Dirac function
are used and defined, respectively, by
Segmentation is performed via the evolution of by minimizing the following energy functional:
where ,
, and
are nonnegative weighted parameters. Function
represents class
for
and
for
.
The evolution of is governed by the following partial differential motion Equation
where is a regularized version of the Dirac function.
Next, the gamma parameters = {
} is estimated using maximum likelihood estimation
. If the samples
in each region are independent and identically distributed, the log likelihood is
. Taking the derivative of
with respect to
and setting them equal to zero,
is obtained, where
is the pixel number in
.
For example, the initial segmentation result of the attention U-Net is , and then we initialize the level set function
as follows:
The main steps of the level sets method are as follows:
Initialize the level set function using EquationEquation (8)
(8)
Evolve the level set function
Determine whether the evolution is stationary. If not, return to step (2).
2.2.2. Model description of the multiscale framework
Multiscale images are acquired at several scales (
) by decomposing the SAR image using a four-point average down sampling scheme (referred to here as the block averaging algorithm), where
,and
correspond to the finest and coarsest image scales, respectively. It is assumed that
and
represent the gray value and classification labels of the SAR image at scale
, respectively. In the present method, the candidate labels are first obtained in scale
, and then progressively refined from scales
to
. The details of the multiscale model can be seen in , taking the scale level into two and three classes as examples.
Figure 3. Description of the multiscale model.
The basic idea here is as follows:
(1) On the coarsest scale , the result of the attention U-set segmentation method is applied to classify the image roughly, and then the original labels of each class can be acquired.
(2) Following that, the level set model in EquationEquations (4)(4)
(4) and (Equation7
(7)
(7) ) can be used to update the labels with a relatively low computational cost, which allows fine-scale labels to be acquired.
(3) As the labels of has already been obtained, then the candidate labels of
can be acquired by average up sampling. Thus, when a coarse scale is given, the distribution of
only depends on
. This assumption is reasonable because
contains relevant information of the previous coarse scale. However, this technology generates error labels at scale
; therefore, the corresponding image
combined with the candidate labels
is applied to update the classification labels at scale
.
(4) After obtaining classification labels in scale , classification labels can be acquired in scale
(
) in the same way as scale
, such that the classification labels can be interactively obtained from the original resolution images, resulting in a considerable reduction in the computational cost. The accuracy is also improved, as the general classification labels can be obtained in the coarser scale images while considering the details in fine-scale images.
2.2.3. Removing shadow by integrating DEM and slope
Based on the water extraction results of the level set, the DEM and slope information are used to distinguish water bodies and shadows. The method of using DEM data and slope information to remove water shadow is as follows.
First, we use the Otsu algorithm to segment the DEM data, then mark areas with higher elevations, and record the coordinates of the marked areas.
Second, slope information derived from DEM are calculated and segmented by the Otsu algorithm. Since the slope value of mountain shadow is larger than that of water body, mark areas with higher elevations, and record the coordinates of the marked areas.
Finally, the marked elevation data area and the marked slope data area are matched with the water extraction result; the successfully matched area is the shadow area, which can be removed.
3. Case study
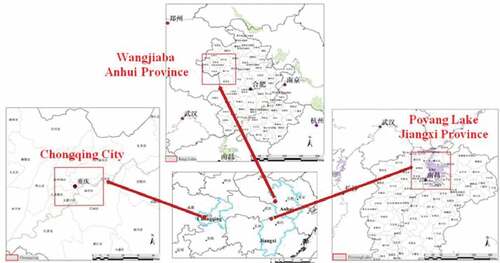
Since the flood season in 2020, heavy rainfall has occurred in South China, resulting in severe flood disasters in many places. Jiangxi Province, Anhui Province, and Chongqing city launched flood prevention level-I responses. Multipoint outbreaks, large local rainfall, and long durations are the main characteristics of flood disasters in 2020 in China. The location of the case study area is shown in .
Figure 4. The location of the case study area.
3.1. Case study 1: Poyang Lake, Jiangxi Province
To verify the effectiveness of the flood detection method in this paper, a case of Poyang Lake flood monitoring in July 2020 was presented. Poyang Lake is located in northern Jiangxi Province and is the largest freshwater lake in China. It is one of the main tributaries of the middle and lower reaches of the Yangtze River and an important seasonal lake with water-carrying capacity, a throughput lake.
Affected by heavy rainfall and water from the middle reaches of the Yangtze River, the water level of Poyang Lake continues to rise, seeming to exceed the historical maximum record. At 2:00 on 6 July 2020, the water level of the Poyang Lake estuary hydrological station rose to a warning level of 19.50 m, reaching the flood number standard. According to the relevant regulations, “Poyang Lake flood No. 1 in 2020” was formed at 10:00 on July 11, and immediately the flood control level-I response has begun.
3.2. Case study 2: Wangjiaba, Anhui Province
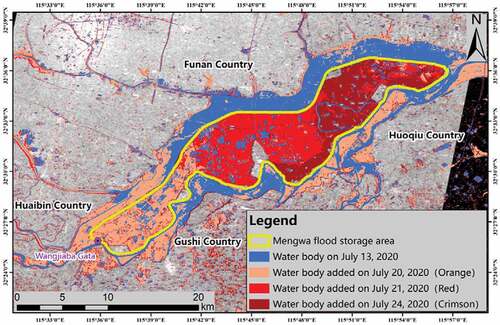
To verify the effectiveness of the flood detection method in this paper, a case study of Wangjiaba flood monitoring in July 2020 is presented. Wangjiaba sluice is located in the Mengwa flood storage area of the Huaihe River, on the left bank of the boundary between the middle and upper reaches of the Huaihe River. The entrance to the Mengwa flood storage project of the Huaihe River in Funan County of Anhui Province. As a “barometer“ for flood control of the Huaihe River and the “wind vane” of the Huaihe River disaster, the Wangjiaba sluice has the title of ”the first gate of the Huaihe River”.
At 15:00 on July 18, the water level of Wangjiaba station, the mainstream of the Huaihe River, rose to 28.00 m. The excess over the warning water level was 0.5 m; moreover, it continued to rise. Meanwhile, Anhui Province upgraded the flood control emergency response to level I. From the night of July 19 to the morning of July 20, more than 2000 people were transferred overnight to ensure the safety of people’s lives and property in the Mengwa flood storage area. At 2:00 on July 20, the water level of the Wangjiaba Dam rose to 29.3 m. At approximately 8:30, the water level of the Wangjiaba sluice reached 29.75 m, which exceeded the warning water level by 0.45 m. According to the order of the national flood control and drought relief headquarters, the Wangjiaba sluice was opened for flood discharge, and the Mengwa flood storage and detention area was put into operation, which is the second time in 13 years. At 13:00 on July 23, the Wangjiaba sluice was closed, and flood diversion to the Mengwa flood storage area was stopped. To date, the separate storage of floods in Mengwa lasted for 76.5 h, with an accumulated flood storage volume of 375 million m3, reducing the flood peak water level of the upper and middle reaches of the Huaihe River by 0.20–0.40 m, which was conducive to flood discharge, reduced the defensive pressure of the mainstream dike, and played a significant role in flood control.
3.3. Case study 3: Chongqing City
Another case of Chongqing City flood monitoring in August 2020 is presented in order to verify the effectiveness of the flood detection method in this paper. Chongqing is the provincial administrative region and the only municipality directly under the central government in central and western China. Affected by the continuous heavy rainfall in the Sichuan Basin, the No. 5 flood in 2020 formed by the Yangtze River merged with the No. 2 flood in 2020 formed by the Jialing River that attacked Chongqing City at 15:00 on 19 August 2020. Chongqing’s major rivers ushered in the largest flood this year, and the whole Chongqing section of the Yangtze River and Jialing River was greatly overwhelmed. At 14:00 on 18 August 2020, Chongqing City upgraded and issued a level-I emergency response for flood prevention and entered the emergency flood control period.
4. Experiment results and analysis
To verify the effectiveness of the proposed method, a flood disaster in 2020 in China was taken as a case, in which three parts are illustrated as follows.
4.1. Experiment on Poyang Lake dataset
To monitor the flood range dynamically, four Sentinel-2 satellite images covering Poyang Lake before flooding and China’s GF-3 satellite image after flooding were used. The resolution of the Sentinel-2 composite image is 10 m, and the image size is 20,976 × 20,976 pixels. The resolution of the GF-3 image is also 10 m, the polarization mode is dual polarization, and an HV polarization image is used for our experiment with an image size of 28,743 × 26,674 pixels. The original Sentinel-2 and China’s GF-3 satellite image data are shown in , respectively.
Figure 5. Poyang Lake optical image of Sentinel-2 before flood.
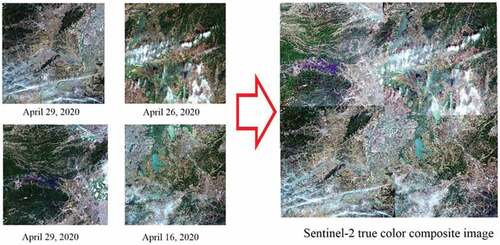
Figure 6. Poyang Lake SAR image of China’s GF-3 satellite after flood.
The near-infrared image of sentinel data is used to extract the water body. shows the water extraction result of the Sentinel-2 image, and and (c) show the water extraction result of the GF-3 image by using U-Net and our method, respectively.
Figure 7. Water extraction results. (a) the water extraction result of Sentinel-2 image. (b) the water extraction result of the GF-3 images using U-Net method. (c) the water extraction result of the GF-3 images using our method.
As shown in , from the perspective of visual interpretation, the U-Net method can also get better results for this SAR image probably because the speckle noise of this SAR image is relatively weak, and the water area accounts for many the whole image area. On this basis, after the optimization of the level set method, the accuracy of water extraction is also improved, which can be mainly reflected by the extraction of small tributaries.
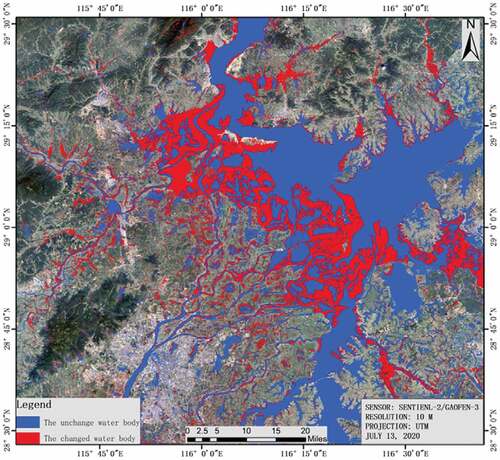
Based on the water extraction results of Sentinel-2 optical images in April 2020 and the water body extraction results of the GF-3 satellite on 13 July 2020, the water change monitoring map was obtained, as shown in . Among them, blue indicates the normal water body range, and red indicates the range of changed water bodies. As shown in , the inundated area of the water area gradually extended outward and upward from the five tributaries of Poyang Lake, the tail end of other small and medium-sized rivers. The relevant dikes faced greater pressure, and the surrounding farmland and towns faced greater risks.
Figure 8. Flood monitoring map of Poyang Lake.
4.2. Experiment on the Wangjiaba dataset
To monitor the flood range dynamically, China’s GF-3 satellite images of 13 July 2020, and 21 and COSMO-SkyMed satellite images of July 24 were used to detect Wangjiaba, and its nearby waters before and after the sluice gate was opened. show the GF-3 satellite images of 13 July 2020 and 21, respectively. shows the COSMO-SkyMed satellite image on July 24. The resolution of the GF-3 images is 10 m, and the polarization mode has dual polarization. HV polarization images are used for our experiment, and the sizes of the GF-3 satellite images on 13 July 2020 and 21 are 40,006 × 36,544 pixels, 32,592 × 30,001 pixels, and 42,545 × 38,094 pixels, respectively. The resolution of the COSMO-SkyMed satellite images is 3 m, whose size is 16,827 × 18,030 pixels.
Figure 9. Experiment datasets of Wangjiaba. (a)-(c) the GF-3 satellite images of 13, 20 and 21 July, respectively. (d) the COSMO-SkyMed satellite image on July 24.
–c) show the water extraction results using U-Net method on 13 July 2020 and 21, respectively. shows the water extraction results using U-Net method on July 24 by a COSMO-SkyMed image.
Figure 10. Wangjiaba water extraction results using U-Net method. (a)-(c) the water extraction results on 13, 20 and 21 July, respectively. (d) the COSMO-SkyMed water extraction result image on July 24.
–c) show the water extraction results using our method on 13, 20, and 21 July, respectively. shows the water extraction result using our method on July 24 by a COSMO-SkyMed image.
Figure 11. Wangjiaba water extraction results using our method. (a)-(c) the water extraction results on 13, 20 and 21 July, respectively. (d) the COSMO-SkyMed water extraction result image on 24 July.
Compared with , the water extraction accuracy of our method is significantly improved compared with U-Net method especially for long and thin water body and SAR images with serious speckle noise.
The Wangjiaba Mengwa flood storage dynamic monitoring result from 13 July to 24 July by using our method is as below. Through the superposition analysis of vector information and administrative planning data, on 13 July, the water area of the Mengwa flood storage area was 19.356 km2, accounting for 10.19% of the total area, as shown in the blue area in . On 20 July, from 8:32 to 18:23, the water area of the Mengwa flood storage area increased to 58.301 km2, accounting for 30.68% of the total area. The newly added water body is shown in the orange area in . As of 17:42 on 21 July, the flooded area increased to 112.452 square kilometers, accounting for 30.68% of the total area 19% of the total area, and the newly added water body is shown in the red area in . As of 09:54 on 24 July, the inundated area increased to 152.584 km2, accounting for 80.31% of the total area. The newly added water body is shown in the dark red area in .
Figure 12. Wangjiaba Mengwa flood storage dynamic monitoring result from July 13 to July 24.
4.3. Experiment on Chongqing City
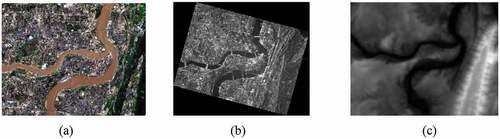
To monitor the flood range dynamically, Sentinel-2 satellite image data on 18 May and SAR image data of China’2 GF-3 image data on 19 August were obtained. The imaging mode of the GF-3 image was the spotlight, and the resolution of the image was 1 meter. Moreover, Chongqing is known as the mountain city because the buildings are built on the mountain (). Overlapping and shadowing are obvious in the SAR image; thus, 2-m resolution DEM data downloaded from Google were also used in our method. In this paper, the flood situation in the central urban area of Chongqing was monitored, focusing on the water coverage of the Chaotianmen wharf and its surrounding areas. The original image data is shown in .
Figure 13. Experiment datasets of Chongqing City. (a) Sentinel-2 satellite image data on 18 May, (b) China’2 GF-3 image data on 19 August, and (c) DEM data with a 2-meter resolution.
As can be seen from ), the segmentation effect of U-Net method is poor for SAR images with severe speckle noise and large terrain fluctuation, resulting in a lot of mis-classification, such as roads, bare soil, and other weak scattering objects. Due to the dynamic evolution ability of the level set method, the initial segmentation results only need a rough outline. With the DEM and slope information, more accurate water extraction results can be achieved, as shown in the .
Figure 14. Water extraction results of Chongqing city: (a) the water extraction result of Sentinel-2 satellite image data on 18 May, (b) the water extraction result of China’2 GF-3 image data on 19 August by using the attention U-Net method, and (c) the water extraction result of China’2 GF-3 image data on 19 August by using the proposed method.
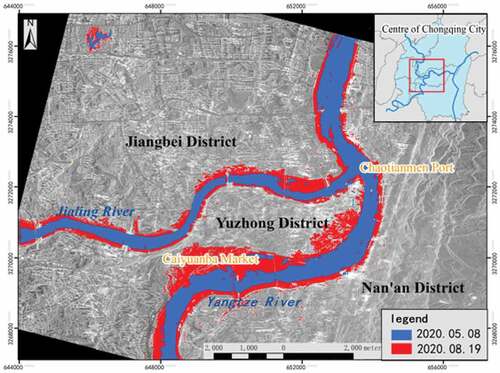
Based on the water extraction results of the Sentinel 2 optical image on May 18 and the water body extraction results of the GF-3 satellite on 19 August, the water change monitoring map was obtained, as shown in . On 18 May 2020, the area of the Yangtze River and Jialing River flowing through the central urban area of Chongqing was approximately 92 km2, accounting for 1.82% of the total area of Chongqing central city. On 19 August 2020, the Yangtze River and Jialing River became wider, with a total area of 169 km2, accounting for 3.35% of the total area of Chongqing central city. In the Chaotianmen wharf and its adjacent areas, it can be observed that the water level of the Yangtze River and Jialing River rose significantly on 19 August compared with 18 May, and coastal buildings such as Chaotianmen wharf and the Caiyuanba market were submerged.
Figure 15. Water change monitoring map of Chongqing City.
5. Conclusions
In this paper, an SAR image flood detection method using attention U-Net and a multiscale-level set method was proposed, in which the CNN method is used to obtain the initial SAR image segmentation map, aiming to provide deep a priori information for level set segmentation. Then, the level set method is used to further optimize the initial segmentation results and finally obtain high-precision water extraction results. Taking the 2020 flood disasters of Jiangxi Province, Anhui Province, and Chongqing as examples, the time-series data of the above areas was analyzed, and a remote sensing dynamic monitoring map was formed. The proposed method shows its accuracy and generalization.
Even though this method works well to some extent, the problem of water extraction in dense building areas and high mountain areas is still an international problem due to the particularity of SAR sensor imaging. In this paper, DEM data is used to remove shadows in the Chongqing Experimental Area, but only a simple binary segmentation method is used for judgment. Next, SAR sensor imaging parameters will be combined, and DEM data will be used to simulate and invert SAR images to obtain more accurate shadow removal results.
Data Availability Statement (DAS)
Some data that support the results and analyses presented in this paper are freely available online. (URLs: https://pan.baidu.com/s/14iSTbXErL44YNG55x3eQtQ Password: slwg). Others cannot be shared at this time, as the data also form part of an ongoing study.
Disclosure statement
No potential conflict of interest was reported by the author(s).
Additional information
Funding
Notes on contributors
Chuan Xu
Chuan Xu is currently an associate professor in Hubei University of Technology. She received her PhD in photogrammetry and remote sensing from Wuhan University. Her research interests include algorithm development and applications for synthetic-aperture radar image segmentation, classification, image registration, and target recognition.
Shanshan Zhang
Shanshan Zhang is currently a senior engineer in GuangZhou Urban Planning & Design Survey Research Institute. She mainly engaged in remote sensing image processing, geographic information system development and application.
Bofei Zhao
Bofei Zhao is a PhD candidate in Wuhan University. His research interests include Polarimetric Synthetic-Aperture Radar (PolSAR) image processing and change detection.
Chang Liu
Chang Liu is a postgraduate student in Hubei University of Technology. He mainly engaged in deep learning of image segmentation and image matching.
Haigang Sui
Haigang Sui is currently a professor of Geo-information at Wuhan University. He received a PhD degree in photogrammetry and remote sensing from Wuhan University in 2002. His major research interests include GIS analysis, change detection of remote sensing, target recognition, and disaster analysis.
Wei Yang
Wei Yang is an associate professor in Wuchang Shouyi University. He received his PhD degree in computer science from Rocket Force Engineering University. His research interests include computer vision, pattern recognition, object detection and tracking.
Liye Mei
Liye Mei is a PhD candidate in Wuhan University. His current research interests include medical image analysis, machine learning and ultrafast imaging.
References
- Annarita, D., R. Alberto, P. Guido, F. P. Lovergine, C. Domenico, and M. Salvatore. 2016. “A Bayesian Network for Flood Detection Combining SAR Imagery and Ancillary Data.” IEEE Transactions on Geoscience and Remote Sensing 54 (6): 3612–3625. doi:10.1109/TGRS.2016.2520487.
- Ayed, I. B., C. Vazquez, A. Mitiche, and Z. Belhadj. 2004. “SAR Image Segmentation with Active Contours and Level Sets.” IEEE International Conference on Image Processing 4: 2717–2720. doi:10.1109/ICIP.2004.1421665.
- Ayed, I. B. S., and A. Mitiche. 2005. “Multiregion Level-Set Partitioning of Synthetic Aperture Radar Images.” IEEE Transactions on Pattern Analysis and Machine Intelligence 27 (5): 793–800. doi:10.1109/TPAMI.2005.106.
- Badrinarayanan, V., A. Kendall, and R. Cipolla. 2017. “SegNet: A Deep Convolutional Encoder-Decoder Architecture for Image Segmentation.” IEEE Transactions on Pattern Analysis and Machine Intelligence 39 (12): 1–14. doi:10.1109/TPAMI.2016.2644615.
- Berman, M., A. R. Triki, and M. B. Blaschko. 2018. “The Lovasz-Softmax Loss: A Tractable Surrogate for the Optimization of the Intersection-Over-Union Measure in Neural Networks.” Paper presented at the 2018 IEEE/CVF Conference on Computer Vision and Pattern Recognition. doi:10.1109/CVPR.2018.00464
- Biswajeet, P., S.T. Mahyat, and N.J. Mustafa. 2016. “A New Semiautomated Detection Mapping of Flood Extent from TerraSAR-X Satellite Image Using Rule-Based Classification and Taguchi Optimization Techniques.” IEEE Transactions on Geoscience and Remote Sensing 54 (7): 4331–4342. doi:10.1109/TGRS.2016.2539957.
- Chakravarty, D., and D. Pradhan. 2020. “A Level Set Approach for Segmentation of Intensity Inhomogeneous Image Based on Region Decomposition.” SN Computer Science 1 (5): 1–12. doi:10.1007/s42979-020-00278-w.
- Chan, T. F., and L. A. Vese. 2001. “Active Contours without Edges.” IEEE Transactions on Image Processing 10 (2): 266–277. doi:10.1109/83.902291.
- Chen, L. C., G. Papandreou, F. Schroff, and H. Adam. 2017. “Rethinking Atrous Convolution for Semantic Image Segmentation.” arXiv Preprint arXiv:1706.05587.
- Chen, L. C., G. Papandreou, I. Kokkinos, K. Murphy, and A. L. Yuille. 2014. “Semantic Image Segmentation with Deep Convolutional Nets and Fully Connected CRFs.” Computer Vision and Pattern Recognition 4: 357–361.
- Donato, A., D.M. Gerardo, I. Antonio, R. Daniele, and R. Giuseppe. 2018. “Unsupervised Rapid Flood Mapping Using Sentinel-1 GRD SAR Images.” IEEE Transactions on Geoscience and Remote Sensing 56 (6): 3290–3299. doi:10.1109/TGRS.2018.2797536.
- Huang, B., H. Li, and X. Huang. 2005. “A Level Set Method for Oil Slick Segmentation in SAR Images.” International Journal of Remote Sensing 26 (6): 1145–1156. doi:10.1080/01431160512331326747.
- Lauko, I. G., A. Honts, J. Beihoff, and S. Rupprecht. 2020. “Local Color and Morphological Image Feature Based Vegetation Identification and Its Application to Human Environment Street View Vegetation Mapping, or How Green Is Our County?” Geo-spatial Information Science 23 (3): 222–236. doi:10.1080/10095020.2020.1805367.
- Lee, J. S., M. R. Grunes, E. Pottier, and Laurent Ferrofamil. 2001. “Segmentation of Polarimetric SAR Images.” IEEE 2001 International Geoscience and Remote Sensing Symposium 1, 414–416. doi:10.1109/IGARSS.2001.976175
- Lee, S-H., and J. K. Seo. 2006. “Level Set-Based Bimodal Segmentation with Stationary Global Minimum.” IEEE Transactions on Image Processing 15 (9): 2843–2852. doi:10.1109/TIP.2006.877308.
- Li, Y., S. Martinis, S. Plank, and R. Ludwig. 2018. “An Automatic Change Detection Approach for Rapid Flood Mapping in Sentinel-1 SAR Data.” International Journal of Applied Earth Observation and Geoinformation 73: 123–135. doi:10.1016/j.jag.2018.05.023.
- Long, J., E. Shelhamer, and T. Darrell. 2015. “Fully Convolutional Networks for Semantic Segmentation.” IEEE Transactions on Pattern Analysis and Machine Intelligence 39 (4): 640–651. doi:10.1109/CVPR.2015.7298965.
- Ma, X., S. Liu, S. Hu, P. Geng, M. Liu, and J. Zhao. 2018. “SAR Image Edge Detection via Sparse Representation.” Soft Computing 22 (8): 2507–2515. doi:10.1007/s00500-017-2505-y.
- Meng, Q., X. Wen, L. Yuan, J. Liu, and H. Xu. 2018. “Local Region-Based Level Set Approach for Fast Synthetic Aperture Radar Image Segmentation.” Journal of Applied Remote Sensing 12 (1): 1. doi:10.1117/1.JRS.12.015002.
- Mumford, D., and J. Shah. 1989. “Optimal approximation by piecewise smooth functions and associated variational problems.” Communications on Pure and Applied Mathematics 42(4): 577–685. doi:10.1002/cpa.3160420503.
- Oktay, O., J. Schlemper, L. L. Folgoc, M. Lee, M. Heinrich, K. Misawa, K. Mori, S. Mcdonagh, N. Y. Hammerla, and B. Kainz. 2018. “Attention U-Net: Learning Where to Look for the Pancreas.” 1st Conference on Medical Imaging with Deep Learning (MIDL 2018), Amsterdam, The Netherlands
- Paszke, A., S. Gross, S. Chintala, G. Chanan, E. Yang, Z. Devito, Z. Lin, A. Desmaison, L. Antiga, and A. Lerer. 2017. “Automatic Differentiation in PyTorch.” 31st Conference on Neural Information Processing Systems (NIPS), Long Beach, CA, USA
- Shi, Z., L. She, L. Li, and Z. Hua. 2013. “A Modified Fuzzy C-Means for Bias Field Estimation and Segmentation of Brain MR Image.” Paper presented at the Control and Decision Conference (CCDC), pp.2080–2085. doi:10.1109/CCDC.2013.6561279
- Shuai, Y., S. Hong, and X. Ge. 2008. “SAR Image Segmentation Based on Level Set with Stationary Global Minimum.” IEEE Geoscience and Remote Sensing Letters 5 (4): 644–648. doi:10.1109/LGRS.2008.2001768.
- Silveira, M, and S Heleno. 2009. “Separation between Water and Land in SAR Images Using Region-Based Level Sets.” IEEE Geoscience & Remote Sensing Letters 6 (3): 471–475. doi:10.1109/LGRS.2009.2017283.
- Yu, F., and V. Koltun 2016. “Multi-Scale Context Aggregation by Dilated Convolutions.” the International Conference on Learning Representations (ICLR). San Juan, Puerto Rico.
- Yy, A, A Rx, A Wj, A Zc, A Yy, B Lx, and B Bxj. 2021. “Accurate and Automatic Tooth Image Segmentation Model with Deep Convolutional Neural Networks and Level Set Method.” Neurocomputing 419: 108–125. doi:10.1016/j.neucom.2020.07.110.
- Zhang, K., L. Zhang, Kin Man Lam, and D. Zhang. 2016. “A Level Set Approach to Image Segmentation with Intensity Inhomogeneity.” IEEE Transactions on Cybernetics 46 (2): 546–557. doi:10.1109/TCYB.2015.2409119.
- Zhong, Y. F., X. Y. Wang, S. Y. Wang, and L. P. Zhang. 2021. “Advances in Spaceborne Hyperspectral Remote Sensing in China.” Geo-spatial Information Science 24 (1): 95–120. doi:10.1080/10095020.2020.1860653.
- Zhou, Z., MMR Siddiquee, N. Tajbakhsh, and J. Liang. 2020. “UNet++: Redesigning Skip Connections to Exploit Multiscale Features in Image Segmentation.” IEEE Transactions on Medical Imaging 39 (6): 1856–1867. doi:10.1109/TMI.2019.2959609.