
 ?Mathematical formulae have been encoded as MathML and are displayed in this HTML version using MathJax in order to improve their display. Uncheck the box to turn MathJax off. This feature requires Javascript. Click on a formula to zoom.
ABSTRACT
Remote sensing data acquisition is one of the most essential processes in the field of Earth observation. However, traditional methods to acquire data do not satisfy the requirements of current applications because large-scale data processing is required. To address this issue, this paper proposes a data acquisition framework that carries out remote sensing metadata planning and then realizes the online acquisition of large amounts of data. Firstly, this paper establishes a unified metadata cataloging model and realizes the catalog of metadata in a local database. Secondly, a coverage calculation model is presented, which can show users the data coverage information in a selected geographical region under the data requirements of a specific application. Finally, according to the data retrieval results and the coverage calculation, a machine-to-machine interface is provided to acquire target remote sensing data. Experiments were conducted to verify the availability and practicality of the proposed framework, and the results show the strengths and powerful capabilities of our framework by overcoming deficiencies in traditional methods. It also achieved the online automatic acquisition of large-scale heterogeneous remote sensing data, which can provide guidance for remote sensing data acquisition strategies.
1. Introduction
With the rapid development of remote sensing and computer technology, the field of Earth observation has entered the big data era, along with a growing number of data types and increasing data amounts; thus, massive amounts of spatial data have been generated (Guo et al. Citation2016; He et al. Citation2015; Nativi et al. Citation2015; Huang and Wang Citation2020). Remote sensing technology plays significant roles in many fields as an important method for providing spatial information (Yan et al. Citation2019; Tuia, Muñoz-Marí, and Camps-Valls Citation2012), and the remote sensing data that covers a specific area can be utilized in many critical applications, such as resource investigation in agriculture and forestry (Seelan et al. Citation2003; Boyd and Danson Citation2005), environmental monitoring and assessment (Chen et al. Citation2013), and military position recognition (Xu et al. Citation2014). Therefore, these data are of great significance to both regional and global research. In the specific application scenario, how to filter data rapidly and acquire appropriate data from large-scale remote sensing data are issues that must be solved rapidly.
Scientific data are one of the national basic strategic resources and have great value for application and research (Weber, Bremer, and Pascucci Citation2007; Bordogna, Capelli, Ciriello, and Psaila Citation2018). Strengthening and standardizing the management of scientific data and promoting data sharing can provide support for national science and technology, economic development and national safety (Zuo and Chen Citation2013; Cragin et al. Citation2010). As the basic part of scientific research, the method used for acquiring data can restrict the research progress. In addition, data acquisition and aggregation are the premises of data sharing (Li et al. Citation2016). Thus, choosing an appropriate data acquisition method is important to ensure the successful completion of the research. As an important component of scientific data, remote sensing data can be applied to relevant research on the surface environment, providing geographic information and scientific guidelines for applications, such as natural disaster prevention and mitigation (Sambah and Miura Citation2016), environmental protection (Foody Citation2003) and decision support (Chen et al. Citation2020). Therefore, regardless of national strategies or scientific research, realizing the rapid acquisition of remote sensing data has immense theoretical and realistic significances (Gu et al. Citation2016; Li et al. Citation2019).
Generally speaking, remote sensing data consist of unstructured image entity data and structured metadata (Wang et al. Citation2015). Owing to the characteristics of massive spatial data in the big data era (Lu et al. Citation2011), realizing all entity data aggregation is limited by a few factors including the access method, storage space, labor cost, etc. In addition, some data are not of great research value due to their low imaging quality. For example, cloud cover is an important factor that is usually considered when selecting remote sensing data for specific applications. However, if the region of interest is covered with clouds, the information obtained from optical remote sensing data is very constrained, and microwave data would be a better choice as it has strong ability to penetrate clouds. In this circumstance, if we only acquire the metadata, then entity data acquisition could be accomplished based on the practical application requirement using the public network protocol that the data centers follow, then this method is relatively feasible, which not only saves a considerable amount of physical storage space but also stores target remote sensing entity data. Even more importantly, target data acquisition is realized. Managing data resources through metadata is the most commonly used data management mode at present (Li and Huang Citation2017). Consequently, establishing a unified metadata cataloging model to manage remote sensing data scientifically and efficiently is very important.
Remote sensing data is mainly distributed through satellite data center websites and data sharing platforms. However, although these methods can provide data retrieval and downloadable services, one question that none of these platforms can answer is how much the data cover the specific area. Under this condition, users can only search single data source, and are not aware of the overall data coverage of multiple data sources in a given geographical region, so it is more likely to result in the omission of high-quality remote sensing data. Here, data coverage is obtained by calculating the scene boundaries. Hence, there is an urgent need to establish a calculation model of data coverage, which calculates the total spatial range of the filtered data, where the coverage information can be presented in an intuitive way, and the target remote sensing data can be obtained.
For global change research, particularly the long time series dynamic change monitoring of forest biomass (Powell et al. Citation2010), vegetation cover (Yang, Weisberg, and Bristow Citation2012), cryosphere parameters (Nie et al. Citation2017), etc., a single type of remote sensing image data makes it difficult to meet application demands due to the regular revisit cycle and swath constraint that limits the width of image. In such a situation, large-scale data with various satellite platforms, time and resolutions should be combined and processed to achieve better temporal and spatial coverage (Dangermond and Goodchild Citation2020). However, at present, these data are always acquired from different data center websites, and the data acquisition process becomes inconvenient and complicated. Realizing the retrieval and acquisition of diverse types of remote sensing data on the same platform is gradually becoming the focus of concern. Furthermore, when acquiring the target remote sensing entity data of the study area, the traditional method is to use browsers, by adding the data to the shopping cart and creating an order (Zhang, Li, and Yu Citation2016). This method is more applicable for acquiring small batch data, which needs a specially assigned person to frequently check whether the data transmission is complete and then start a new mission. When obtaining large amounts of data, the above method is time-consuming and inefficient; therefore, realizing the automation of large-scale data acquisition is a better method that requires few human interventions.
The primary focus of this study is to facilitate the acquisition process of large-scale target remote sensing data; therefore, a framework is introduced. Firstly, a metadata cataloging model is established and the metadata can be obtained in local database; Secondly, a coverage calculation model is built, which can calculate the data coverage in a given area under the specific data requirement; Finally, a machine-to-machine interface is developed to realize the online acquisition of remote sensing data based on the public network protocol, which is more convenient and can reduce labor costs. The experimental results prove that the proposed framework can automatically acquire relevant remote sensing data online, which can provide guidance for data acquisition strategies and promote data service.
The remainder of this paper is organized as follows: Section 2 describes the background of the research including the metadata model, data coverage and data acquisition methods. Section 3 elaborates on the main contents of the proposed framework. Section 4 presents the experiments conducted and the results. Section 5 concludes and discusses the paper.
2. Background
2.1. Metadata model and management of spatial data
In the Earth observation domain, metadata is the descriptive information about the data, and research on building metadata model has always been an essential part. The International Organization for Standardization (ISO) Technical Committee 211 (TC 211), the Federal Geographic Data Committee (FGDC) and other communities have set up working groups to develop geospatial metadata standards, and typical metadata standards include the ISO 19115 geographical information metadata standard (ISO/TC211 Citation2014, Citation2019), the Content Standard for Digital Geospatial Metadata (CSDGM) (NASA Citation2002) and the SpatioTemporal Asset Catalogs (STAC) (STAC-community Citation2019).
ISO 19115. Developed by ISO/TC 211, this standard defines metadata elements, their properties and the relationships between elements. It is expressed in the Unified Modeling Language (UML).
CSDGM. Developed by FGDC, this standard provides a common set of terminology and definitions for digital geospatial data to support their collection and processing. It is organized in a hierarchy of data elements and compound elements.
STAC. Supported by a community of developers, this standard provides a common language to describe geospatial assets. It consists of four specifications: STAC Item, STAC Catalog, STAC Collection and STAC API.
Based on mainstream metadata standards, researchers have built different metadata models depending on different application scenarios. Di, Shao, and Kang (Citation2013) recorded provenance information in a web service workflow environment based on ISO 19115. Morsy et al. (Citation2017) extended Dublin Core metadata and designed a general metadata framework to improve the sharing and reuse of environmental models. Diao et al. (Citation2013) extended geological metadata standards to solve the problem of multi-source spatial data exchange.
For using metadata to manage spatial data resources, at present, the popular approach is to combine the file system with a traditional database (Innerebner et al. Citation2017). Under this condition, the database is used to store spatial metadata information. There are three main ways to manage spatial data with database using metadata. The first uses a detailed metadata information table that includes all the descriptive information about the spatial data, such as satellite identifier, sensor identifier, imaging time and spatial coordinates. The second uses the statistical metadata table, which contains the quantity information of the spatial data. For example, according to different fields, such as year, coverage region or cloud, spatial data can be classified into several groups, and then the number of data in various groups can be counted and stored in the statistical metadata table. With the statistical metadata table, the data manager can better grasp the existing data, which is beneficial to data management. The last uses the core metadata table, which includes the relatively important fields of the data source and is usually applied in application scenarios, such as data exchange and data archiving. This table must be a subset of the detailed metadata table, that is, the field number of this table must be less than or equal to that of the latter table.
The key to this research is to build an appropriate metadata cataloging model that can realize the unified management and retrieval of remote sensing data and then provide a convenient method to acquire the image entity data.
2.2. Data coverage
Current research on spatial data coverage places the greatest emphasis on data application, which mainly utilizes remote sensing images to study the features that are contained in a selected region. For example, Mu et al. (Citation2018), Zhang, Zhang, and Zhang (Citation2018) and A et al. (Citation2017) extracted and estimated vegetation coverage, and analyzed the temporal and spatial characteristics in their study areas using remote sensing data. Helber et al. (Citation2019), Kussul et al. (Citation2017), and Song et al. (Citation2018) recognized land cover types using different algorithms.
In addition, several studies start from the perspective of the data itself by studying exactly how much the remote-sensing images cover a given area, which is related to our research topic. Alfarrarjeh et al. (Citation2018) introduced a measurement model to determine the directional coverage of geo-tagged images in a given geographical region based on human visual perception. In their research, the datasets generated by sensor-equipped cameras, such as smartphones, are vertical and contains angle information; thus, the method to calculate data coverage is different from our research. Feng, Huang, and Zhang (Citation2012) adopted the PostGIS module of the open-source PostgreSQL database to compute the coverage of satellite data in regions of China. Their study area is limited, and they need to obtain the boundary vector of Chinese administrative divisions in advance. In contrast, our research can filter satellite data in any area of the world, and the boundary of the search area is defined by drawing a polygon on the map. In addition, they realize the calculation function on PostgreSQL, while we develop a WebGIS system.
2.3. Data acquisition methods
The acquisition methods for remote sensing metadata and entity data are different. With regard to metadata, firstly, the general method is to acquire the data package that contains the image data and metadata file, which will be stored on the local disk; then, the necessary fields and corresponding values from metadata file are extracted by developing programs, which will be stored in the metadata database for latter unified management (Luan Citation2019). However, when confronted with massive data in the big data age, it is undesirable to obtain all remote sensing data packages. This research applies web crawler technology to acquire the metadata information distributed on the data center websites.
For entity data, the method always uses data distribution platforms, including satellite data center websites and various data sharing websites. The former include the United States Geological Survey EarthExplorer(https://earthexplorer.usgs.gov/), Copernicus Open Access Hub (https://scihub.copernicus.eu/), the Level-1 and Atmosphere Archive & Distribution System Distributed Active Archive Center (LAADS DAAC) (https://ladsweb.modaps.eosdis.nasa.gov/search/), Land Viewer (https://eos.com/landviewer), etc. These websites archive all the remote sensing data produced since the satellites were launched. Data sharing websites include the China GEOSS data sharing network (http://www.chinageoss.cn/dsp/home/index.jsp), Geospatial Data Cloud (http://www.gscloud.cn/), RS Cloud Mart (http://www.rscloudmart.com/), etc. Part of the satellite data on the data sharing websites are mirror data of the data center websites, and the data acquisition process is restricted. Usually, data sharing platforms have the right to distribute data only when agreements are signed with the satellite data centers.
Recent studies propose different data acquisition models for remote sensing data (Servera et al. Citation2018; Svendsen, Martino, and Camps-Valls Citation2020; Martino et al. Citation2020; Moselhi, Bardareh, and Zhu Citation2020), and this paper focuses on automatically acquiring specific online remote sensing data based on the public network protocol they follow.
3. Acquisition framework for remote-sensing data
The proposed acquisition framework consists of two parts: requirement-driven metadata planning and online acquisition of data. The former contains data coverage calculation, and the latter contains metadata and entity data acquisition. shows the overview of the proposed framework.
Figure 1. Overview of the remote-sensing data acquisition framework.
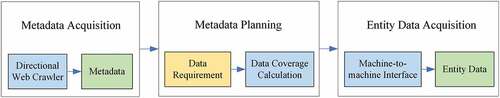
After the metadata is acquired, it is stored in a remote sensing metadata database. Under the data requirement of specific application scenario, the data coverage value can be calculated in the selected geographical region, and target remote sensing data can be acquired.
3.1. Requirement-driven metadata planning
3.1.1. Establishment of metadata cataloging model
Remote sensing metadata is the descriptive information of remote-sensing data, which can be applied to the organization, management, maintenance, integration and distribution of the data and increase the convenience of data retrieval and application (Huang, Li, and Wang Citation2018). In our research, it includes attribute information, such as the file name, platform, time range and spatial scope.
To achieve the unified description and catalog of multisource heterogeneous remote sensing data, this paper establishes a Metadata Cataloging Model (MCM) using UML, which is based on the investigation and survey of different metadata structures and various mainstream international metadata standards containing ISO 19115–2 and CSDGM. shows the structure of the metadata cataloging model.
Figure 2. Structure of the metadata cataloging model.
As shown in , there are eight classes in the model: MCM_Identifier, MCM_Platform, MCM_Time, MCM_Quality, MCM_Coordinate, MCM_Acquisition, MCM_Copyright and MCM_DataSharing. Each class contains different elements and their datatype properties are also defined. For each element in the metadata cataloging model, detailed information is shown in .
Table 1. Elements in the metadata cataloging model for remote-sensing data
shows that in addition to the essential information of the remote sensing data, other relevant information including cloud cover, acquisition, copyright and sharing is also introduced in the model, wherein cloud cover information is an important condition for measuring image quality and filtering data. The value of the “DataDownloadURL” element is necessary to obtain the latter entity data. The copyright information includes the “DataOwner” and “DataProvider” elements. Data owners produce the data and are usually an institute or organization that has the ownership of data, while data providers provide the data, and should have the right to distribute the data in principle. In addition, with a greater understanding and practice of Earth observation data openness and sharing, the “DataSharingStandard” element is the last element that is considered in the metadata cataloging model, which can standardize the data sharing process and promote data sharing services (Elwood Citation2008). Here “DataSharingStandard” mainly refers to but is not limited to Creative Commons Attribution 4.0 International (CC BY 4.0) (Commons Citation2019).
This model can provide guidance for building the metadata database, where the standardized management of multisource heterogeneous remote sensing data generated by different satellite platforms can be realized and fundamental data support for scientific research is ensured.
3.1.2. Establishment of coverage calculation model
According to data requirements of practical applications, it is important to be aware of how much data covers the study area, which can help determine the target data. To ascertain the data coverage information in the given area, this paper establishes the Coverage Calculation Model (CCM).
First, the remote sensing image data is expressed with four types of parameters. Given a remote sensing image dataset that consists of many image data, and
, where
is an integer and
, for one of the images
in
, where
is an integer and
, this paper expresses it as
, where
is the platform information, which includes the satellite name, sensor name and imaging mode;
is the start and end imaging time;
is the spatial location, which includes the latitudes and longitudes in four corners; and
is the cloud cover. The platform information, time and spatial coordinates are basic remote sensing data information, while taking the imaging mode and cloud cover into account is because they are important for microwave image and optical image, respectively.
CCM is related to the remote sensing image dataset and the selected geographical area, and the coverage value can be derived from it. The relationship among them is as follows:
where denotes the selected area, and
denotes the value of data coverage. In general,
can be expressed in the form of a decimal or percentage, and in this study, the former is adopted with a range from 0 to 1 and retains three decimal places.
Based on the above expression of remote sensing data, we define the coverage calculation model. The calculation formulae are as follows.
In Formula (2), expresses the selected region and is often a polygon;
expresses the remote sensing dataset relevant to
after the data filter process;
is the function to achieve union operation on boundary vectors of
;
is the function to achieve intersection operation between the result of
and the selected area
; and
is the function to calculate the area of the polygon. Formula (3) and (4) are the calculation methods for
and
.
As can be observed from Formula (2), there is a data filter process before the data coverage value is calculated, and the filter conditions are the parameters that are used to express , including the platform, time, spatial location, etc. After
is obtained, a series of operations are conducted, such as union, intersection and area calculation, and then the coverage value of remote sensing data in the selected area can be calculated.
To illustrate the coverage calculation process of remote sensing data clearly, a diagram is shown in .
Figure 3. Illustration of the remote sensing data coverage calculation.
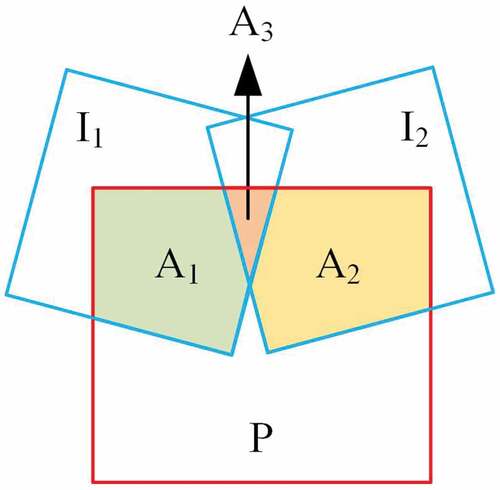
In , the red polygon denotes the selected geographical region; the two blue polygons expressed as
and
denote the cover range of remote sensing data related to
after the data filtering process. Then, the data cover range in the selected area is obtained after union and intersection operations, namely, the polygon composed of
,
and
. Finally, the data coverage value can be calculated by dividing the area of
into the areas of
,
and
.
3.2. Online data acquisition
The traditional remote sensing data acquisition method is mainly based on browsers, and there is a specific person who regularly checks whether the data transmission task is complete. It is time-consuming and inefficient, which reduces the efficiency of data acquisition. This research acquires remote sensing data, including metadata and entity data, based on the public network protocol Hypertext Transfer Protocol (HTTP) that the data center follows. The process of data acquisition is illustrated in .
Figure 4. Acquisition of remote sensing data based on HTTP.
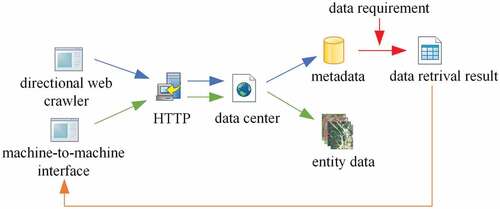
In , blue arrows represent the metadata acquisition process, green arrows represent the entity data acquisition process, red arrows represent the filtering data process, and orange line represent the data input process. In the metadata acquisition process, directional web crawler technology (Sheng Citation2016) is adopted, and remote sensing metadata is obtained from the data center website and stored in the local database. Then, through the data filter process, the target metadata is filtered according to the specific data requirement and is saved in an Excel file. Finally, in the entity data acquisition process, the target metadata is used as input, and a machine-to-machine interface is developed to obtain entity data.
3.2.1. Realization of metadata acquisition
With directional web crawler technology, the research crawls the data in a specially designed uniform resource locator (URL), directionally. Through gathering information from web pages of different satellite data centers, the metadata fields and the corresponding values can be extracted. In this process, to avoid storing different types of data under the same attribute, the data mapping operation is executed by defining the corresponding relation between the attributes stored in the database and the data extracted from data centers.
The detailed steps of acquiring remote sensing metadata using the directional web crawler can be described as follows:
Step 1. Determine the data acquirement according to the specific application, obtain the URL that distributes target data, and then create a URL queue.
Step 2. Traverse the queue and read each URL in it with certain rules when the queue is not null; otherwise, end the operation.
Step 3. Verify the login information of the data center website, which includes the login name and password. Only when they are correct, can the following operation be allowed to proceed.
Step 4. Send HTTP requests to the web server and parse the returned data from the website.
Step 5. Extract metadata information from the returned data, including metadata fields and the corresponding values, and map the returned data to the corresponding attributes in the database.
Step 6. Store metadata information in the metadata database.
Step 7. Return to Step 2.
3.2.2. Realization of entity data acquisition
The metadata is stored in the database table, which is the basis of subsequent operations. With the data coverage calculation in the retrieval results using the above coverage calculation model, users can have an overall grasp in the selected area, and the relevant remote sensing data can be obtained according to the metadata information. Instead of acquiring data through browsers directly, this research expands the existing data acquisition interface, which is provided by data centers and mainly refers to official websites, to a machine-to-machine interface that realizes the acquisition of large-scale remote sensing data. The core idea of the machine-to-machine interface is to make the data acquisition process automatic and convenient. Thus, there is no need for people to spend time obtaining the data, thereby saving labor costs.
4. Experiment and results
4.1. Data source and the experimental environment
Considering factors such as data resolution (spatial and temporal), data types and practical requirements of remote sensing data, Landsat-8 and Sentinel-1/2/3 were chosen as the data sources in this experiment.
Landsat-8 is the eighth satellite in the American Landsat program launched by the National Aeronautics and Space Administration on 11 February 2013, which provides a resource for global change research (Roy et al. Citation2014) and has a wide range of applications in forestry, agriculture, coastal studies, etc. Sentinel satellites are the constellations of the European Copernicus Programme conducted by the European Commission and European Space Agency, with seven satellites in orbit at present, which provide optical image data as well as microwave image data (Butler Citation2014). Among them, Sentinel-1 is a polar orbit C-band radar imaging system with multiple modes and is mainly used for land and ocean monitoring; Sentinel-2 provides optical imagery at a high spatial resolution over land and coastal waters, and is widely applied in vegetation monitoring, emergency management and land cover classification. Different from the above two satellites, Sentinel-3 is a polar orbiting, multi-sensor satellite system, and the instruments it carries consist of optical instruments and topographic instruments. Due to its characteristics, Sentinel-3 can be applied to numerous applications, such as the measurement of sea surface topography and temperature, high-precision ocean mapping and land surface mapping.
presents detailed information on the experimental data.
Table 2. Detailed information on experimental data
The experimental environment is built on a computer with the following configuration: Windows 10 operating system, 16 GB RAM, a 1 TB hard disk, and a 3.20 GHz core CPU. Our programs were developed with MyEclipse 8.5 and published by the Tomcat application server 7.0.
4.2. Results
4.2.1. Acquisition of the metadata
Based on the metadata cataloging model and the acquisition method, the experiment catalogs the metadata, and all the remote sensing metadata are uniformly managed in the metadata table. The research successfully aggregates global remote sensing metadata from 2016 to 2019, with 25,301,255 records in the metadata table, which includes 1,030,086 Landsat-8 records, 4,304,532 Sentinel-1 records, 15,576,763 Sentinel-2 records and 2,194,932 Sentinel-3 records. After the calculations, the metadata acquisition speed is approximately 75 records per second. The number of acquired metadata records for the different satellites in each year is shown in .
Table 3. Results of the acquired metadata
Through comparison, the number of metadata records in the database is consistent with those distributed on the satellite data center websites, which ensures the integrity and consistency of the metadata.
4.2.2. Coverage calculation of remote sensing data
To realize the function of the data coverage calculation, a WebGIS system is developed and deployed in this research based on OpenLayers3 and Java Struts2 (Li Citation2015; Sacks, Schiller, and Welch Citation1989). The main interface is shown in .
Figure 5. Main interface of the WebGIS system.
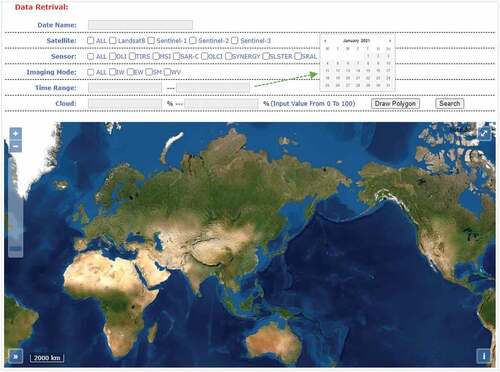
According to the data requirements of specific application scenarios, users can filter remote sensing data by setting the limiting conditions of the data name, satellite, sensor, imaging mode, time range, cloud value and spatial range. There are different forms to determine the value of the limiting condition in the system, where “Data Name” is specified by inputting a string; “Satellite” “Sensor” and “Imaging Mode” are specified with check boxes; “Time Range” is specified with time control with the format “YYYY-MM-DD,” and “Cloud” is specified by inputting numbers from 0 to 100. Finally, the spatial range, namely, latitude and longitude of the study area, they are specified by drawing a polygon on the map. After all the limiting conditions are determined, the coverage value can be calculated according to the coverage calculation model.
In many practical applications in Earth observation, the key is to ascertain the data coverage information of the study area in detail, which can help determine and acquire the target data. This study takes Hainan Province, China, as the study area, where the longitude ranges from 108.37° E to 111.03° E and the latitude ranges from 18.10° N to 20.10° N, and retrieves Sentinel-1 and Sentinel-2 data in each month of 2016 based on the metadata table established above, and then calculates the data coverage value. The results are shown in .
Table 4. Coverage value of Sentinel data in Hainan Province
As can be observed from , for both Sentinel-1 and Sentinel-2, there is a month whose coverage value is not 1, namely, March (0.71) and February (0.263), respectively. Because the coverage value of Sentinel-1 in March is greater than that of Sentinel-2 in February, Sentinel-1 achieves better coverage in this region. Meanwhile, the research also calculates the coverage values of data combination of Sentinel-1 and Sentinel-2, and finds that there is a complete coverage in each month.
In order to further study, the coverage information of remote sensing data in each week of every month, the coverage values of Sentinel-1 and Sentinel-2 data are calculated separately().
Table 5. Coverage value of Sentinel data in each week
According to the calculation results, for Sentinel-1 data, the coverage values of the first week in January, June, July, August and October are all 1, which means that complete coverage is realized. In February, May, September and November, complete coverage takes 2 weeks. With regard to Sentinel-2 data, there are also 5 months whose coverage values of the first week reach 1, including January, March, April, June and August. Four months meet the condition that the coverage value of the first 2 weeks is 1, including May, July, November and December. Therefore, for most months, it takes 2 weeks to achieve complete coverage for both Sentinel-1 and Sentinel-2.
Consequently, in Earth observation research, especially global change monitoring that requires processing a large amount of remote sensing data, if a single type of data cannot completely cover the study area, a combination of different data can be taken into account.
4.2.3. Acquisition of the entity data
To validate the data acquisition function of the machine-to-machine interface, the research retrieves Sentinel-1 and Sentinel-2 satellite data in 2016 on Hainan Province. At the same time, the imaging mode is set to IW, and cloud coverage is set to 0–30%. The results are displayed below the map, and each page shows five data records, as presented in .
Figure 6. Data retrieval results of Hainan Province.
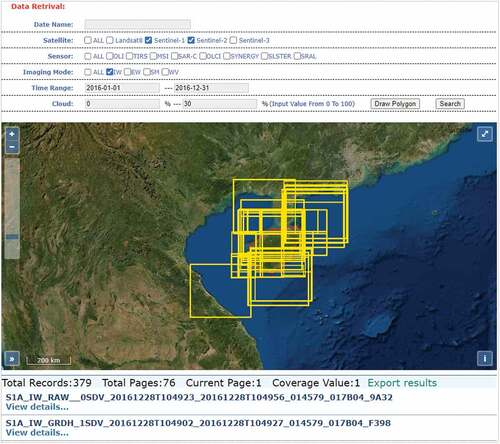
It can be observed from that there are 379 data records in total, and after the calculation, the data coverage value in the given area is 1. This means there is complete data coverage in the selected area, where the vector polygons with yellow boundaries are used to represent the satellite data and the polygon with red boundaries is used to represent the selected area.
Based on the data retrieval results, the paper exports them in the form of an Excel file and obtains the data list, which is indispensable for the automatic acquisition process of remote sensing data using the machine-to-machine interface. According to statistics, there are 213 Sentinel-1 data records and 166 Sentinel-2 data records, and with the machine-to-machine interface, all the entity data are acquired, which take up 0.44 TB and 0.07 TB of storage space, respectively.
Because the data may be changed easily after network transmission, MD5 (Message-Digest Algorithm 5) (Rivest and Dusse Citation1992) is utilized to validate the hash values between the data acquired through our machine-to-machine interface and the data distributed on the data center websites. The results prove that our method can ensure the accuracy, integrity and consistency of the target remote sensing data.
5. Conclusions and discussion
Faced with existing deficiencies in the process of acquiring large-scale heterogeneous remote sensing data in Earth observation research, under the background of big data, this paper proposes a data acquisition framework that achieves requirement-driven metadata planning and online acquisition of entity data. In the proposed framework, under the data requirements of specific application scenarios, the metadata was obtained with a metadata cataloging model, and then the coverage value can be obtained by using the coverage calculation model, which guarantees remote sensing data acquisition with high pertinency. The experimental results show that the proposed framework has strong practicality, which can provide researchers with data coverage information and achieve data acquisition online, pertinently and automatically, and is suitable to obtain large-scale heterogeneous remote sensing data.
However, the limitations of the proposed method are mainly reflected in two aspects. Firstly, because web crawler technology is used to obtain remote sensing metadata in this paper, most of the time we acquired near-real time data; therefore, the proposed method is suitable for near-real time data applications. Though at the technical level, the metadata can be updated and stored locally in real-time, this will increase the load pressure of the data distribution server, which is inadvisable. For real-time data application scenarios, signing contracts with the satellite data centers is suggested, and then they will provide a special data interface that can acquire data with a high efficiency. In addition, the metadata table stores all the metadata records acquired from various satellite data websites; thus, the huge data volume will result in low query efficiency in the data retrieval process. In the future work, we plan to build an index mechanism to improve query efficiency.
Acknowledgments
The authors would like to thank the United States Geological Survey (https://earthexplorer.usgs.gov/) and the European Space Agency (https://scihub.copernicus.eu/) for providing remote sensing data. The authors would also like to thank the anonymous reviewers and editors for commenting on this paper.
Data availability statement
The data that support the findings of this study are available from the corresponding author, upon reasonable request.
Disclosure statement
No potential conflict of interest was reported by the author(s).
Additional information
Funding
Notes on contributors
Shuang Wang
Guoqing Li is the director of the National Earth Observation Data Center of China, and a professor in the Aerospace Information Research Institute, Chinese Academy of Sciences. He received his Ph.D. degree from the Institute of Geographic Sciences and Natural Resources Research, Chinese Academy of Sciences. His research interests include high-performance remote sensing image processing technology, spatial data infrastructure and the big earth data.
Guoqing Li
Shuang Wang is currently pursuing the Ph.D. degree in signal and information processing with the University of Chinese Academy of Sciences. Her research interests include data engineering and geospatial data management.
Wenyang Yu
Wenyang Yu is a researcher in Aerospace Information Research Institute, Chinese Academy of Sciences. He received his Ph.D. degree from Institute of Remote Sensing Applications, Chinese Academy of Sciences. His research interests include GIS and high-performance geosciences simulating computation.
Yue Ma
Yue Ma is currently pursuing the Master degree in signal and information processing with the University of Chinese Academy of Sciences. Her research interests include geospatial data management and Global Discrete Grid System.
References
- A, D., W. Zhao, Z. Gong, M. Zhang, and Y. Fan. 2017. “Temporal Analysis of Climate Change and Its Relationship with Vegetation Cover on the North China Plain from 1981 to 2013.” Acta Ecologica Sinica 37 (2): 576–592. doi:10.5846/stxb201507301600.
- Alfarrarjeh, A., S.H. Kim, A. Deshmukh, S. Rajan, Y. Lu, and C. Shahabi. 2018. “Spatial Coverage Measurement of Geo-Tagged Visual Data: A Database Approach.” Paper presented at the 2018 IEEE Fourth International Conference on Multimedia Big Data, Xi’an, China, September 13–16.
- Bordogna, G., S. Capelli, D.E. Ciriello, and G. Psaila. 2018. “A Cross-analysis Framework for Multi-source Volunteered, Crowdsourced, and Authoritative Geographic Information: The Case Study of Volunteered Personal Traces Analysis against Transport Network Data.” Geo-spatial Information Science 21 (3): 257–271. doi:10.1080/10095020.2017.1374703.
- Boyd, D.S., and F.M. Danson. 2005. “Satellite Remote Sensing of Forest Resources: Three Decades of Research Development.” Progress in Physical Geography 29 (1): 1–26. doi:10.1191/0309133305pp432ra.
- Butler, D. 2014. “Earth Observation Enters Next Phase.” Nature 508 (7495): 160–161. doi:10.1038/508160a.
- Chen, C., J. Yan, L. Wang, D. Liang, and W. Zhang. 2020. “Classification of Urban Functional Areas from Remote Sensing Images and Time-series User Behaviour Data.” IEEE Journal of Selected Topics in Applied Earth Observations and Remote Sensing 14: 1207–1221. doi:10.1109/JSTARS.2020.3044250.
- Chen, S., Y. Hong, Q. Cao, P.E. Kirstetter, J.J. Gourley, Y. Qi, J. Zhang, K. Howard, J. Hu, and J. Wang. 2013. “Performance Evaluation of Radar and Satellite Rainfalls for Typhoon Morakot over Taiwan: Are Remote-sensing Products Ready for Gauge Denial Scenario of Extreme Events?” Journal of Hydrology 506 (Complete): 4–13. doi:10.1016/j.jhydrol.2012.12.026.
- Commons, C. 2019. “Cc by 4.0.” In Creative Commons.
- Cragin, M.H., C.L. Palmer, J.R. Carlson, and M. Witt. 2010. “Data Sharing, Small Science and Institutional Repositories.” Philosophical Transactions 368 (1926): 4023–4038. doi:10.1098/rsta.2010.0165.
- Dangermond, J., and M.F. Goodchild. 2020. “Building Geospatial Infrastructure.” Geo-spatial Information Science 23 (1): 1–9. doi:10.1080/10095020.2019.1698274.
- Di, L., Y. Shao, and L. Kang. 2013. “Implementation of Geospatial Data Provenance in A Web Service Workflow Environment with ISO 19115 and ISO 19115-2 Lineage Model.” IEEE Transactions on Geoscience and Remote Sensing 51 (11): 5082–5089. doi:10.1109/TGRS.2013.2248740.
- Diao, M., T. Xue, J. Li, C. Xu, S. Zou, and P. Zhao. 2013. “The Multi-source Spatial Data Management System Based on Geological Information Metadata Standard.” Remote Sensing for Land & Resources 25 (1): 165–170. doi:10.6046/gtzyyg.2013.01.29.
- Elwood, S. 2008. “Grassroots Groups as Stakeholders in Spatial Data Infrastructures: Challenges and Opportunities for Local Data Development and Sharing.” International Journal of Geographical Information Science 22 (1–2): 71–90. doi:10.1080/13658810701348971.
- Feng, K., P. Huang, and W.Y. Zhang. 2012. “Research on Coverage Calculation of Remote Sensing Satellite Data Based on PostgreSQL.” Advanced Materials Research 356-360: 2860–2863. http://0.4028/w ww.scientific.net/AMR.356-360.2860
- Foody, G.M. 2003. “Remote Sensing of Tropical Forest Environments: Towards the Monitoring of Environmental Resources for Sustainable Development.” International Journal of Remote Sensing 24 (20): 4035–4046. doi:10.1080/0143116031000103853.
- Gu, X., T. Yu, G. Tian, S. Zhou, C. Wei, J. Li, and Y. Qi. 2016. “Up to the Higher Altitude-the New “Three Campaigns” for the Development of China Spaceborne Remote Sensing Application.” Journal of Remote Sensing 20 (5): 781–793. doi:10.11834/jrs.20166244.
- Guo, H., Z. Liu, H. Jiang, C. Wang, J. Liu, and D. Liang. 2016. “Big Earth Data: A New Challenge and Opportunity for Digital Earth’s Development.” International Journal of Digital Earth 10 (1): 1–12. doi:10.1080/17538947.2016.1264490.
- He, G., L. Wang, Y. Ma, Z. Zhang, G. Wang, Y. Peng, T. Long, and X. Zhang. 2015. “Processing of Earth Observation Big Data: Challenges and Countermeasures.” Chinese Science Bulletin 60 (5–6): 470–478. doi:10.1360/N972014-00907.
- Helber, P., B. Bischke, A. Dengel, and D. Borth. 2019. “Eurosat: A Novel Dataset and Deep Learning Benchmark for Land Use and Land Cover Classification.” IEEE Journal of Selected Topics in Applied Earth Observations and Remote Sensing 12 (7): 2217–2226. doi:10.1109/JSTARS.2019.2918242.
- Huang, B., and J. Wang. 2020. “Big Spatial Data for Urban and Environmental Sustainability.” Geo-spatial Information Science 23 (2): 125–140. doi:10.1080/10095020.2020.1754138.
- Huang, K., G. Li, and J. Wang. 2018. “Rapid Retrieval Strategy for Massive Remote Sensing Metadata Based on GeoHash Coding.” Remote Sensing Letters 9 (10–12): 1070–1078. doi:10.1080/2150704X.2018.1508907.
- Innerebner, M., A. Costa, E. Chuprikova, R. Monsorno, and B. Ventura. 2017. “Organizing Earth Observation Data inside A Spatial Data Infrastructure.” Earth Science Informatics 10 (1): 55–68. doi:10.1007/s12145-016-0276-0.
- ISO/TC211. 2014. “ISO 19115-1:2014. Geographic Information-Metadata-Part 1: Fundamentals.” In.: ISO/TC 211.
- ISO/TC211. 2019. “ISO 19115-2:2019. Geographic information-Metadata-Part 2: Extensions for Acquisition and Processing.” In.: ISO/TC 211.
- Kussul, N., M. Lavreniuk, S. Skakun, and A. Shelestov. 2017. “Deep Learning Classification of Land Cover and Crop Types Using Remote Sensing Data.” IEEE Geoscience and Remote Sensing Letters 14 (5): 778–782. doi:10.1109/LGRS.2017.2681128.
- Li, G., and Z. Huang. 2017. “Data Infrastructure for Remote Sensing Big Data: Integration, Management and On-demand Service.” Journal of Computer Research and Development 54 (2): 267–283. doi:10.7544/1000-1239.2017.20160837.
- Li, G., H. Zhang, L. Zhang, Y. Wang, and C. Tian. 2016. “Development and Trend of Earth Observation Data Sharing.” Journal of Remote Sensing 20: 979–990. doi:10.11834/jrs.20166173.
- Li, G., J. Zhao, V. Murray, C. Song, and L. Zhang. 2019. “Gap Analysis on Open Data Interconnectivity for Disaster Risk Research.” Geo-spatial Information Science 22 (1): 45–58. doi:10.1080/10095020.2018.1560056.
- Li, X. 2015. “Development and Optimization of WebGIS Front-end Based on JavaScript.” Master diss., Jilin University.
- Lu, X., C. Cheng, J. Gong, and L. Guan. 2011. “Review of Data Storage and Management Technologies for Massive Remote Sensing Data.” Science China-technological Sciences 54 (12): 3220–3232. doi:10.1007/s11431-011-4549-z.
- Luan, J. 2019. “Research on Selection and Intergrating Method of Global Scale Remote Sensing Dataset Based on Landsat-8.” Master diss., Beijing Forestry University.
- Martino, L., D.H. Svendsen, J. Vicent, and G. Camps-Valls. 2020. “Adaptive Sequential Interpolator Using Active Learning for Efficient Emulation of Complex Systems.” Paper presented at the 2020 IEEE International Conference on Acoustics, Speech and Signal Processing (ICASSP), Barcelona, Spain, May 04–09.
- Morsy, M.M., J.L. Goodall, A.M. Castronova, P. Dash, V. Merwade, J.M. Sadler, M.A. Rajib, J.S. Horsburgh, and D.G. Tarboton. 2017. “Design of A Metadata Framework for Environmental Models with an Example Hydrologic Application in HydroShare.” Environmental Modelling and Software 93: 13–28. doi:10.1016/j.envsoft.2017.02.028.
- Moselhi, O., H. Bardareh, and Z. Zhu. 2020. “Automated Data Acquisition in Construction with Remote Sensing Technologies.” Applied Sciences 10 (8): 2846. doi:10.3390/app10082846.
- Mu, X., W. Song, Z. Gao, T.R. McVicar, R.J. Donohue, and G. Yan. 2018. “Fractional Vegetation Cover Estimation by Using Multi-angle Vegetation Index.” Remote Sensing of Environment 216: 44–56. doi:10.1016/j.rse.2018.06.022.
- NASA. 2002. “US FGDC Content Standard for Digital Geospatial Metadata: Extensions for Remote Sensing Metadata.” In NASA.
- Nativi, S., P. Mazzetti, M. Santoro, F. Papeschi, M. Craglia, and O. Ochiai. 2015. “Big Data Challenges in Building the Global Earth Observation System of Systems.” Environmental Modelling and Software 68: 1–26. doi:10.1016/j.envsoft.2015.01.017.
- Nie, Y., Y. Sheng, Q. Liu, L. Liu, S. Liu, Y. Zhang, and C. Song. 2017. “A Regional-scale Assessment of Himalayan Glacial Lake Changes Using Satellite Observations from 1990 to 2015.” Remote Sensing of Environment 189: 1–13. doi:10.1016/j.rse.2016.11.008.
- Powell, S.L., W.B. Cohen, S.P. Healey, R.E. Kennedy, G.G. Moisen, K.B. Pierce, and J.L. Ohmann. 2010. “Quantification of Live Aboveground Forest Biomass Dynamics with Landsat Time-series and Field Inventory Data: A Comparison of Empirical Modeling Approaches.” Remote Sensing of Environment 114 (5): 1053–1068. doi:10.1016/j.rse.2009.12.018.
- Rivest, R., and S. Dusse. 1992. “The MD5 Message-digest Algorithm.” In.: MIT Laboratory for Computer Science Cambridge.
- Roy, D.P., M.A. Wulder, T.R. Loveland, C.E. Woodcock, R.G. Allen, M.C. Anderson, D. Helder, J.R. Irons, D.M. Johnson, and R. Kennedy. 2014. “Landsat-8: Science and Product Vision for Terrestrial Global Change Research.” Remote Sensing of Environment 145: 154–172. doi:10.1016/j.rse.2014.02.001.
- Sacks, J., S.B. Schiller, and W.J. Welch. 1989. “Designs for Computer Experiments.” Technometrics 31 (1): 41–47. doi:10.1080/00401706.1989.10488474.
- Sambah, A.B., and F. Miura. 2016. “Spatial Data Analysis and Remote Sensing for Observing Tsunami-inundated Areas.” International Journal of Remote Sensing 37 (9): 2047–2065. doi:10.1080/01431161.2015.1136450.
- Seelan, S., S. Laguette, G.M. Casady, and G. Seielstad. 2003. “Remote Sensing Applications for Precision Agriculture: A Learning Community Approach.” Remote Sensing of Environment 88 (1): 157–169. doi:10.1016/j.rse.2003.04.007.
- Servera, J.V., L. Alonso, L. Martino, N. Sabater, J. Verrelst, G. Camps-Valls, and J. Moreno. 2018. “Gradient-based Automatic Lookup Table Generator for Radiative Transfer Models.” IEEE Transactions on Geoscience and Remote Sensing 57 (2): 1040–1048. doi:10.1109/TGRS.2018.2864517.
- Sheng, J. 2016. “Design and Implementation of A Directional Information Extraction Model for Dynamic Web Pages.” Master diss., Yanshan University.
- Song, X., M.C. Hansen, S.V. Stehman, P. Potapov, A. Tyukavina, E. Vermote, and J.R.G. Townshend. 2018. “Global Land Change from 1982 to 2016.” Nature 560 (7720): 639–643. doi:10.1038/s41586-018-0411-9.
- STAC-community. 2019. “SpatioTemporal Asset Catalogs.” In STAC community.
- Svendsen, D.H., L. Martino, and G. Camps-Valls. 2020. “Active Emulation of Computer Codes with Gaussian Processes–Application to Remote Sensing.” Pattern Recognition 100: 107103. doi:10.1016/j.patcog.2019.107103.
- Tuia, D., J. Muñoz-Marí, and G. Camps-Valls. 2012. “Remote Sensing Image Segmentation by Active Queries.” Pattern Recognition 45 (6): 2180–2192. doi:10.1016/j.patcog.2011.12.012.
- Wang, X., Q. Yang, F. Chen, W. Ma, and S. Zhang. 2015. “Storage Model Design and Implementation of High Resolution and Hyperspectral Remote Sensing Image Based on NoSQL.” Earth Science(Journal of China University of Geosciences) 40 (8): 1420–1426. doi:10.3799/dqkx.2015.128.
- Weber, G.H., P. Bremer, and V. Pascucci. 2007. “Topological Landscapes: A Terrain Metaphor for Scientific Data.” IEEE Transactions on Visualization and Computer Graphics 13 (6): 1416–1423. doi:10.1109/TVCG.2007.70601.
- Xu, S., X. Mu, B. Ke, and X. Wang. 2014. “Dynamic Monitoring of Military Position Based on Remote Sensing Image.” Remote Sensing Technology and Application 29 (3): 511–516. doi:10.11873/j.1004-0323.2014.3.0511.
- Yan, J., L. Wang, W. Song, Y. Chen, X. Chen, and Z. Deng. 2019. “A Time-series Classification Approach Based on Change Detection for Rapid Land Cover Mapping.” ISPRS Journal of Photogrammetry and Remote Sensing 158: 249–262. doi:10.1016/j.isprsjprs.2019.10.003.
- Yang, J., P.J. Weisberg, and N.A. Bristow. 2012. “Landsat Remote Sensing Approaches for Monitoring Long-term Tree Cover Dynamics in Semi-arid Woodlands: Comparison of Vegetation Indices and Spectral Mixture Analysis.” Remote Sensing of Environment 119 (none): 62–71. doi:10.1016/j.rse.2011.12.004.
- Zhang, J., G. Li, and W. Yu. 2016. “Unified Integration Discovery for Earth Observation Data Based on OpenSearch.” Computer Engineering 42 (6): 60–67. doi:10.3969/j.1000-3428.2016.06.011.
- Zhang, Y., Z. Zhang, and Z. Zhang. 2018. “Remote Sensing Study of Vegetation Coverage during the Period 1992—2014 in Dananhu Desert Area, Xinjiang.” Remote Sensing for Land & Resources 30 (1): 187–195. doi:10.6046/gtzyyg.2018.01.26.
- Zuo, J., and Y. Chen. 2013. “The Analysis on Sharing Mode of Scientific Data in the Environment of Big Data.” Journal of Intelligence 32 (12): 151–154. doi:10.3969/j.1002-1965.2013.12.028.