
 ?Mathematical formulae have been encoded as MathML and are displayed in this HTML version using MathJax in order to improve their display. Uncheck the box to turn MathJax off. This feature requires Javascript. Click on a formula to zoom.
ABSTRACT
Recent urban transformations have led to critical reflections on the blighted urban infrastructures and called for re-stimulating vital urban places. Especially, the metro has been recognized as the backbone infrastructure for urban mobility and the associated economy agglomeration. To date, limited research has been devoted to investigating the relationship between metro vitality and built environment in mega-cities empirically. This paper presents a multisource urban data-driven approach to quantify the metro vibrancy and its association with the underlying built environment. Massive smart card data is processed to extract metro ridership, which denotes the vibrancy around the metro station in physical space. Social media check-ins are crawled to measure the vitality of metros in virtual spaces. Both physical and virtual vibrancy are integrated into a holistic metro vibrancy metric using an entropy-based weighting method. Certain built environment characteristics, including land use, transportation and buildings are modeled as independent variables. The significant influences of built environmental factors on the metro vibrancy are unraveled using the ordinary least square regression and the spatial lag model. With experiments conducted in Shenzhen, Singapore and London, this study comes up with a conclusion that spatial distributions of metro vibrancy metrics in three cities are spatially autocorrelated. The regression analysis suggests that in all the three cities, more affluent urban areas tend to have higher metro virbrancy, while the road density, land use and buildings tend to impact metro vibrancy in only one or two cities. These results demonstrate the relationship between the metro vibrancy and built environment is affected by complex urban contexts. These findings help us to understand metro vibrancy thus make proper policy to re-stimulate the important metro infrastructure in the future.
1. Introduction
Cities aggregate vast infrastructures and populations spatially. They have been experiencing great transformations because of technological innovation, industrial revolution and constant migration. Recent urban transformations have led to critical reflections on the blighted urban infrastructures and called for revitalization of urban places (Martí, Serrano-Estrada, and Nolasco-Cirugeda Citation2017). Vibrant spaces can not only promote healthy urban livings but also foster urban developments (Tu et al. Citation2020). Urban developments, if well performed, may reinforce urban vibrancy in the future. Particularly, the metro, which is recognized as the backbone of cities’ public transportation systems, plays an important role in urban growth (Zheng et al. Citation2016). The metro system supports millions of urban trips every day and the associated economy agglomeration in the mega-city (Gutiérrez, Cardozo, and García-Palomares Citation2011; Chakour and Eluru Citation2016). It is an important urban infrastructure to be vitalized. It is necessary to energize the metro space by quantifying urban vibrancy produced by metro and its influencing factors in cities.
Urban vibrancy is firstly introduced by Jacob (Citation1961) as human activities and the interactions between residents and spaces. Jacobs pointed out that more vibrant streets and neighborhoods tend to engage people in commercial or residential activities. Montgomery (Citation1998)further suggested that a vibrant place should be open space supporting diverse human activities and interactions. In general, the vibrancy signifies the intensity of human activities and interactions. Following this stream, many approaches have been developed to quantify the vibrancy of streets or neighborhoods, such as field observation and interview (Sung, Go, and Choi Citation2013). For example, Zarin, Niroomand, and Heidari (Citation2015) measured the street vibrancy in Tehran through a random sampling questionnaire survey. Wu et al. (Citation2018b) quantified the neighborhood vibrancy in the suburban of Beijing by a GPS-based activity survey. These studies paid little attention to the metro vitality, but the metro has been recognized as the backbone infrastructure for urban mobility and the associated economy agglomeration in worldwide cities, such as Shenzhen and London. This study examines the metro vitality by limiting the study area in the service area of metro station.
The development of Information and Communication Technology (ICT) reshapes urban living. More and more human interactions are performed online, rather than in physical space. For example, many urban habitats buy foods in Amazon fresh, rather than driving to the supermarket. Online chatting via instant messenger substitutes some face-to-face meeting, especially under the threat of Coronavirus disease 2019 (COVID-19). Online group games also attract more and more young people therefore reduce outdoor games. Human activities and interactions in cities are being changed (Yu and Shaw Citation2008; Shaw and Sui Citation2018). Previous studies have demonstrated that less daily activities and travels are conducted (Best and Butler Citation2015). These studies also imply that the quantification of urban vibrancy in physical space should be extended into virtual space.
On the other hand, location-awareness technology is widely adopted. These new tools enable us to collect massive geospatial urban data, for example, point-of-interests (POIs), mobile phone records (Yue et al. Citation2017; Tu et al. Citation2017), social media data (Lansley and Longley Citation2016; Aiello et al. Citation2016; Chen et al. Citation2019; Lock and Pettit Citation2020), smart card data (Zhong et al. Citation2016) and vehicle GPS trajectories (Fang et al. Citation2012). These new urban sensing data contain rich information about human activities and interactions in both physical and virtual spaces (Li et al. Citation2020; Monika Citation2020). Such information enables new ways of quantifying the vibrancy. For example, De Nadai et al. (Citation2016) took mobile phone records as the proxy of human activities and mapped city-wide urban vibrancy in six Italian cities. Chen et al. (Citation2019) examined the spatial distribution of urban vibrancy using Facebook data. These advanced studies demonstrate the effectiveness of new urban sensed data when quantifying vibrant space. Furthermore, built environment, including land use, road network and buildings, has a great impact on fostering urban vibrancy. These studies focus on streets, neighborhoods or the whole city and provide useful insights into revealing the mechanism between vibrancies in these areas and built environment.
Few studies have attempted to reveal the relationship between metro vitality and the underlying built environment. Similar to urban vibrancy, the metro vibrancy describes the attraction, diversity and prosperity of places resulting from human activities and interactions but limited within the service area of metro station. To fill the research gap, this study presents a multisource urban big data-driven approach to quantitatively measure metro vibrancy and its association with urban built environment. Massive smart card data and social media check-ins are leveraged to measure metro vibrancy in both physical and virtual space, which are then integrated into a holistic metro vibrancy metric using an entropy-based weighting method. Several built environmental factors, including land uses and transportation infrastructures, are modeled as independent variables. The Spatial Lag Model (SLM) is implemented to unravel the mechanism of built environment’s influences on the metro vibrancy. Three global cities, Shenzhen, Singapore and London, are selected as experimental cities.
The remainder of this paper is organized as follows: Section 2 reviews related literature in the domain of urban vibrancy and urban big data analytics. Section 3 introduces the studied cities and used datasets. Section 4 describes the presented method. Section 5 reports and discusses the results. The last section concludes this study and outlooks future work.
2. Literature review
2.1. Urban vibrancy
Urban vibrancy, alternatively urban vitality, is originally proposed by Jacob (Citation1961) and illuminated as “liveliness and variety attract more liveliness; deadness and monotony repel life”; Lynch (Citation1984) interpreted vibrancy by decomposing it into three main components: urban morphology, urban function and urban society. Later studies mainly contribute to verify Jacobs’ spatial vitality theory and Lynch’s hypothesis empirically using emerging data and new measures. Spatial vibrancy, particularly, at the scale of street and neighborhood, has always been an important topic in urban studies and planning practices. A vibrant urban space not only supports diverse human activities and livable urban spaces but also facilitates sustainable developments in the long run (Huang, Wong, and Chen Citation1998) while the concentration attracted in geographical studies on spatial vibrancy is mostly stimulated by the availability of spatial data, which allows us to describe spatially explicit urban vibrancy in a quantitative form. Earlier work has attempted to, for instance, use surveyed activity data (Sung, Go, and Choi Citation2013), land use (Jacobs-Crisioni et al. Citation2014) and housing price (Nicodemus Citation2013) to proxy urban vibrancy.
The more recent development of spatial vibrancy uses emerging geospatial sensed data. Compared to previous work, human mobility data provides a more straightforward approximation of human activity at a finer spatial and temporal granularity. For instance, human activity was extracted from mobile phone data, integrated with land use and socio-demographic information from the Italian Census and Open Street Map, and tested Jacob’s four conditions in six Italian cities (De Nadai et al. Citation2016). Other mainstreaming measures define urban vibrancy as attraction, diversity and accessibility of a place also based on Jacob’s theory. For example, Yue et al. (Citation2017) developed a series of mixed-use indicators profiling characteristics of mixed-use neighborhoods using the mobile phone and POIs data in Shenzhen. Besides, it is worth emphasizing the temporal dimension, as Jacob describes urban vibrancy as street life over a 24-h period. Therefore, spatio-temporal variability is considered in nearly all new measures, which gives a better profile of the dynamics of the space (Wu et al. Citation2018a; Sulis et al. Citation2018). Recently, activities in virtual space have attracted much attention. In Sulis et al. (Citation2018), diversity was calculated as from three dynamic attributes: intensity, variability and consistency, using Twitter data and regression model to unveil the most vibrant areas in London.
The metro system attracts much scholarly attention as the main transportation infrastructure. One stream of related works studied the physical human activities around the metro stations by examining the ridership (Zhong et al. Citation2016; Tu et al. Citation2018). For example, Gutiérrez, Cardozo, and García-Palomares (Citation2011) quantified the metro ridership in Madrid using smart card data. They developed a distance-decay weighted regression function to explore the association with built environment. Zhao et al. (Citation2013) examined the metro ridership in Nanjing, China. They found that population, business/office floor area, central business district, number of education buildings, entertainment venues and shop centers had a significant influence on the metro ridership. Chakour and Eluru (Citation2016) examined the association of transit ridership and stop-level infrastructure and the built environment in Montreal using a composite marginal likelihood-based ordered response probit model. Their results demonstrated that public transportation, parks, commercial enterprises and residential neighborhoods are significantly associated with transit ridership, in other words, the activities around the metro stations. However, these studies focus on the physical human activities around the metro station and ignore the vibrancy in virtual spaces.
Rather than street vibrancy and neighborhood vibrancy, our work has a specific focus on the metro. The ultimate goal of measures and analysis of the metro vibrancy is to evaluate the urban form or land-use configuration around the metro, which is in line with previous studies (Yue et al. Citation2017; Song, Merlin, and Rodriguez Citation2013). Shreds of evidence have been reported in previous work that the built environment has an impact on urban vibrancy, but the conclusion varies from case to case. For instance, negative impact of mixed land use on neighborhood vibrancy has been observed in high-density cities by Yue et al. (Citation2017); while, in another study (Li et al. Citation2016), they found that increasing the road density will encourage human travel and the subsequent activities thus cultivate vibrancy. Obviously, more empirical studies and in-depth analysis of the reasoning behind spatial vitality in different urban contexts are necessary.
2.2. Urban big data analytics
Technological advancements have enabled urban scholars to scrutinize human activity at multi-scale and in fine granularity. Mobile phone datasets, smart card transactions and taxi GPS trajectories, dockless bike-sharing and scooters have all received intellectual attentions in the last decade (González, Hidalgo, and Barabási Citation2008; Zhang et al. Citation2018). Among these new urban data, smart card data has been heavily explored in transportation research to gain a better understanding of individual travel behavior, which can inform strategic transit planning as well as day-to-day operations (Pelletier, Trépanier, and Morency Citation2011). Smart card data can be used to estimate congestion dynamics, which includes station-level crowdedness and frequency of missed trains (Ceapa, Smith, and Capra Citation2012). Transit usage is usually associated with a high degree of regularity (Goulet-Langlois et al. Citation2018; Zhong et al. Citation2016). The collective regularity in human travels leads to the emergence of “familiar strangers” in daily life. Also, by digesting historical travel behavior, the regularity makes it possible to anticipate individual movement by machine learning or econometric methods. Moreover, there is a certain degree of variability in individual travel behavior (Morency, Trepanier, and Agard Citation2008; Zhong et al. Citation2016). The travel pattern changes can be abrupt, substantial and persistent in certain cases (Zhao, Koutsopoulos, and Zhao Citation2018). The smart card can provide wide coverage, but it comes with disadvantages. In many cities, the alighting stop is not immediately available and requires inferences (Tu et al. Citation2018). The data lacks user-profiles and trip purposes, which hinder in-depth applications. Some attempts were found to estimate behavior attributes by fusing travel survey data (Kusakabe and Asakura Citation2014). Additionally, one dataset alone may offer a bias answer. The multi-faceted analysis of urban studies is needed with a combination of multiple data sources (Zhang et al. Citation2018, Citation2019).
Social media data, especially georeferenced check-in activities, emerge as complementary to the human activity dataset. Different from the aforementioned human activity data, social media data has carried important attributes of human activities, which allows us to explore spatial variations of activities in different categories (Hasan, Zhan, and Ukkusuri Citation2013). These crowdsourcing data sources reveal individual activities-related choices and preferences, which provides a new perspective for sensing urban place and identifying urban functions (Lansley and Longley Citation2016; Martí, Serrano-Estrada, and Nolasco-Cirugeda Citation2017; Shen and Karimi Citation2016). Fusing it with traditional classification in remote sensing, fine-scale land use map can be derived (Tu et al., Citation2020). Some social media data include geo-tagged pictures, which have broadened the horizon of its applications. The geo-tagged pictures can help better understand how urban spaces are used by citizens (Liu et al. Citation2016). Using the real-time crowdsourcing pictures, scholars are able to identify urban emergency events (Xu et al. Citation2016) and gain a better understanding of noise distribution inside the city (Aiello et al. Citation2016). On the other hand, social media data indicates the online activity and interaction of social media users via internet; therefore, they provide an opportunity to investigate human activity in virtual space. Using social media check-ins as an example, this study measures the metro vibrancy in virtual space and then presents an integrated vibrancy indicator for deep vibrancy analysis.
3. Study area and datasets
3.1. Study area
This study is conducted in three cities, including Shenzhen, Singapore and London. Shenzhen is a mega-city located in the Pearl River Delta, to the north of Hong Kong. Since its establishment in 1979 as a Special Economic Zone (SEZ) of China, Shenzhen has become one of the largest and most innovative cities in China, covering 1996 km2 with 18 million people. The south Shenzhen is the urban center while the north Shenzhen is sub-urban area with manufacturing factories and warehouses. To the year 2017, the metro in Shenzhen contains 8 lines with 167 stations, as ) shows. The second studied city is Singapore, a city-state that covers a total area of 719 km2, and a total population of 5.6 million as of 2016. For Singapore, the metro system has 128 stations and covers 149 km, as ). The third city is London, the capital of United Kingdom. The subway in London has a long history since 1956. To 2014, the London metro has 11 lines and 382 stations, supporting 4 million travels per day, as ) shows. To keep the completeness, several metro stations out of London were also displayed
Figure 1. Study area of: (a) Shenzhen; (b) Singapore; (c) London.
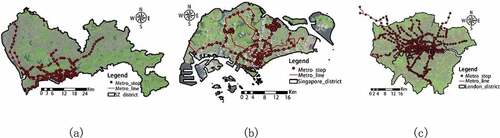
Outlining the Metro Station Service Area (MSSA) is an important issue for investigating the metro vibrancy. There are many approaches to capture the MSSA, for example, interviewing the destination of metro travelers. Many empirical studies (Gutiérrez, Cardozo, and García-Palomares Citation2011; Zhao et al., Citation2013; Chakour and Eluru Citation2016) have demonstrated that the attraction of the metro tends to decay with the distance to the metro station. The MSSA can be represented by a circular area centered at the metro station. Following previous studies (Zielstra and Hochmair Citation2011; Zhao et al. Citation2013), the radius of the circle is set to 750 meters. The vibrancy and the built environment in MSSA are studied.
3.2. Datasets
Multi-source urban datasets are used to measure the vibrancy of the MSSA and built environment, including smart card data, social media check-ins and geospatial urban data. Details of these datasets are described as below.
The smart card dataset in Shenzhen covered one week, March 6th to 12th, 2017, containing 12 million records of more than 3 million users. The social media check-ins in the same period were crawled from Sina Weibo, one of the largest social media service providers in China. In particular, 798,789 check-ins in the MSSA were captured. The population data, land use map, road network and building footprints, provided by the commission of natural resource and urban planning, are used to quantify the built environment characteristics.
The smart card data in Singapore that covered one week from Oct 20th to 26th, 2014 is used to infer the physical vibrancy around metros. It contains 2,778,142 users with metro, and 14,839,175 trips are conducted. Tweets are crawled from Twitter to compute the vibrancy in virtual space. Finally, 108, 594 tweets are collected in the same period of EZ-link card transaction. The household interview travel survey in 2012 is used to capture the social-economic characteristics of MSSAs. Road network is acquired from Navteq, a professional map company. 40, 782 POIs are extracted by calling Google Place API. The building floor area of different functions is derived using the method detailed in (Zhu and Ferreira Citation2015).
The study in London is based on tap-in and tap-out records of Oyster card data, which is used by more than 80% of the passengers in metropolitan areas. The used Oyster card data covers one week in January 2014. The dataset captures a daily average of 3.65 million tap-ins (and tap-outs) at the 382 stations in London. More information about the original smart card data used for calculation in this paper can be found in (Zhong et al. Citation2016; Sulis et al. Citation2018). Tweets are crawled from Twitter to capture the activity in virtual space. The POI data and land use map are obtained from the Ordinance Survey (OS),Footnote1 which is the national mapping agency for Great Britain. The road network and building footprints are downloaded from Open Street Map.
4. Methodology
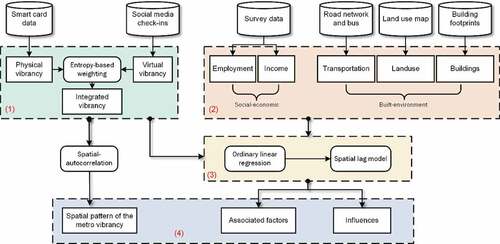
We propose a multi-source geospatial data-driven approach to investigate the metro vibrancy and unravel the influences of built environment, as displays. The vibrancy in physical and virtual space is measured using smart card data and social media check-ins respectively. An integrated vibrancy indicator is presented to explore the spatial pattern. Furthermore, Ordinary Least Square Regression (OLS) model and SLM are implemented to explore the intrinsic relationship between the metro vibrancy and the built environment. Finally, the impact on the metro vibrancy is analyzed and compared in three cities. The commons and differences between the interactions of the vibrancy and built environment are examined
Figure 2. The multi-source geospatial-data driven framework to explore the vibrancy of the metro service area.
4.1. Measuring the metro vibrancy
4.1.1. Physical vibrancy
The physical vibrancy is measured based on the daily ridership of one metro station as the ridership potentially reflects the intensity of physical activity around the metro. Both the tap-in and tap-out events are summed. To eliminate the differences of the metro ridership in three cities, the physical vibrancy of a metro is normalized to the range [0, 1] with the Min-Max normalization method, as EquationEquation (1)(1)
(1) , where j is a metro station, Rj is the daily ridership of a metro, Rmin and Rmax denote the minimum and the maximum metro ridership in the city respectively.
4.1.2. Virtual vibrancy
The virtual vibrancy is delineated by the intensity of the human activities in virtual space, such as social network, social media platform and online game systems. In this study, considering the available dataset, social media check-ins are taken as the proxy of the activity in virtual space. Formally, the virtual vibrancy is measured as EquationEquation (2)(2)
(2) , where Nj is the total geotagged social media check-ins within a MSSA. Similarly, the virtual vibrancy is normalized by the minimum (Nmin) and the maximum (Nmin) number of the check-ins in all MSSAs.
4.1.3. Integrated vibrancy
A single data set only describes one facet of the vitality, which lacks a comprehensive perspective over urban vibrancy (Huang et al. Citation2020; Huang and Wang Citation2020). Here, the Entropy-based weighting methodis utilized to integrate the physical and virtual vitality. The Entropy-based weighting method is an objective weighting method considering the distribution of values. The Shannon entropy of one type of vibrancy, Hk, is measured as EquationEquation (3)(3)
(3) , where vkj is the vibrancy in a MSSA, j; n is the total count of MSSAs.
The integrated vibrancy index, Vi, is calculated as EquationEquation (4)(4)
(4) , where vk (k = p, v) is one type of vibrancy. As weighting both the physical and the virtual vibrancy, the integrated vibrancy index represents the comprehensive intensity of human activities and interactions in both physical and virtual space.
4.2. Associated social-economical and built-environmental factors
Previous studies have revealed that urban vibrancy is associated with three categories of factors, including demographics, socioeconomics, and built environment (Zarin, Niroomand, and Heidari Citation2015; Huang et al. Citation2020). In terms of demographics and socioeconomics, the population density, the employment density and the average income are calculated in a MSSA.
The built environment is measured by land use, POI, transportation and building floor space (Tu et al. Citation2018). Using the land use map, the ratio of several typical urban land usages in a MSSA is calculated, including commercial, residential, industrial and open area. On the other hand, the influences of mixed land use on the vibrancy have long been observed. In this study, the Shannon entropy is calculated to indicate the land use mix, as estimated by EquationEquation (5)(5)
(5) , where pi is the area of the ith type of land use, including residential, commercial, industrial, or open areas.
The transportation infrastructures play an important role in the vibrancy. In general, well-connected road networks and rich public transportation service will encourage urban travels thus breed the urban vibrancy. In this study, the coverage of the road and the bus are examined. The density of the road in a MSSA, Dr, is calculated as EquationEquation (6)(6)
(6) , which denotes the ratio of total route length to the total area of a MSSA, j, Sj the area of a MSSA. The density of the bus, Ds, is calculated to represent the supply of the bus service, as EquationEquation (7)
(7)
(7) , where Ns is the number of bus stops.
Sufficient concentration of urban buildings is vital for urban vitality. The Ground Space Index (GSI) metric is utilized to describe the concentration of buildings in a MSSA. The GSI denotes the density of building footprints, as EquationEquation (8)(8)
(8) , where Sb is the total area of building footprints.
Correlated independent variables will introduce biases to the following regression analysis. To avoid potential bias, the multi-collinearity test is conducted to evaluate the correlation of independent variables. The variables with high Variance Inflation Factor (VIF) are excluded as their effects have been explained by other variables.
4.3. Spatial autocorrelation
Spatial autocorrelation measures the degree of correlation of a spatial variable to itself through space. Spatial autocorrelation has been examined by many urban studies (Diniz-Filho, Bini, and Hawkins Citation2003; Tu et al., 2019). Several indices have been proposed to measure spatial autocorrelation, such as Moran’s I, the Geary’s C (De Jong, Sprenger, and Veen Citation1984) and Getis’s G (Sawada Citation2001). Here, Moran’s I is utilized to reveal spatial autocorrelation of the vibrancy around the metro station, as EquationEquations (9)(9)
(9) -(Equation11
(11)
(11) ), where Zi denotes the deviation of the vibrancy index (Vi) to the mean vitality (
), n is the number of MSSA in a city, S0 is the sum of spatial weights, which is measured by the distance reverse weight method (Getis and Aldstadt Citation2004). The Moran’s I falls into the range of (−1,1). The Moran’s I greater than 0 suggests a positive spatial autocorrelation while the value less than 0 indicates a negative one. And the value equals 0 shows a random spatial distribution. The Moran’s I of three types of metro vitality is calculated in three cities respectively.
4.4. Regression models
The OLS is used to unravel the relationship between the dependent variables and independent variables. The OLS formula is given in EquationEquation (12)(12)
(12) , where y is the dependent variable, X is the independent variables,
,
,
are the constant, estimated coefficient of independent variables and the fitting residual respectively.
The OLS model takes the integrated vibrancy as the dependent variable. The independent variables are considered demographic, socioeconomic and built environment factors. To compare the impact on the metro vibrancy among three cities, each independent variable is normalized as the formula given by EquationEquation (2)(2)
(2) .
Spatial dependence is a common phenomenon in geographic distribution. In other words, the spatial variable at a place influences its neighbors. The OLS model neglects the spatial dependence of variables; therefore, it may overestimate the impact of considered factors. There are several geospatial regression models taking the spatial dependence into accounts, such as SLM, Spatial Error Model (SEM), Spatial Durbin model (SDM) (Elhorst Citation2014) and Geographically Weighted Regression (GWR) model (Tu et al. Citation2020). After preliminary experiments, the SLM is utilized to further reveal the impact on the metro vibrancy.
SLM takes into account the spatial dependence on dependent variables in the regression analysis. The formula of SLM is given by EquationEquation (13)(13)
(13) , where W presents the spatial weight matrix, X is the independent variables,
,
are estimated coefficients about the spatial lag term and independent variables respectively, and
is the fitting residual. In comparison to EquationEquation (12)
(12)
(12) , the effect of near the metro station on the vibrancy is considered by adding the component
. Similar to the OLS models, three SLMs are formed, in which dependent variables are the integrated vitality in each city while associated factors are derived from those highly related to independent variables, which are reported by the OLS models.
5. Results
5.1. Spatial distribution of the metro vibrancy
5.1.1. Physical vibrancy
displays the physical vibrancy in the MSSA of three cities. ) shows the cumulative frequency of the physical vibrancy. They demonstrate that the physical metro vibrancy in Shenzhen and Singapore have similar distributions: many metro stations are with higher physical vibrancies. 80% MSSAs in Shenzhen and Singapore are with physical vibrancy more than 0.7 and 20% MSSAs less than 0.7. While the distribution of the physical metro vibrancy in London is smoother. Around 40% metro stations with the physical vibrancy are less than 0.5. These distributions imply the physical vitality in the MSSA of London is less polarized
Figure 3. Physical vibrancy. Cumulative frequency: (a). Spatial distribution: (b) Shenzhen; (c) Singapore; (d) London.
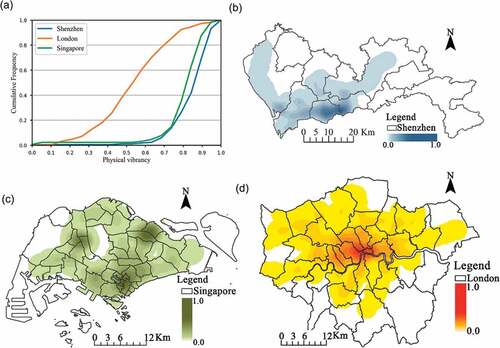
shows spatial distributions of the physical vibrancy. It should be noted that the kernel density estimation is implemented to estimate the spatial vitality around metro stations. They demonstrate a general spatial trend: the metro vibrancy decays from the urban center to the suburban area along metro lines. For example, the metro vibrancy in Shenzhen () is mainly decayed from the south to the north, as the south Shenzhen is the original SEZ while the north is the suburban area. Two physical vibrancy centers appear in Futian and Luohu, but the physical metro vibrancy in Singapore displays a typical polycentric spatial structure. Three local vibrancy centers appear in the West (Choa Chu Kang), the North-East (Sengkang) and the Central (old Gloden shoe area). In terms of London, the only center is located at the famous west end and its surrounding areas. The distribution of the physical vibrancy demonstrates a ring-shaped structure, decaying from the urban center to suburban area. The comparative results suggest that urban spatial structure could potentially impact metro vibrancy.
5.1.2. Virtual vibrancy
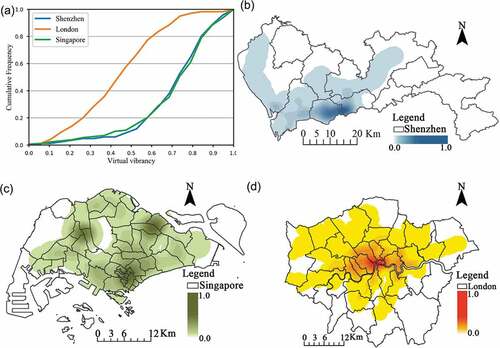
displays the spatial patterns of virtual vibrancy in the three cities. Comparing to the curves shown in ), the cumulative frequency curves of these virtual vibrancy shift to the left, indicating that more metro stations have lower vibrancy values. They indicate that more metro stations are with moderate virtual vibrancy, especially in Shenzhen and Singapore. The differences in the number of check-ins around the metro stations in these two cities become larger. But the general spatial distributions of the virtual vibrancy () is largely in line with that shown in : high vibrant MSSAs appear at the urban center and sub-centers, and low vibrant MSSAs occur at the suburban area. Especially, the spatial distribution of the virtual vibrancy in Singapore is highly consistent with its physical vibrancy. Three local virtual vibrancy centers appear in the West, the North-East and the Central respectively. Regarding Shenzhen and London, there are some differences between the physical and virtual vibrancy. Some sub hotspots of the physical vibrancy in Shenzhen disappear, i.e. a local vibrancy hotspot at the center of Shenzhen. For London, while the general spatial trend of the virtual vibrancy is similar to its physical vibrancy, some areas such as Canary Wharf show local hotspots, and the core area of high vibrant MSSA becomes smaller.
Figure 4. Virtual vibrancy. Cumulative frequency: (a). Spatial distribution: (b) Shenzhen; (c) Singapore; (d) London.
5.1.3. Integrated vibrancy
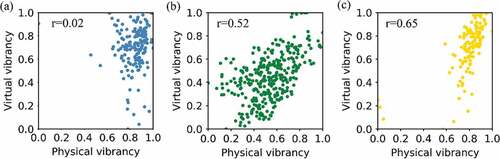
further shows the joint distribution of physical and virtual vibrancy. It demonstrates that the correlation varies from city to city. The activities in physical and virtual space in Shenzhen are quite different as the Pearson’s Correlation Coefficient is 0.02, which indicates difference preferences in physical space and social media check-in platforms. While these two types of vibrancies in Singapore and London are moderately correlated with each other as their Pearson’s Correlation Coefficient are 0.52 and 0.65 respectively. As London and Singapore are well developed, residents in these cities have similar preferences in physical space and virtual space
Figure 5. Correlation between physical vibrancy and virtual vibrancy. (a) Shenzhen; (b) Singapore; (c) London.
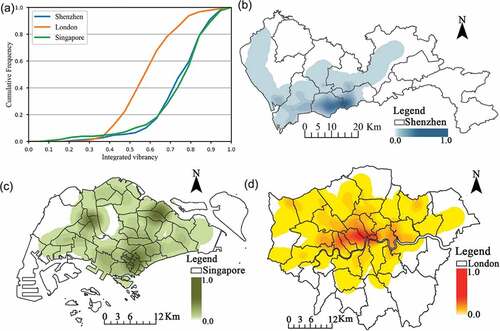
By combining the physical and the virtual vibrancy, the integrated vibrancy metrics are obtained and displayed in . The cumulative frequency suggests that the integrated vibrancy demonstrates a moderate trend between those of . Shenzhen and Singapore share a similar cumulative frequency while London is quite different. Regarding spatial distribution, the integrated vibrancy also achieves the balance between the physical and the virtual vibrancy. The integrated vibrancy metrics exhibit the spatial gradient. High vibrant metro stations appear at the urban center while low vibrant metro stations are located at the suburban area
Figure 6. The integrated vibrancy. Cumulative frequency: (a). Spatial distribution: (b) Shenzhen; (c) Singapore; (d) London.
reports the Moran’s I test results of integrated vibrancy. Spatial autocorrelation can be observed for all the z-values above 10, which corroborates the significance of the spatial auto-correlation of the metro vibrancy in . It suggests the general spatial dependency of the integrated vibrancy between near metro stations. The integrated vibrancy in London is the most spatially aggregated with the Moran’s I indicator, 0.461, while the metro vibrancies in Shenzhen and Singapore are slightly scattered, with Moran’s I indicators less than 0.4. These findings further highlight the necessity of considering the spatial dependence of near metro stations when investigating the association with the built environment.
Table 1. Moran’s I test of the integrated vibrancy
5.2. Results of the OLS model
The OLS models are implemented to explore the global relationship between the metro vibrancy and demographic, socioeconomic and built environment. The results are reported in . Income, road density, bus stop density, land use and building footprints (GSI) are significantly associated with the metro vibrancy in one or more cities. All of them are significant at the 0.05 confidence level. The AIC suggests a good association between the metro vibrancy and the aforementioned factors. In general, the reported factors explain 54.9%, 59.0%, and 74.8% of the variations of the integrated vibrancy metrics in the MSSA of Shenzhen, Singapore and London respectively.
Table 2. The results for the OLS model
Although the derived vibrancy indicators exhibit differences in terms of spatial distributions and cumulative frequency, the global regression results suggest that income is always significantly associated with the derived vibrancy in three cities, though the influence of income on the metro vibrancy differs. The results in Shenzhen and London demonstrate a positive impact of the income on vibrancy while that in Singapore show the opposite. It may be due to the fact that the high-income population in Shenzhen and London travel more by metro. On the other hand, MSSAs with high income usually have rich amenities thus attracting many visitations.
The remaining associated factors, including multi-type land use (commercial, residential, and industrial land use), land use mix, road density, bus stop density and building footprints have influences on the vibrancy metrics in one or two cities. For example, the road density and the industrial land are only significantly associated with the integrated vibrancy metric in Shenzhen, in line with the history of Shenzhen as a fast-developing industrial city. The residential land is highly correlated with the integrated vibrancy metric in Singapore. It somewhat proves the success of transit-oriented urban planning in this city while the bus stop has a great influence on the vibrancy metric in London, which implies the good inter-connectivity of bus routes and the metro network in this city.
Three factors have great influences on the two cities. The commercial land has a positive effect on the vibrancy in Singapore but the negative effect on that in London, which emphasizes the importance of the commercial activities in these two cities. Land use mix is demonstrated with the positive influences on the integrated metro vibrancy metrics in Shenzhen and Singapore, which is in line with previous studies (Jacob Citation1961). The building footprints (GSI) are significantly associated with the vibrancy metrics in Shenzhen and London.
Above all, these results demonstrate that the associations between metro vibrancy and related factors differentiate in different cities because of different urban contexts and social-economic structures.
5.3. Results of spatial lag model
Compared to the OLS models, the SLM deals with the influences of near metro stations. reports the estimated coefficients of the independent variables and fitting degrees reported by the SLMs. The R2 suggests that 59.5%, 62.9% and 79.9% of the variations of the integrated vibrancy metrics in Shenzhen, Singapore and London can be explained by the associated factors; these results are 4.2%, 3.9% and 5.1%, higher than those of the corresponding OLS models. The AIC values in the three SLM are lower than those of the above OLS models. These outcomes verify the better explanatory power of the SLMs. Hence, the SLM is able to reveal the effect of the spatially auto-correlated variable.
Table 3. The results for spatial lag models
The coefficients of the spatial lag component demonstrate the positive influences of near metro stations on the integrated vibrancy metrics. The coefficients of spatial lag component are 0.274, 0.343 and 0.429 in Shenzhen, Singapore and London respectively. It demonstrates that the vibrancy around the metro station will spill out the influence out their service area. That is because the MSSAs in high-density cities like Shenzhen, Singapore and London usually overlay with each other, for example, the CBD in three cities are clustered with many stations. Therefore, vibrant MSSAs breed the vitality of near metro stations in all three cities. It further inspires us that fostering the metro vibrancy will have a systematic effect on the whole metro system.
By comparing corresponding coefficients of factors, it further reveals that the influences of other associated factors reported by the SLM are less than those reported by the OLS models. For example, the absolute value of the income’s coefficient is 0.138, 0.11 and 0.094 in the SLM of Shenzhen, Singapore and London while 0.160, 0.134 and 0.169 in the corresponding OLS models. The coefficients of other factors also suggest a similar trend. These values verify the good explanatory of the SLM.
6. Discussion
6.1. The association of metro vibrancy and built environment
This study examines the metro vibrancy in three worldwide cities, including Shenzhen, Singapore and London. The results demonstrate that the income, road density, industrial land, land use mix and GSI are significantly associated with the metro vibrancy in Shenzhen, which partially agree with the case of the urban vibrancy in Shenzhen (Yue et al. Citation2017; Tu et al. Citation2020). As the metro system mainly covers the residential neighborhoods and industrial parks, the income and the industrial land are significantly associated with the metro vibrancy rather than the whole urban vibrancy. This difference emphasizes the heterogeneity of spatial vitality in the city. The metro provides the essential travel service for commuters therefore, their vibrancy is highly impacted by the characteristics of commuters.
The found association of the metro vibrancy with local built environment is in line with some previous studies related to the metro ridership (Gutiérrez, Cardozo, and García-Palomares Citation2011; Zhao et al. Citation2013; Chakour and Eluru Citation2016). But the association differs from cities to cities, as Montreal, Nanjing and Madrid demonstrate that social-economical factors and transportation facilities, i.e. employment, bus stops, number of metro stations and suburban bus lines, have great influences on bus or metro ridership. This may be due to the additional virtual vibrancy by considering human activities in virtual space.
6.2. Implications for fostering the metro vibrancy
Vibrant urban space, such as streets and metro areas, benefits human well-being by improving urban living experience. Understanding the interactions between metro vibrancy and built-environment inspires us to foster metro vibrancy. This empirical study in Shenzhen, Singapore and London suggests that:
Transportation. Building more roads will improve the metro vibrancy as the results in Shenzhen indicate. On the other hand, providing bus services around the metro station also breeds the metro vibrancy by bringing more people to the MSSA. This is due to the fact that convenient transportation always stimulates human travels, therefore, increasing human activities and interactions in the MSSA.
Land use. Results in Singapore demonstrate that increasing commercial and residential land will improve the metro vibrancy as the metro is the backbone transportation infrastructure for commuting travels. More commercial and residential land parcels around metro stations tend to increase shopping activities and interactions. The results in London and Shenzhen suggest that MSSA dominated by one single or two land use types, such as commercial and/or industrial land, tend to have lower metro vibrancy. Last, similar to the suggestion of Jacob (Citation1961), increasing the land use mix will increase human interaction, therefore, breed the metro vibrancy.
Amenities. Amenities such as POIs and buildings play a key role in facilitating daily human activities. i.e. housing building and shopping malls. More buildings do improve the density of human activities and interactions, which is also indicated by the results in Shenzhen and London.
On the other hand, many empirical studies have been conducted to investigate the relationship between the built environment and urban vibrancy by taking one city as a case study, such as Yue et al. (Citation2017) and Ye et al. (2018). These studies provide useful insights into quantifying urban vibrancy and unveiling the influences on it. In general, these results can be helpful to the policy-making for urban governors and planning. However, straightforward transferring the obtained knowledge of urban vibrancy from one city to another may be not right. Although this comparative studies in three global cities suggest some universal patterns between metro vibrancy and urban contexts, it is clear that the significant associated factors vary from city to city. Although the knowledge in one city can provide valuable insights into another city, it is not reasonable to transfer the knowledge of one city to another city straightforwardly without the adjustment according to the spatial and social context.
7. Conclusion
Revitalizing urban areas around metro stations is of importance for urban transformation. To date, limited studies have been devoted to empirically exploring the pattern of the metro vibrancy and its association with built environment. This study presents a multisource urban data-driven approach to quantify the metro vibrancy and unravel the influences of built environment. Massive smart card data is processed to extract metro ridership, which denotes the physical vibrancy of metros. Social media check-ins are used to measure the vitality of metros at virtual space. Both physical and virtual vibrancies are integrated into the integrated vibrancy with the entropy-based weighting method. The built environment, including land use, transportation and buildings are modeled as independent variables. The significant associated factors are unveiled with the SLM by considering the spatial dependence of the metro vibrancy. Case studies are conducted in three global cities, namely Shenzhen, London and Singapore.
The results demonstrate metro vibrancy metrics are highly spatially auto-correlated. The metro vibrancy is high in the urban center and low in suburban area. The results of the OLS and the SLM suggest built environmental factors including road density, bus stop density, land use and building footprints (GSI) have great influences on the integrated vibrancy metrics in one or two cities. But the influences depend on the city for different urban contexts. These findings help us understand metro vibrancy thus benefit the policy-making to foster the vibrancy around metros stations in the future.
This study makes the following contributions: (1) the metro vibrancy is measured using both smart card data and social media check-ins, which produces a comprehensive and multi-facet portrait of the metro vibrancy. (2) A comparative framework is developed to examine the association between the metro vibrancy and associated built environmental factors. Their commonality and differences in the three cities are identified. The proposed comparative framework has significant potential for evaluating other urban concepts, such as urban resilience and urban innovation. (3) The effects of associated factors on the metro vibrancy can be used to evaluate the vitality of the metro and identify appropriate design interventions in an evidence-based manner.
This study still leaves room for explorations. In the future, field survey will be conducted in several metro stations in three cities to validate the measured metro vibrancy metrics derived from multi-source urban data. Second, because of the availability of urban datasets, only the core but a small set of built-environmental factors is considered. More data will be collected and more independent variables will be taken into consideration.
Disclosure statement
No potential conflict of interest was reported by the author(s).
Data availability statements
The data that support the findings of this study are available from the Commission of Shenzhen Transportation, but restrictions apply to the availability of these data, which were used under license for the current study, and so are not publicly available. Data are however available from the authors upon reasonable request and with permission of the Commission of Shenzhen Transportation.
Additional information
Funding
Notes on contributors
Wei Tu
Wei Tu is currently an Associate Professor with the Department of Urban Informatics, Shenzhen University. He is also a Visiting Scholar with the Senseable City Laboratory, Massachusetts Institute of Technology. His research interests include urban informatics, smart mobility, urban spatial intelligence.
Tingting Zhu
Tingting Zhu received the M.S. degree from Shenzhen University. Her research interests include big spatial data analytic and smart transportation.
Chen Zhong
Chen Zhong is an Associate Professor in Urban Analytics at the Centre for Advanced Spatial Analysis. She received the PhD degree from ETH Zurich. Her research interests are spatial data analysis, machine learning, urban modeling, and data-driven methods for urban and transport planning.
Xiaohu Zhang
Xiaohu Zhang is currently an Assistant Professor with the Department of Urban Planning and Design, Faculty of Architecture, The University of Hong Kong. Prior to this, he worked with Singapore-MIT Alliance for Research and Technology, the MIT Senseable City Laboratory, and Sun Yat-Sen University. His scholarship bridges the information gap in sustainable urban and transportation policy-making with stochastic simulation and big data analytics. Broadly interested in urban data science, his recent work explores the sustainability of new shared mobility services, such as scooter sharing, carsharing, and ridesharing. His research uses multi-source datasets to advance understanding of pressing urban and transportation issues, e.g., urban expansion, emerging mobility services, and the interactions between land use and transportation.
Yang Xu
Yang Xu received the PhD degree in geography from The University of Tennessee, Knoxville, in 2015. He is currently an Assistant Professor with the Department of Land Surveying and Geo-Informatics, The Hong Kong Polytechnic University. His research interests include GIScience, human mobility, and urban informatics.
Qingquan Li
Qingquan Li received the PhD degree in geographic information system and photogrammetry from Wuhan Technical University of Surveying and Mapping in 1998. He is currently a Professor with Shenzhen University, and Wuhan University. His research areas include 3-D and dynamic data modeling in GIS, location-based service, surveying engineering, integration of GIS, global positioning system and remote sensing, intelligent transportation system, and road surface checking.
Notes
1. Ordnance Survey (OS) website, https://www.ordnancesurvey.co.uk/, accessed in June 2019.
References
- Aiello, L. M., R. Schifanella, D. Quercia, F. Aletta, B. Labs, and D. Quercia. 2016. “Chatty Maps: Constructing Sound Maps of Urban Areas from Social Media Data.” Royal Society Open Science 3 (3): 1–19. doi:10.1098/rsos.150690.
- Best, K., and S. Butler. 2015. “Virtual Space: Creating a Place for Social Support in Second Life.” Space and Culture 18 (2): 183–197. doi:10.1177/1206331213512235.
- Ceapa, I., C. Smith, and L. Capra. 2012. “Avoiding the Crowds: Understanding Tube Station Congestion Patterns from Trip Data.” Paper presented at the Proceedings of the ACM SIGKDD International Conference on Knowledge Discovery and Data Mining, Beijing, China, 134–141. doi: 10.1145/2346496.2346518
- Chakour, V., and N. Eluru. 2016. “Examining the Influence of Stop Level Infrastructure and Built Environment on Bus Ridership in Montreal.” Journal of Transport Geography 51: 205–217. doi:10.1016/j.jtrangeo.2016.01.007.
- Chen, T., E. C. M. Hui, J. Wu, W. Lang, and X. Li. 2019. “Identifying Urban Spatial Structure and Urban Vibrancy in Highly Dense Cities Using Georeferenced Social Media Data.” Habitat International 89: 102005. doi:10.1016/j.habitatint.2019.102005.
- De Jong, P., C. Sprenger, and F. V. Veen. 1984. “On Extreme Values of Moran’s I and Geary’s C.” Geographical Analysis 16 (1): 17–24. doi:10.1111/j.1538-4632.1984.tb00797.x.
- De Nadai, M., J. Staiano, R. Larcher, N. Sebe, D. Quercia, and B. Lepri. 2016. “The Death and Life of Great Italian Cities: A Mobile Phone Data Perspective.” Paper presented at the International World Wide Web Conferences, Montréal Québec, Canada, 413–423. doi: 10.1145/2872427.2883084
- Diniz-Filho, J. A. F., L. M. Bini, and B. A. Hawkins. 2003. “Spatial Autocorrelation and Red Herrings in Geographical Ecology.” Global Ecology and Biogeography 12 (1): 53–64. doi:10.1046/j.1466-822X.2003.00322.x.
- Elhorst, J. P. 2014. “Matlab Software for Spatial Panels.” International Regional Science Review 37 (3): 389–405. doi:10.1177/0160017612452429.
- Fang, Z., S. L. Shaw, W. Tu, Q. Li, and Y. Li. 2012. “Spatiotemporal Analysis of Critical Transportation Links Based on Time Geographic Concepts: A Case Study of Critical Bridges in Wuhan, China.” Journal of Transport Geography 23: 44–59. doi:10.1016/j.jtrangeo.2012.03.018.
- Getis, A., and J. Aldstadt. 2004. “Constructing the Spatial Weights Matrix Using a Local Statistic.” Geographical Analysis 36 (2): 90–104. doi:10.1111/j.1538-4632.2004.tb01127.x.
- González, M. C., C. A. Hidalgo, and A.-L. Barabási. 2008. “Understanding Individual Human Mobility Patterns.” Nature 453 (7196): 779–782. doi:10.1038/nature06958.
- Goulet-Langlois, G., H. N. Koutsopoulos, Z. Zhao, and J. Zhao. 2018. “Measuring Regularity of Individual Travel Patterns.” IEEE Transactions on Intelligent Transportation Systems 19 (5): 1583–1592. doi:10.1109/TITS.2017.2728704.
- Gutiérrez, J., O. D. Cardozo, and J. C. García-Palomares. 2011. “Transit Ridership Forecasting at Station Level: An Approach Based on Distance-decay Weighted Regression.” Journal of Transport Geography 19 (6): 1081–1092. doi:10.1016/j.jtrangeo.2011.05.004.
- Hasan, S., X. Zhan, and S. V. Ukkusuri. 2013. “Understanding Urban Human Activity and Mobility Patterns Using Large-scale Location-based Data from Online Social Media.” Paper presented at the Proceedings of the 2nd ACM SIGKDD International Workshop on Urban Computing, Chicago, USA. ACM, 6. doi: 10.1145/2505821.2505823
- Huang, B., and J. H. Wang. 2020. “Big Spatial Data for Urban and Environmental Sustainability.” Geo-spatial Information Science 23 (2): 125–140. doi:10.1080/10095020.2020.1754138.
- Huang, B., Y. L. Zhou, Z. Li, Y. Song, J. Cai, and W. Tu. 2020. “Evaluating and Characterizing Urban Vibrancy Using Spatial Big Data: Shanghai as a Case Study.” Environment and Urban Planning B: Urban Analytics and City Science 47 (9): 1543–1559. doi:10.1177/2399808319828730.
- Huang, S.-L., J.–H. Wong, and T.–C. Chen. 1998. “A Framework of Indicator System for Measuring Taipei’s Urban Sustainability.” Landscape and Urban Planning 42: 15–27. doi:10.1016/S0169-2046(98)00054-1.
- Jacob, J. 1961. The Life and Death of Great American Cities. New York: Random House.
- Jacobs-Crisioni, C., P. Rietveld, E. Koomen, and E. Tranos. 2014. “Evaluating the Impact of Land-use Density and Mix on Spatiotemporal Urban Activity Patterns: An Exploratory Study Using Mobile Phone Data.” Environment & Planning A 46 (11): 2769–2785. doi:10.1068/a130309p.
- Kusakabe, T., and Y. Asakura. 2014. “Behavioral Data Mining of Transit Smart Card Data: A Data Fusion Approach.” Transportation Research Part C: Emerging Technologies 46: 179–191. doi:10.1016/j.trc.2014.05.012.
- Lansley, G., and P. A. Longley. 2016. “The Geography of Twitter Topics in London.” Computers, Environment and Urban Systems 58: 85–96. doi:10.1016/j.compenvurbsys.2016.04.002.
- Li, C., M. Wang, J. Wang, and W. Wu. 2016. “The Geography of City Liveliness and Land Use Configurations: Evidence from Location-based Big Data in Beijing.” Paper presented at the Spatial Economics Research Centre, London, UK. LSE. https://EconPapers.repec.org/RePEc:cep:sercdp:0201
- Li, D., W. Guo, X. Chang, and X. Li. 2020. “From Earth Observation to Human Observation: Geocomputation for Social Science.” Journal of Geographical Sciences 30 (2): 233–250. doi:10.1007/s11442-020-1725-8.
- Liu, L., B. Zhou, J. Zhao, and B. D. Ryan. 2016. “C-IMAGE: City Cognitive Mapping through Geo-tagged Photos.” GeoJournal 81 (6): 817–861. doi:10.1007/s10708-016-9739-6.
- Lock, O., and C. Pettit. 2020. “Social Media as Passive Geo-participation in Transportation Planning – How Effective are Topic Modeling & Sentiment Analysis in Comparison with Citizen Surveys?” Geo-spatial Information Science 23 (4): 275–292. doi:10.1080/10095020.2020.1815596.
- Lynch, K. 1984. Good City Form. Boston, USA: MIT press.
- Martí, P., L. Serrano-Estrada, and A. Nolasco-Cirugeda. 2017. “Using Locative Social Media and Urban Cartographies to Identify and Locate Successful Urban Plazas.” Cities 64: 66–78. doi:10.1016/j.cities.2017.02.007.
- Monika, S. 2020. “Analysis of Mobility Data – A Focus on Mobile Mapping Systems.” Geo-spatial Information Science 23 (1): 68–74. doi:10.1080/10095020.2020.1730713.
- Montgomery J (1998) Making a city: Urbanity, vitality and urban design, Journal of Urban Design, 3:(1), 93–116, DOI: 10.1080/13574809808724418
- Morency, C., M. Trepanier, and B. Agard. 2008. “Analysing the Variability of Transit Users Behaviour with Smart Card Data.” Paper presented at the IEEE Intelligent Transportation Systems Conference, Beijing, China, 44–49. doi: 10.1109/ITSC.2006.1706716
- Nicodemus, A. G. 2013. “Fuzzy Vibrancy: Creative Placemaking as Ascendant US Cultural Policy.” Cultural Trends 22 (3–4): 213–222. doi:10.1080/09548963.2013.817653.
- Pelletier, M. P., M. Trépanier, and C. Morency. 2011. “Smart Card Data Use in Public Transit: A Literature Review.” Transportation Research Part C: Emerging Technologies 19 (4): 557–568. doi:10.1016/j.trc.2010.12.003.
- Sawada, M. 2001. Global Spatial Autocorrelation indices-Moran’s I, Geary’s C and the General Cross-product Statistics. Mimeo: Laboratory of Paleoclimatology and Climatology, Dept. Geography, University of Ottawa.
- Shaw, S. L., and D. Sui. 2018. Human Dynamic Research in Smart and Connected Communities. Springer, Cham.
- Shen, Y., and K. Karimi. 2016. “Urban Function Connectivity: Characterisation of Functional Urban Streets with Social Media Check-in Data.” Cities 55: 9–21. doi:10.1016/j.cities.2016.03.013.
- Song, Y., L. Merlin, and D. Rodriguez. 2013. “Comparing Measures of Urban Land Use Mix.” Computers, Environment and Urban Systems 42: 1–13. doi:10.1016/j.compenvurbsys.2013.08.001.
- Sulis, P., E. Manley, C. Zhong, and M. Batty. 2018. “Using Mobility Data as Proxy for Measuring Urban Vitality.” Journal of Spatial Information Science 16: 137–162. doi:10.5311/JOSIS.2018.16.384.
- Sung, H.–G., D.-H. Go, and C. G. Choi. 2013. “Evidence of Jacobs’s Street Life in the Great Seoul City: Identifying the Association of Physical Environment with Walking Activity on Streets.” Cities 35: 164–173. doi:10.1016/j.cities.2013.07.010.
- Tu, W., J. Cao, Y. Yue, S. L Shaw, M. Zhou, Z. Wang, Y. Xu, and Q. Li. 2017. “Coupling Mobile Phone and Social Media Data: A New Approach to Understanding Urban Functions and Diurnal Patterns.” International Journal of Geographical Information Science 31 (12): 2331–2358. doi:10.1080/13658816.2017.1356464.
- Tu, W., R. Cao, Y. Yue, B. Zhou, Q. Li, and Q. Li. 2018. “Spatial Variations in Urban Public Ridership Derived from GPS Trajectories and Smart Card Data.” Journal of Transport Geography 69 (3688): 45–57. doi:10.1016/j.jtrangeo.2018.04.013.
- Tu, W., T. Zhu, J. Xia, Y. Zhou, Y. Lai, J. Jiang, and Q. Li. 2020. “Portraying the Spatial Dynamics of Urban Vibrancy Using Multisource Urban Big Data.” Computer Environment and Urban Systems 80 (101428): 101428. doi:10.1016/j.compenvurbsys.2019.101428.
- Wu, C., X. Ye, F. Ren, and Q. Du. 2018a. “Check-in Behaviour and Spatio-temporal Vibrancy: An Exploratory Analysis in Shenzhen, China.” Cities 77: 104–116. doi:10.1016/j.cities.2018.01.017.
- Wu, J., N. Ta, Y. Song, J. Lin, and Y. Chai. 2018b. “Urban Form Breeds Neighborhood Vibrancy: A Case Study Using A GPS-based Activity Survey in Suburban Beijing.” Cities 74: 100–108. doi:10.1016/j.cities.2017.11.008.
- Xu, Z., Y. Liu, N. Yen, L. Mei, X. Luo, X. Wei, and C. Hu. 2016. “Crowdsourcing Based Description of Urban Emergency Events Using Social Media Big Data.” IEEE Transactions on Cloud Computing 7161 (c): 1. doi:10.1109/TCC.2016.2517638.
- Yu, H. B., and S. L. Shaw. 2008. “Exploring Potential Human Activities in Physical and Virtual Spaces: A Spatio‐temporal Gis Approach.” International Journal of Geographical Information Systems 22 (4): 22. doi:10.1080/13658810701427569.
- Yue, Y., Y. Zhuang, A. G. J. Xie, C. Ma, and Q. Lin. 2017. “Measurements of POI-based Mixed Use and Their Relationships with Neighbourhood Vibrancy.” International Journal of Geographical Information Science 31: 658–675. doi:10.1080/13658816.2016.1220561.
- Zarin, S. Z., M. Niroomand, and A. A. Heidari. 2015. “Physical and Social Aspects of Vitality Case Study: Traditional Street and Modern Street in Tehran.” Procedia - Social and Behavioral Sciences 170: 659–668. doi:10.1016/j.sbspro.2015.01.068.
- Zhang, X., Y. Xu, W. Tu, and C. Ratti. 2018. “Do Different Datasets Tell the Same Story about Urban Mobility — A Comparative Study of Public Transit and Taxi Usage.” Journal of Transport Geography 70 (May): 1–23. doi:10.1016/j.jtrangeo.2018.05.002.
- Zhang, Y., Q. Li, W. Tu, K. Mai, Y. Yao, and Y. Chen. 2019. “Functional Urban Land Use Recognition Integrating Multi-source Geospatial Data and Cross-correlations.” Computers, Environment and Urban Systems 78: 101374. doi:10.1016/j.compenvurbsys.2019.101374.
- Zhao, J., W. Deng, Y. Song, and Y. Zhu. 2013. “What Influences Metro Station Ridership in China? Insights from Nanjing.” Cities 35: 114–124. doi:10.1016/j.cities.2013.07.002.
- Zhao, Z., H. N. Koutsopoulos, and J. Zhao. 2018. “Detecting Pattern Changes in Individual Travel Behavior: A Bayesian Approach.” Transportation Research Part B: Methodological 112: 73–88. doi:10.1016/j.trb.2018.03.017.
- Zheng, S., X. Hu, J. Wang, and R. Wang. 2016. “Subways near the Subway: Rail Transit and Neighborhood Catering Businesses in Beijing.” Transport Policy 51: 81–92. doi:10.1016/j.tranpol.2016.03.008.
- Zhong, C., M. Batty, E. Manley, J. Wang, Z. Wang, F. Chen, and G. Schmitt. 2016. “Variability in Regularity: Mining Temporal Mobility Patterns in London, Singapore, and Beijing Using Smart-card Data.” PLoS ONE 11 (2): 1–17. doi:10.1371/journal.pone.0149222.
- Zhu, Y., and J. Ferreira. 2015. “Data Integration to Create Large-Scale Spatially Detailed Synthetic Populations.” Planning Support Systems and Smart Cities. Springer, Cham. 121–141. doi:10.1007/978-3-319-18368-8_7.
- Zielstra, D., and H. H. Hochmair. 2011. “Comparative Study of Pedestrian Accessibility to Transit Stations Using Free and Proprietary Network Data.” Transportation Research Record: Journal of the Transportation Research Board 2217 (1): 145–152. doi:10.3141/2217-18.