
 ?Mathematical formulae have been encoded as MathML and are displayed in this HTML version using MathJax in order to improve their display. Uncheck the box to turn MathJax off. This feature requires Javascript. Click on a formula to zoom.
ABSTRACT
The importance of irrigation development is considered a key factor for food security and poverty reduction because it improves crop productivity, and ensures stable expansion of agricultural production. However, irrigation development requires understanding of the available resources including the suitability of the land for agriculture. In this study, the land suitability for paddy fields was evaluated within the United Republic of Tanzania mainland by integrating the geographic information system (GIS) and analytical hierarchy process (AHP). In this study, 11 criteria based on various sources (soil type, soil drainage, soil organic carbon, soil pH, soil depth, elevation, slope, land use, topographic wetness index, temperature, and precipitation) were used. These criteria were used within the GIS-based AHP to identify the most suitable land for sustainable paddy field cultivation considering the preservation of the natural environment of forests and protected areas by examining two scenarios: rainfed condition and irrigation priority. The former ten criteria were assumed to be constant in both scenarios and were assigned the same scores, while the latter criterion (precipitation) was assigned different scores for varying amounts to plan new irrigation projects. Unsuitable land represents 72.8% of the study area, reducing the potential agriculture land (PAL) appropriate for cultivation to 27.2%. In the rainfed condition scenario, the very high and high suitability classes represent 17.6% of the total land of the study area and 64.7% of the PAL. In the irrigation priority scenario, the same classes represent 21.4% of the total land of the study area and 78.6% of the PAL. Finally, the distribution of the land suitability for both scenarios was analyzed within eight administrative irrigation zones to determine the irrigation zone with the greatest potential for paddy field cultivation.
1. Introduction
Sustainable agricultural development based on the effective use of available resources is important for both current and future generations (HLPE Citation2016; Akpoti, Kabo-bah, and Zwart Citation2019). The United Republic of Tanzania (hereafter Tanzania) is rich in natural resources, hosting six of the 25 global biodiversity hotspots (Rosa, Rentsch, and Hopcraft Citation2018; DOE Citation2014). Tanzania’s economy greatly depends on agricultural activities, for example crop production and livestock, fisheries and forestry represent 23% of the national Gross Domestic Product (GDP) (NBS Citation2014). However, the agricultural practices are not well expanded in Tanzania as only ~6% of the agricultural land is cultivated and the shifting of cultivation leads to deforestation and land degradation of pastoral land (MoA Citation2017). The total area of forest loss in Tanzania from 2010 to 2017 is 3.9 million hectares (M ha) with 89% of deforestation attributable to crop cultivation (Doggart et al. Citation2020). Tanzania is not the only country that uses deforestation as an agricultural practice. Recent data indicate a global decrease in the forest cover of 3% from 4128 M ha to 3999 M ha between 1990 and 2015 (Keenan et al. Citation2015), while the agricultural land increased (FAO Citation2003) to meet the growing demand for agricultural products (DeFries et al. Citation2010). Therefore, it is critical to establish sustainable agriculture while preserving the environment in Tanzania. However, achieving sustainable agriculture is a complex process that requires the management of available land resources, water resources, and target crops. Thus, agricultural Land Suitability (LS) assessment is an essential component for sustainable agricultural development (Akpoti, Kabo-bah, and Zwart Citation2019), especially if it is applied in a challenging environment, such as in Tanzania, where protected areas cover one third of the country (WDPA; UNEP-WCMC and IUCN Citation2017).
The agricultural LS analysis requires the integration of many factors into one system. The Geographic Information System (GIS) has the capability to handle and simulate the necessary data gathered from various sources. The GIS combines spatial data (maps, aerial photographs, and satellite images) with quantitative, qualitative, and descriptive information databases, and thus can support a wide range of spatial queries (Al-Hanbali, Alsaaideh, and Kondoh Citation2011). All these factors have made GIS an essential tool for location and LS studies (Murray Citation2010; Church Citation2002), as well as for decision makers (Carver Citation1991). One of the techniques regularly implemented in the GIS environment is multi-criteria evaluation (MCE). The MCE can be used to inventorise, classify, analyze, and arrange available information concerning choices–possibilities in regional planning (Voogd Citation1982). It is primarily used to determine how the information from several criteria can be combined to form a single index of evaluation. The Analytical Hierarchy Process (AHP) method is one of the MCE approaches introduced by Saaty (Citation1977). The success of implementing the AHP method in various domains and its ease of use have made AHP an excellent method for decision making (Ho Citation2008). The AHP method has been used for flood vulnerability assessment (Ouma and Tateishi Citation2014), landfill site selection (Şener et al. Citation2010), drought risk assessment (Palchaudhuri and Biswas Citation2016), solar plant site selection (Ozdemir and Sahin Citation2018), and agricultural LS analysis (Pramanik Citation2016).
Several studies have been conducted to assess the suitability of land for certain types of agricultural crops, such as rice (Kihoro, Bosco, and Murage Citation2013; Raza et al. Citation2018; Perveen et al. Citation2007), tea crops (Li et al. Citation2012), coffee crops (Mighty Citation2015), silage corn (Houshyar et al. Citation2014), citrus (Zabihi et al. Citation2015), durum wheat (Mendas and Delali Citation2012), and tobacco (Zhang et al. Citation2015). In other studies, the suitability of land for the use of a broad range of agricultural crops has been analyzed, for example, dry farms and irrigated crops (Feizizadeh and Blaschke Citation2013) or cropland areas (Khoi and Murayama Citation2010). Other researchers generally assessed the suitability of land without linking it to any type of agricultural crop (Akıncı, Özalp, and Turgut Citation2013; Bozdağ, Yavuz, and Dönertaş Citation2016).
This LS study is part of a larger project; the review of the National Irrigation Master Plan conducted by the Japan International Cooperation Agency (JICA) covering the mainland of Tanzania (JICA Citation2018). The analysis of potential irrigation development areas was carried out in the master plan taking into consideration the water allocation for irrigation, the irrigation water balance, the LS, and the irrigation schemes proposed for development. The LS analysis was performed on two types of crops: paddy fields (i.e. rice crops) and horticultural crops (e.g. fruits and vegetables). A paddy field is a type of crop with low production cost, low labor intensity, and low-price volatility; thus, the risks and yield are low. Conversely, horticultural crops have high production costs, high labor intensity, and a high price volatility; therefore, the risk and return are high (JICA Citation2018). The Master Plan study included both options to aid the Tanzanian government in making the right decision for planning future irrigation projects. However, the assessment of the LS varies for both types of crops. In the present study, the focus is placed on the assessment of the LS for paddy fields without taking into consideration the availability of water resources because it is covered in detail in the master plan study.
This study focuses on planning, and demonstrates the efficiency of the AHP in determining lands suitable for sustainably cultivating paddy fields. Therefore, the main objectives of this study are: 1) to identify the most suitable land for sustainable paddy field cultivation considering the preservation of the natural environment of forests and protected areas, and 2) to demonstrate how the use of the AHP method can help decision makers in planning. To achieve these goals, the AHP was used to examine two scenarios: rainfed condition and irrigation priority. Both scenarios predominantly depend on the precipitation distribution and different scores are assigned to varying precipitation ranges to plan future irrigation projects.
2. Study area
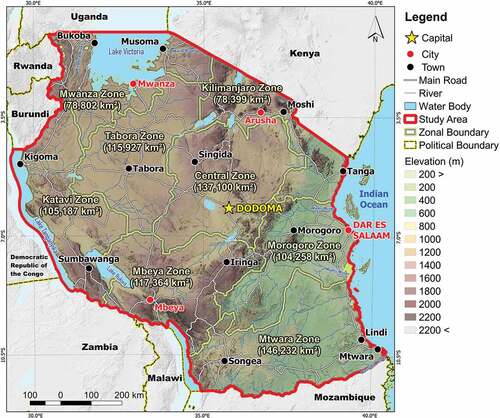
The study area, as shown in , comprises the mainland of Tanzania, which covers an area of 937,561 km2. It borders Uganda to the north; Kenya to the northeast; the Indian Ocean to the east; Mozambique and Malawi to the south; Zambia to the southwest; and Rwanda, Burundi, and the Democratic Republic of the Congo to the west. The study area comprises eight irrigation zones, that is, Central, Katavi, Kilimanjaro, Mbeya, Morogoro, Mtwara, Mwanza, and Tabora. These irrigation zones are administrative boundaries managed by the National Irrigation Commission (NIRC), which is an independent governmental department under the Ministry of Water and Irrigation that is responsible for the irrigation in the country (JICA Citation2018). The largest irrigation zone is the Mtwara zone with an area of 146,232 km2 and the smallest zone is the Kilimanjaro zone with an area of 78,399 km2.
Figure 1. The study area includes the mainland of Tanzania and comprises eight irrigation zones.
Based on Climate Hazards Group InfraRed Precipitation (CHIRP) version 2 data provided by the Climate Hazard Group (CHG; Funk et al. Citation2015), the average annual rainfall in the study area from 1981 to 2016 is 971 mm/yr, with a maximum of 2427 mm/yr and a minimum of 349 mm/yr. The average annual temperature in the study area for the period from 1970 to 2000 is 22°C based on WorldClim 2 data (Fick and Hijmans Citation2017), with a minimum temperature of −5°C and a maximum temperature of 30°C.
Topographic information was obtained from the Digital Elevation Model (DEM) acquired by the Shuttle Radar Topography Mission (SRTM) of the National Geospatial–Intelligence Agency (NGA Citation2020). The SRTM data show that the elevation of the study area ranges from −5 m above sea level along the shoreline to 5875 m above sea level at Mount Kilimanjaro. The slope angle ranges from 0° to 82°, with an average slope of 3°.
Compared with East African countries, Tanzania has the largest number of protected areas with the highest overall areal extent (Riggio et al. Citation2019). Based on the information obtained from the World Database on Protected Areas (WDPA; UNEP-WCMC and IUCN Citation2017), 34% of the study area falls within protected areas.
There are four main crops in Tanzania: maize, rice, oilseeds/pulses, and vegetables. The production of maize and rice was increased in the last 50 years, reaching ~1.5 and 2.0 t/ha for maize and rice, respectively. The production of the other two crops in general remains below 1.0 t/ha (MoA Citation2017).
3. Methodology
The successful use of the GIS relies on the ability to access quality data in appropriate quantities, representing various layers used to recreate relevant real-world conditions. The data availability and accuracy significantly affect the results of any analysis. Therefore, significant efforts must be made to completely and regularly review necessary GIS datasets. The methodology is divided into three sub methods: background of the AHP method, LS for paddy fields based on the AHP and GIS, and identification of potential agricultural land.
3.1. Background of the AHP method
The AHP method is one of the MCE and decision-making approaches introduced by Saaty (Citation1977). In the AHP method, complex problems are hierarchically structured into criteria, subcriteria, and alternatives based on which a choice is made (Saaty Citation1987). This method allows users to determine the weights of the parameters in the solution of a multi-criteria problem. To evaluate the criteria included in a level compared with other criteria included in the next hierarchy level, a scale ranking is performed by utilizing the preference scale presented by Saaty (Citation1977), as illustrated in . The pairwise comparison matrix relies on the judgment of experts to derive priority scales.
Table 1. Scale and its description (Saaty Citation1977).
The AHP provides mathematical measures to determine the consistency of the judgment matrix. Based on the properties of the matrix, a consistency ratio can be calculated. In a matrix, the largest eigenvalue (λmax) is always greater than or equal to the number of rows or columns. The consistency index that measures the consistency of pairwise comparisons can be written as (Saaty Citation1977):
Table 2. Random index (RI) table (Saaty Citation1994).
where CR is the consistency ratio, CI is the consistency index, and RI is the random index. A consistency ratio coefficient of less than 0.1 indicates positive evidence for informed judgment.
In LS analysis, the subcriterion is classified into five classes ranging from 1 to 5 based on its suitability for agricultural land. A score of 1 indicates the smallest suitability, while a score of 5 indicates the highest suitability. Because the input parameters were collected from different sources, standardization to a scale from 1 to 5 is an essential step to combine various parameters and obtain meaningful results. The LS was calculated using the following equation
where LS is the land suitability, Wi denotes the weight of the selected land suitability criteria, Xi indicates the assigned subcriteria scores of i land suitability criteria, and n is the total number of LS criteria.
Several criteria that can be considered for the LS for agriculture. In this study, 11 criteria were considered, as shown in .
Table 3. List of criteria used for the land suitability assessment and their sources.
3.2. Land suitability for paddy fields
A GIS-based MCE technique using AHP analysis examines a number of possible choices for a LS problem considering multiple criteria and conflicting objectives. To use the GIS for the LS assessment, data were obtained from different sources, as shown in , and stored in the GIS system. In this study, two scenarios were considered for the LS for paddy fields: rainfed conditions and irrigation priority. Eleven criteria were considered for both scenarios when evaluating the LS for paddy fields. Because the land characteristics and number of criteria in the two scenarios are constant, the weightings and scores are assumed to be identical, except for the precipitation criterion with different scores. This study does not take into account the water resources, the type of irrigation system, and the water quantity used in irrigation because they have been discussed in detail in the National Irrigation Master Plan study (JICA Citation2018).
The pairwise comparison was conducted based on the decision of the JICA Project Team, which consists of specialists in the field of agriculture, irrigation, and soil. The team repeatedly held discussions with officials of the Tanzanian Government to understand their needs. The team then used their expertise to identify which criterion among the 11 criteria has higher priority. A consistency ratio of 0.048 was calculated, indicating perfect consistency because the value is below 0.1, as shown in .
Table 4. Weighting factors for the paddy field suitability (rainfed condition and irrigation priority).
shows that the precipitation, Topographic Wetness Index (TWI), slope, soil type, and soil drainage have more influence than other criteria on the LS for paddy fields. These five criteria comprise 81% of the total weight, while the remaining six criteria account for 19%. To practically apply the AHP analysis, ArcGIS 10.5 software with a Spatial Analyst extension was used. The ArcGIS software uses weighted sum analysis, which weighs and combines multiple inputs to create an integrated analysis. In other words, it combines multiple raster inputs, representing multiple factors of different weights or relative importance. It is one of the common methodologies used for MCE analysis including the LS. However, due to license limitations of ArcGIS, several geoprocessing tools could not be used. Hence, QGIS, which is an open source software, was used to overcome this issue. Furthermore, several python programs were written to automate the scoring process as well as the weighted sum analysis to facilitate the examination and review of the final outputs of the LS analysis. shows the criteria used in the LS analysis for paddy fields and shows the detailed scores of each subcriterion for both scenarios, that is, rainfed condition and irrigation priority. They are organized from high to low based on their priority ranking (weight) obtained from the pairwise comparison in .
Figure 2. Criteria used in the land suitability analysis. (a) Precipitation, (b) Topographic Wetness Index, (c) Slope, (d) Soil Type, (e) Soil Drainage, (f) Temperature, (g) Land Use, (h), Soil pH, (i) Elevation, (j) Soil Depth, (k) Soil Organic Carbon.
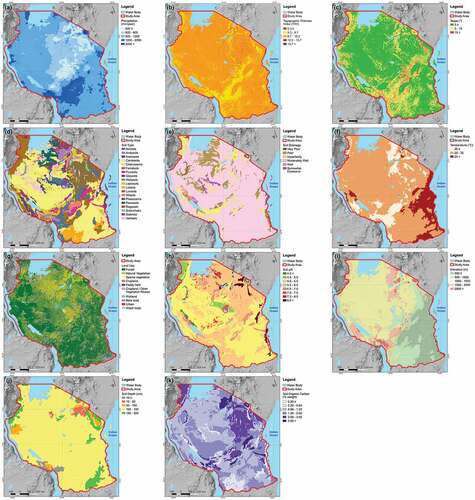
Table 5. List of criteria and subcriteria used for paddy fields and their scores.
3.2.1. Precipitation
) shows the rainfall distribution in the study area. The figure demonstrates that precipitation is the most important factor, not only for paddy field but also for agriculture in general. Thus, it was assigned the highest weight of 0.203. In this study, the difference between the two scenarios, that is, rainfed condition and the irrigation priority, is based on the scoring or evaluation of the precipitation criterion.
The first scenario, that is, the rainfed condition, assumes that irrigation only relies on precipitation. The larger the rainfall amount, the greater are the chances to cultivate paddy fields. In the study area, the rainfall amount ranges from less than 600 to more than 2000 mm/yr. Therefore, a high score of 5 was assigned to a rainfall amount >2000 mm/yr because paddy fields require a huge amount water and a score of 1 was assigned to a rainfall amount <600 mm/yr. lists the acreage of the study area based on the distribution of the rainfall amount. A very limited area of 0.1% of the study area receives a rainfall amount >2000 mm/yr, whereas 60% of the study area receives a rainfall amount between 800–1200 mm/yr. Therefore, only relying on rainfall to irrigate paddy fields is not feasible.
Table 6. Rainfall distribution in the study area.
From a planning point of view, it is better to plan for other water supply sources for new irrigation projects. However, new irrigation projects should be constructed based on a proper plan to identify which areas have priority regarding irrigation. Therefore, to expand the agriculture areas, the distribution of the rainfall amount is the driving force in the irrigation priority scenario. In this scenario, it is assumed that the land which receives a rainfall amount of more than 2000 mm/yr, that is, 0.1% of the study area, does not require additional irrigation water. In contrast, the land that receives a rainfall amount between 800 and 1200 mm/yr, that is, 60% of the study area, requires irrigation water. However, the required water amount is less than that for the land that receives a rainfall amount between 600 and 800 mm/yr, that is, 18% of the study area, and less than 600 mm/yr. The land that receives a rainfall amount between 1200 and 2000 mm/yr, that is, 14% of the study area, may still require additional water in the form of irrigation, but it is not of high priority. Therefore, a score of 5 was assigned to the amount of precipitation between 800 and 1200 mm/yr and a score of 1 was assigned to the amount of rainfall >2000 mm/yr.
3.2.2. Topographic Wetness Index
The Topographic Wetness Index (TWI) was initially developed by Beven and Kirkby (Citation1979). It is a hydrology-based topographic index describing the tendency of a cell to accumulate water (Mattivi et al. Citation2019) and is used to define spatial soil moisture conditions or the saturation deficit (O’Loughlin Citation1981), soil moisture pattern (Grayson et al. Citation1997), and precision agriculture (Qin et al. Citation2011). The TWI is defined as:
The TWI was assigned the second highest weighting factor of 0.185 after precipitation. The TWI raster cell values were divided into five classes, as shown in . A score of 5 was assigned to the highest raster cell values of more than 15.7 because they represent converging, flat terrain and are associated with a high potential of soil water saturation, while a score of 1 was assigned to the lowest raster cell values of less than or equal to 5.3 because they represent diverging, steep areas and are associated with a low potential of saturation.
3.2.3. Slope
Plain or gently sloped land is ideal for growing paddy fields because stagnant water is required for paddy cultivation. In Tanzania, the lowland ecology with a gentle slope is the preferred environment for paddy cultivation (Chauhan, Jabran, and Mahajan Citation2017). In this study, a slope map was created based on the interpretation of SRTM data covering the study area ()). A slope value of ≤3° was assigned a score of 5, while a slope of >15° was assigned a score of 1. The slope factor received a weighting factor of 0.181.
3.2.4. Soil type
Agricultural crops strongly depend on the soil type due to the fact that not all soil types are suitable for paddy fields. Various types of soil are distributed in the study area ()). However, only two types of soil were assigned a score of 5: Cambisols and Luvisols. Both types are fertile soils that are extensively used in agriculture and suitable for a wide range of agricultural crops including paddy fields. Fluvisols and Vertisols are also suitable for paddy fields; however, they were assigned a score of 4 because they require proper management to be productive. Gleysols and Chernozems are moderately suitable for paddy fields and were assigned a score of 3. The former soil type requires the installation of a drainage system, while the latter is suitable for other grain crops such as maize and oats but not for paddy fields. Many soil types were assigned a score of 2, as shown in , because they are suitable for other types of crops such as maize, beans, coffee, tea, phosphate-tolerant crops, and other vegetables. In addition, several of those types are suitable for tree crops; however, pasture is often their main agricultural use. Lixisols, Leptosols, Regosols, and Solonchaks were assigned a score of 1 because they have a low agricultural value and are mostly suitable for savanna, forestry, and natural conservation (FAO Citation2006). The soil type was assigned a weighting factor of 0.165.
3.2.5. Soil drainage
The criterion for soil drainage varies depending on the location. In several studies, the soil drainage has been classified into seven categories (Kihoro, Bosco, and Murage Citation2013), while other researchers have proposed four categories (Raza et al. Citation2018; Perveen et al. Citation2007). However, the suitability of the soil drainage differs between these studies. The study area consists of six categories of soil drainage ()), which are grouped into five classes, as illustrated in . Generally, the soil drainage should prevent water from quickly percolating into the subsurface during paddy field cultivation. In this study, very poor and poor drainages are considered to be suitable for paddy field cultivation. Accordingly, these two classes were assigned scores of 5 and 4, respectively. In contrast, well and somewhat excessive drainage soils are the least suitable for paddy field cultivation and were thus assigned scores of 2 and 1, respectively. The soil drainage criterion has less influence than the previous criteria and was assigned a weighting factor of 0.077.
3.2.6. Temperature
) shows the temperature distribution in the study area. The average annual temperature of the study area is 22°C based on WorldClim 2 data (Fick and Hijmans Citation2017), with minimum and maximum temperatures of −5°C and 30°C, respectively. Several researchers suggested that an average temperature between 22°C and 30°C is very suitable for the growth of paddy fields (Kihoro, Bosco, and Murage Citation2013; Raza et al. Citation2018). Other researchers are more conservative and suggested a temperature ranging between 25°C and 29°C to be very suitable (Hall and Wang Citation1992). In this study, a score of 5 was assigned to a temperature >25°C and a score of 1 was assigned to a temperature of ≤20°C. The temperature criterion was assigned a weighting factor of 0.049.
3.2.7. Land use
The land use/cover map of Tanzania was derived from the Global Land Cover by National Mapping Organizations (GLCNMO) version 2 (Tateishi et al. Citation2014). It comprises ten classes, that is, forest, natural vegetation, sparse vegetation, cropland, paddy field, cropland/other vegetation mosaic, wetland, bare area, urban, and waterbody ()). The land classified as forest, urban area, and water was given the smallest score of 1 because it is not suitable for paddy field cultivation. The land classified as bare area is less suitable and was assigned a score of 2. The land classified as sparse vegetation and paddy field is very suitable and was assigned a score value of 5 because it represents a potential location for agricultural development. The land use criterion was assigned a weighting factor of 0.042.
3.2.8. Soil pH
The soil pH distribution in the study area ranges from <4.5 to >8 (FAO/IIASA/ISRIC/ISSCAS/JRC Citation2012), as demonstrated in ). Paddy fields are one of the crops that are tolerant to acidic soil (Tanaka and Navasero Citation1966). However, many studies suggested that the most suitable soil pH ranges between 5.5 and 7 (Hall and Wang Citation1992; Khaki et al. Citation2017). Therefore, this range was assigned a score of 5. In contrast, highly acid (pH < 4.5) and highly alkaline (pH > 8.0) soils are not suitable for paddy field and thus were assigned a score value of 1. The soil pH criterion was assigned a weighting factor of 0.030.
3.2.9. Elevation
The land elevation was classified into five classes from less than or equal to 500 m to more than 2000 m, with an increment of 500 m for each class ()). As explained regarding the slope criterion, the lowland ecology is the preferred environment for paddy cultivation in Tanzania (Chauhan, Jabran, and Mahajan Citation2017); hence, the land elevation of ≤500 m was assigned a score of 5, while a score of 1 was assigned to an elevation >2000 m. The elevation criterion was assigned a weighting factor of 0.026.
3.2.10. Soil depth
The soil depth ()), in general controls the rooting depth of plants. For instance, shallow soil can be a limiting factor to plant growth because it reduces the access to water and nutrients and thereby reducing the land productivity (FAO Citation2011). The soil depth has a significant influence on the types of plants that can be grown. The capacity of soil to store water and nutrients depends on the soil depth. For example, deep soil can store more water and nutrients than shallow soil. In this study, a score of 5 was assigned to a soil depth between 150–300 cm and a score of 1 was assigned to a shallow soil depth of less than or equal to 10 cm.
3.2.11. Soil organic carbon
Soil organic carbon is the main component of soil organic matter. It is a significant criterion for food production as well as the mitigation of and adaptation to climate change (FAO Citation2017b). A high soil organic carbon content is an indicator of the soil health, fertility, and overall sustainability, while a low soil organic carbon content is an indicator of soil degradation. The results of several studies suggested that the major threshold of the soil organic carbon content in temperate regions is 2%; below this threshold, a potentially serious decline in the soil quality will occur (Loveland and Webb Citation2003). The soil organic carbon content in the study area ranges from ≤0.2% to >3.0% (FAO/IIASA/ISRIC/ISSCAS/JRC Citation2012), as illustrated in ). Although a soil organic carbon content >3.0% is excellent for agricultural activity, it was assigned a score of 1 in this study because it is associated with areas with relatively high elevation and low temperature in Tanzania (Kempen et al. Citation2019), which are unsuitable for paddy fields. Other studies based on field surveys showed that paddy fields have soil organic carbon contents between 1.2% and 2.0% (Ma et al. Citation2017). This range was adopted in this study because of the wide range of the soil organic carbon content in the study area and was assigned a score of 5. Soil organic carbon contents between 2.0% and 3% were assigned a score of 4 because of their relatively limited distribution. This criterion was assigned a weighting factor of 0.021 because it can be managed by applying manure, tillage, crop rotation, and fertilizers (Liu et al. Citation2006).
In general, the output values of the LS analysis range between 1 and 5. These values were normalized to a scale of 0%–100% using the following equation:
where LSnorm is the normalized LS value between 0% and 100%, x is the original LS value before normalization, min(x) is the minimum LS value, and max(x) is the maximum LS value. The final LS data were classified into five classes: Very low (0%–20%), Low (21%–40%), Moderate (41%–60%), High (61%–80%), and Very high (81%–100%).
3.3. Identification of potential agricultural land
Several parts of the study area cannot be cultivated because they are located within protected areas or within areas with land that cannot be used for agricultural development. Therefore, it is necessary to identify the potential agricultural land in the study area. In this study, the potential agricultural land is defined as the land that can be used for agricultural development without adversely affecting the natural wildlife environment such as protected or forest areas. As explained earlier regarding the land use criterion, the study area can be divided into ten land use cover classes. These ten classes can be grouped into seven classes: forest, natural vegetation, cropland (cropland, paddy fields, and cropland/other vegetation mosaic), wetland, bare area and sparse vegetation, urban, and waterbody. An eighth class to be considered for the land use is the protected area, which accounts for 34% of the study area (UNEP-WCMC and IUCN Citation2017), as shown in . Although the protected area in Tanzania is divided into strictly protected and other protected areas (Riggio et al. Citation2019), it is treated as strictly protected area in this study to avoid agricultural development in protected areas. Therefore, among the eight land use classes, four classes were considered in the LS analysis: cropland, natural vegetation, bare area and sparse vegetation, and wetland. These four classes represent the potential agricultural land, which accounts for 255,074 km2 (25,507,443 ha) and 27.2% of the total area of the study area, as shown in . The other four land use/cover classes were considered to be unsuitable because agricultural activities are not permitted in these areas.
Table 7. Acreage of land use/cover in the mainland of Tanzania.
4. Results and discussion
4.1. Land suitability (Rainfed Condition)
) shows the LS map for paddy fields in the rainfed condition scenario including unsuitable areas. Land with very high suitability represents 8.5% of the study area and is located in the eastern part near Dar es Salaam and in the southern part near the border to Mozambique. However, the majority of the study area shows a high and moderate suitability (53.0% and 33.2%, respectively) (). In contrast, the low and very low suitability classes account for 5.1% and 0.1% of the study area, respectively, and stretch from north to south along the central region.
Figure 3. Land suitability distribution for paddy fields under the rainfed condition scenario. (a) whole study area (b) within potential agricultural land.
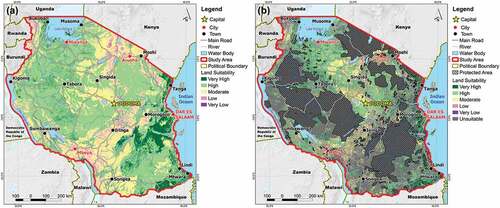
Table 8. Acreage of land suitability classes (rainfed condition) in the mainland of Tanzania.
When focusing on potential agricultural land, the LS changes significantly () and ). Unsuitable land represents 72.8% of the study area, reducing the land that can be used for agriculture to 27.2% or 255,075 km2. The area of the LS classes under the rainfed condition sharply declines within the 27.2% of potential agricultural land. The very high class decreases from 8.5% (80,083 km2) to 2.8% (25,917 km2). Furthermore, the high and moderate classes decrease from 53.0% (496,876 km2) and 33.2% (311,597 km2) to 14.8 (139,178 km2) and 8.6% (80,666 km2), respectively. In addition, the low and very low suitability classes decrease from 5.2% to 1.02%.
Table 9. Acreage of land suitability classes (rainfed condition) within potential agricultural land in the mainland of Tanzania.
The very high and high suitability classes represent 17.6% of the total land of the study area, which equals 64.7% of the 255,075 km2 of potential agricultural land. The moderate, low, and very low suitability classes account for 9.6% of the total land of the study area, equivalent to 35.3% of the potential agricultural land.
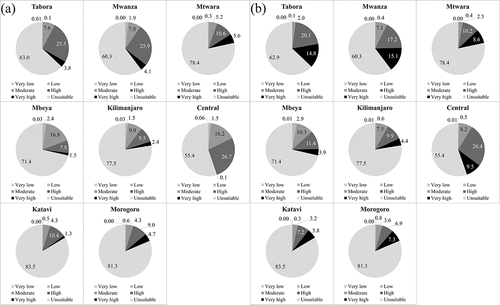
The distribution of the LS within the eight irrigation zones shows that the Katavi, Morogoro, Mtwara, Kilimanjaro, and Mbeya zones contain the highest percentages of unsuitable land of 83.5%, 81.3%, 78.4%, 77.5%, and 71.4%, respectively ()). In contrast, the Tabora, Mwanza, and Central zones have the lowest percentages of unsuitable land of 63.0%, 60.3%, and 55.4%, respectively, indicating that the remaining percentages of each irrigation zone are potential agricultural land. ) demonstrates that the Mwanza and Tabora zones are the best zones for paddy field cultivation, followed by the Central zone. The sum of the acreage percentages of the very high and high suitability classes in the Mwanza, Tabora, and Central zones is 30%, 29.3%, and 26.8%, respectively. In contrast, the same suitability classes account for 16.2% of the Mtwara zone and less than 15% of the acreage of the Morogoro, Kilimanjaro, and Katavi zones. The very high and high classes represent <10% of the total area of the Mbeya zone, which therefore is the least suitable zone for paddy field cultivation under the rainfed condition.
Figure 4. Percentages of land suitability classes under the (a) rainfed condition and (b) irrigation priority scenarios distributed within the eight irrigation zones.
4.2. Land suitability (Irrigation Priority)
The LS for paddy fields in the irrigation priority scenario indicates a higher opportunity for the land to be used for paddy field agriculture (). Before excluding the land unsuitable for paddy fields ()), the very high suitability class represents 30.1% (281,854 km2) of the total land and is distributed on the eastern and westerns sides of the study area. The high and moderate suitability classes represent 41.4% (388,550 km2) and 21.4% (200,776 km2), respectively, and generally extend from north to south along the central part of the study area. The low and very low suitability classes account for 7.1% (66,380 km2) of the study area and are primarily in the region among the towns Iringa, Mbeya, and Songea.
Figure 5. The land suitability distribution for paddy fields under the irrigation priority scenario (a) whole study area (b) within potential agricultural land.
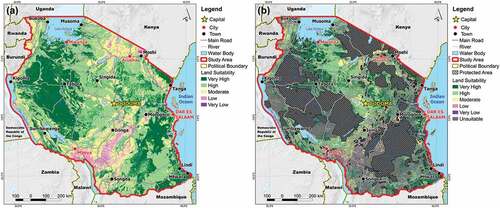
Table 10. Acreage of land suitability classes (irrigation priority) in the mainland of Tanzania.
) shows the distribution of the LS based on the irrigation priority scenario within the potential agricultural land. Similar to the rainfed case, the unsuitable area represents 72.8% (682,486 km2) of the study area and the remaining area accounts for 27.2% (255,075 km2). However, the large area classified as very high suitable land is either in the protected or forest areas, which makes it unsuitable for paddy field cultivation. The LS classes severely decline within the potential agricultural land, the very high suitability class decreases from 30.1% (281,854 km2) to 8.2% (76,476 km2) and the high and moderate suitability classes decrease from 41.4% (388,550 km2) and 21.4% (200,776 km2) to 13.2% (123,958 km2) and 5.1% (48,074 km2), respectively (). The remaining low and very low suitability classes account for less than 1% of the potential agricultural land. However, the irrigation scenario is advantageous over the rainfed condition because there is a greater potential of growing paddy fields. The very high and high suitability classes represent 21.4% of the total land of the study area and 78.6% of the area with potential agricultural land. This reflects an increase of 13.9% of the very high and high suitability classes compared with those under the rainfed condition. In contrast, the moderate, low, and very low suitability classes account for 5.8% of the total land of the study area and 21.4% of the potential agricultural land area. This demonstrates a decrease of 7.1% compared with the same suitability classes under the rainfed condition.
Table 11. Acreage of land suitability classes (irrigation priority) within potential agricultural land in the mainland of Tanzania.
The distribution of the LS by irrigation zone ()) indicates that the Central and Tabora zones are the best zones for paddy field cultivation, followed by the Mwanza zone. The very high and high LS classes represent 35.9%, 35.0%, and 32.3% of the Central, Tabora, and Mwanza zones, respectively. In the Mtwara and Mbeya zones, the same classes occupy 18.8% and 15.4% of the total zone areas, respectively. In the Kilimanjaro, Morogoro, and Katavi zones, they constitute less than 15% of the total zone areas. Compared with the rainfed condition scenario, the irrigation priority scenario exhibits an improved LS for paddy field cultivation. Notably, significant improvements are observed in the Central, Mbeya and Tabora zones, with an increase of 9.1%, 6.0%, and 5.7%, respectively. An increase between 2% and 3% is observed in the Mtwara, Kilimanjaro, and Mwanza zones. The smallest improvement is recorded in the Katavi and Morogoro zones (1.3% and 0.5%, respectively).
These two scenarios reveal that the Mwanza, Tabora, and Central zones are the best zones for paddy field, but in a different order. In the rainfed condition scenario, the Mwanza Zone is the best zone for paddy field cultivation, followed by the Tabora Zone, while in the irrigation priority scenario, the Central Zone is the best zone for paddy field cultivation, followed by the Tabora Zone. However, the irrigation priority scenario has an advantage over the rainfed scenario because it demonstrates enhanced opportunities for the cultivation of paddy fields in less favorable zones, such as the Mtwara and Mbeya zones.
To improve the agricultural practices in Tanzania, alternative methods to irrigate crops must be identified. Relying on precipitation for irrigation of the crops, such as in the case of the rainfed condition scenario, will not lead to sustainable agriculture, not to mention the low production. In Tanzania the rice yields under rainfed system are less by two times or more than yields under irrigated system (Nkuba et al. Citation2016). Therefore, the development of new irrigation projects that can supply water on a regular basis will improve the agricultural activities in Tanzania. However, locating areas to develop new irrigation projects remains the biggest question. The area of Tanzania is very large; hence it is not feasible or practical to develop new irrigation projects without prioritizing land with very high and high suitability classes and excluding land with less suitable or unsuitable classes. The results of the present study highlight the importance of the irrigation priority scenario to prioritize the most suitable lands in order to plan new irrigation projects. This scenario does not focus on the area that receives a rainfall amount >2000 mm/yr because a sufficient amount of water for paddy field irrigation would have been received already. In contrast, it focuses on the study area that receives a rainfall amount between 800–1200 mm/yr, which is not enough for paddy field irrigation, but still suitable if supported by additional water supply based on the development of new irrigation projects. Thus, the importance of the irrigation priority scenario is to identify the most suitable land within available potential agricultural land for the effective development of future irrigation projects, rather than developing irrigation projects in any region without prior knowledge of the LS. This will enable the government to properly plan and focus on land with very high and high suitability classes to obtain effective results without negative effects on the forest environment or other protected areas.
The LS analysis shows that the study area in general is highly suitable for paddy field agriculture. The rainfed condition scenario () demonstrates that total area of very high and high LS classes is approximately 165,000 km2 when considering rainfall as the only source of water. In contrast, the area of the same LS classes increases to approximately 200,000 km2 in irrigation priority scenario (). This indicates that supporting rainfall with new irrigation projects increased opportunities to expand paddy field acreage in Tanzania.
Although the decision of weighting factors was taken by the JICA Project Team’s assessment, which is considered a limitation of the AHP approach since it relies on the experts’ opinions (Akpoti, Kabo-bah, and Zwart Citation2019). In this study, the AHP remains the ideal decision-making method because it serves the goal of agricultural land use planning without negatively influencing the natural wildlife environment. The involvement of the decision makers of the Tanzanian government came at a later stage when all the analyses and assessments of land suitability, availability of water resources, social, economic and marketing factors were conducted, in addition to collecting the opinions of government officials at the district level. After integrating all the information, the decision makers worked with the JICA Project Team to prioritize the irrigation projects.
This specific study is unique because it scientifically demonstrates the practical application of GIS and AHP in agricultural land use planning on a vast area (i.e. the mainland of Tanzania). A study area that has not been evaluated before for land suitability for paddy fields, and shows high potential for developing new irrigation projects.
5. Conclusions
Based on the LS analysis using the GIS-based AHP method, the LS for agriculture was assessed considering multiple criteria. The analysis of the LS of a large area, such as the mainland of Tanzania, is not easy because it requires the collection of data from different sources with different formats to create a complete unified database that covers the whole study area.
In this study, two LS scenarios were considered: rainfed condition and irrigation priority. In both scenarios, the land with the highest suitability for paddy field cultivation was identified and eight administrative irrigation zones were evaluated. Among the eight irrigation zones, the Mwanza, Tabora, and Central zones are the best zones for paddy field cultivation in both the rainfed condition and priority irrigation scenarios. The cultivation of paddy fields in the Mwanza zone is recommended under the rainfed condition scenario. In contrast, in the Central zone, the irrigation priority scenario is preferred, that is, the supply of water based on the development of new irrigation projects. The Tabora Zone takes the second place in both scenarios and thus in either scenario is appropriate.
The use of AHP with GIS has proven to be very effective in planning and determining the current state of available land resources. These tools can help decision makers in planning new irrigation projects. In the study area, the JICA project team attempted to support the Tanzanian government in assessing the LS for paddy fields as part of a master plan. The team used the latest technology and included as much data as possible to reflect the current state of existing land resources.
The conservation of the natural environment, such as protected and forest areas, is a major issue because it limits the planning of new irrigation projects. However, despite these environmental restrictions, the country contains a lot of land suitable for agriculture. In fact, the main factor controlling the cultivation of paddy fields is not the availability of land but the availability of irrigation water resources. Hence, providing an effective irrigation system that can improve the agriculture in Tanzania is very important and requires prudent planning and the effective management of available resources.
Acknowledgments
This research was conducted as part of ‘The Project on the Revision of National Irrigation Master Plan in the United Republic of Tanzania’, report registration number is RD/JR/18-025. The author would like to thank JICA for funding the project.
Disclosure statement
No potential conflict of interest was reported by the author(s).
Data availability statement
Data not available due to legal restrictions. Due to the nature of this research, participants of this study did not agree for their data to be shared publicly, so supporting data is not available.
Correction Statement
This article has been corrected with minor changes. These changes do not impact the academic content of the article.
Additional information
Funding
Notes on contributors
Ahmad Al-Hanbali
Ahmad Al-Hanbali received his PhD in remote sensing from Chiba University in 2007. Currently, he is a consultant at Geosphere Environmental Technology Corp. His research interests are remote sensing and geographic information system (GIS) and their applications in water resources, land use/cover analysis, spatial environmental modeling, spatial decision support systems, and multi-criteria decision-making.
Kenichi Shibuta
Kenichi Shibuta received his bachelor’s degree in irrigation engineering from Miyazaki University in 1981. Currently, he is a consultant at Nippon Koei Co., Ltd. He has 40 years of experience in overseas projects in East Asia, Southeast Asia, Africa and South America. His main research interests are water resources management and construction management.
Bayan Alsaaideh
Bayan Alsaaideh received her PhD in remote sensing from Chiba University in 2012. Her research is devoted to generating and validating a global/regional land cover mapping of urban and mangrove forests and monitoring environmental changes using geospatial data.
Yasuhiro Tawara
Yasuhiro Tawara received his master’s degree of engineering (groundwater pollution modeling and simulation) from the University of Tokyo in 2006. Currently, he is a consultant at Geosphere Environmental Technology Corp. His research interests are coupled modeling of hydrological water flow and chemical reaction at watershed scale, uncertainty assessment in watershed modeling, and decision support using these modeling techniques.
References
- Akıncı, H., A.Y. Özalp, and B. Turgut. 2013. “Agricultural Land Use Suitability Analysis Using GIS and AHP Technique.” Computers and Electronics in Agriculture 97: 71–82. doi:10.1016/j.compag.2013.07.006.
- Akpoti, K., A.T. Kabo-bah, and S.J. Zwart. 2019. “Agricultural Land Suitability Analysis: State-of-the-art and Outlooks for Integration of Climate Change Analysis.” Agricultural Systems 173: 172–208. doi:10.1016/j.agsy.2019.02.013.
- Al-Hanbali, A., B. Alsaaideh, and A. Kondoh. 2011. “Using GIS-based Weighted Linear Combination Analysis and Remote Sensing Techniques to Select Optimum Solid Waste Disposal Sites within Mafraq City, Jordan.” International Journal of Geographical Information Science 3 (4): 267–278. doi:10.4236/jgis.2011.34023.
- Beven, K.J., and M.J. Kirkby. 1979. “A Physically Based, Variable Contributing Area Model of Basin Hydrology.” Hydrological Sciences Journal 24 (1): 43–69. doi:10.1080/02626667909491834.
- Bozdağ, A., F. Yavuz, and A. Dönertaş. 2016. “AHP- and GIS-based Land Suitability Analysis for Cihanbeyli (Turkey) County.” Environmental Earth Sciences 75 (9): 1–15. doi:10.1007/s12665-016-5558-9.
- Carver, S.J. 1991. “Integrating Multi-criteria Evaluation with Geographical Information Systems.” International Journal of Geographical Information System 5 (3): 321–339. doi:10.1080/02693799108927858.
- Chauhan, B.S., K. Jabran, and G. Mahajan. 2017. Rice Production Worldwide. Switzerland: Springer International Publishing AG. doi:10.1007/978-3-319-47516-5.
- Church, R. 2002. “Geographical Information Systems and Location Science.” Computers & Operations Research 29 (6): 541–562. doi:10.1016/S0305-0548(99)00104-5.
- DeFries, R., T. Rudel, M. Uriarte, and M. Hansen. 2010. “Deforestation Driven by Urban Population Growth and Agricultural Trade in the Twenty-first Century.” Nature Geoscience 3: 178–181. doi:10.1038/ngeo756.
- DOE. 2014. Fifth National Report on Implementation of the Convention of Biological Diversity. Dar Es Salaam: Division of Environment.
- Doggart, N., T. Morgan-Brown, E. Lyimo, B. Mbilinyi, C.K. Meshack, S.M. Sallu, and D.V. Spracklen. 2020. “Agriculture Is the Main Driver of Deforestation in Tanzania.” Environmental Research Letters 15: 034028. doi:10.1088/1748-9326/ab6b35.
- FAO. 2003. State of the World’s Forests. Rome: Food and Agricultural Organization of the United Nations (FAO).
- FAO. 2006. World Reference Base for Soil Resources. A Framework for International Classification, Correlation and Communication. Rome: Food and Agriculture Organization of The United Nations (FAO).
- FAO. 2011. Land Degradation Assessment in Drylands. Manual for Local Level Assessment of Land Degradation and Sustainable Land Management, Part 2, Field Methodology and Tools. Rome: Food and Agriculture Organization of the United Nations (FAO).
- FAO. 2017a. FAO-UNESCO Soil Map. Rome: Food and Agricultural Organization of the United Nations (FAO). Accessed 2 February 2017. http://ref.data.fao.org/map?entryId=c3bfc940-bdc3-11db-a0f6-000d939bc5d8&tab=about
- FAO. 2017b. Soil Organic Carbon: The Hidden Potential. Rome: Food and Agriculture Organization of the United Nations (FAO).
- FAO/IIASA/ISRIC/ISSCAS/JRC. 2012. Harmonized World Soil Database (Version 1.2). Rome: Food and Agricultural Organization of the United Nations (FAO) and Luxemburg: International Institute for Applied Systems Analysis (IIASA). Accessed 27 February 2017. http://www.fao.org/soils-portal/soil-survey/soil-maps-and-databases/harmonized-world-soil-database-v12/en/.
- Feizizadeh, B., and T. Blaschke. 2013. “Land Suitability Analysis for Tabriz County, Iran: A Multi-criteria Evaluation Approach Using GIS.” Journal of Environmental Planning and Management 56 (1): 1–23. doi:10.1080/09640568.2011.646964.
- Fick, S.E., and R.J. Hijmans. 2017. “Worldclim 2: New 1-km Spatial Resolution Climate Surfaces for Global Land Areas.” International Journal of Climatology 37 (12): 4302–4315. doi:10.1002/joc.5086.
- Funk, C., P. Peterson, M. Landsfeld, D. Pedreros, J. Verdin, S. Shukla, G. Husak, et al. 2015. “The Climate Hazards Infrared Precipitation with Stations—a New Environmental Record for Monitoring Extremes.” Scientific Data 2:150066. doi:10.1038/sdata.2015.66.
- Grayson, R.B., A.W. Western, F.H.S. Chiew, and G. Blöschl. 1997. “Preferred States in Spatial Soil Moisture Patterns: Local and Nonlocal Controls.” Water Resources Research 33 (12): 2897–2908. doi:10.1029/97WR02174.
- Hall, G.B., and F. Wang. 1992. “Comparison of Boolean and Fuzzy Classification Methods in Land Suitability Analysis by Using Geographical Information Systems.” Environment and Planning A: Economy and Space 24 (4): 497–516. doi:10.1068/a240497.
- HLPE. 2016. Sustainable Agricultural Development for Food Security and Nutrition: What Roles for Livestock? Rome: High-Level Panel of Experts (HLPE) on Food Security and Nutrition of the Committee on World Food Security.
- Ho, W. 2008. “Integrated Analytic Hierarchy Process and Its Applications: A Literature Review.” European Journal of Operational Research 18: 211–228. doi:10.1016/j.ejor.2007.01.004.
- Houshyar, E., M.J. Sheikhdavoodi, M. Almassi, H. Bahrami, H. Azadi, M. Omidi, G. Sayyad, and F. Witlox. 2014. “Silage Corn Production in Conventional and Conservation Tillage Systems. Part I: Sustainability Analysis Using Combination of GIS/AHP and Multi-fuzzy Modelling.” Ecological Indicators 39: 102–114. doi:10.1016/j.ecolind.2013.12.002.
- JICA. 2018. The Project on the Revision of National Irrigation Master Plan in the United Republic of Tanzania: Final Report. Vol. 1. Tokyo: Japan International Cooperation Agency.
- Keenan, R., G. Reams, F. Achard, J. Freitas, A. Grainger, and E. Lindquist. 2015. “Dynamics of Global Forest Area: Results from the FAO Global Forest Resources Assessment 2015.” Forest Ecology and Management 352: 9–20. doi:10.1016/j.foreco.2015.06.014.
- Kempen, B., S. Dalsgaard, A.K. Kaaya, N. Chamuya, M. Ruipérez-González, A. Pekkarinen, and M.G. Walsh. 2019. “Mapping Topsoil Organic Carbon Concentrations and Stocks for Tanzania.” Geoderma 337: 164–180. doi:10.1016/j.geoderma.2018.09.011.
- Khaki, B.D., N. Honarjoo, N. Davatgar, A. Jalalian, and H.T. Golsefidi. 2017. “Assessment of Two Soil Fertility Indexes to Evaluate Paddy Fields for Rice Cultivation.” Sustainability 9 (8): 1299. doi:10.3390/su9081299.
- Khoi, D.D., and Y. Murayama. 2010. “Delineation of Suitable Cropland Areas Using a GIS Based Multi-criteria Evaluation Approach in the Tam Dao National Park Region, Vietnam.” Sustainability 2: 2024–2043. doi:10.3390/su2072024.
- Kihoro, J., N.J. Bosco, and H. Murage. 2013. “Suitability Analysis for Rice Growing Sites Using a Multicriteria Evaluation and GIS Approach in Great Mwea Region, Kenya.” Springerplus 2 (265): 1–9. doi:10.1186/2193-1801-2-265.
- Li, B., F. Zhang, L.W. Zhang, J.F. Huang, Z.F. Jin, and D.K. Gupta. 2012. “Comprehensive Suitability Evaluation of Tea Crops Using GIS and a Modified Land Ecological Suitability Evaluation Model.” Pedosphere 22 (1): 122–130. doi:10.1016/S1002-0160(11)60198-7.
- Liu, X., S.J. Herbert, A.M. Hashemi, X. Zhang, and G. Ding. 2006. “Effects of Agricultural Management on Soil Organic Matter and Carbon Transformation - A Review.” Plant, Soil and Environment 52 (12): 531–543. doi:10.17221/3544-PSE.
- Loveland, P., and J. Webb. 2003. “Is There a Critical Level of Organic Matter in the Agricultural Soils of Temperate Regions: A Review.” Soil & Tillage Research 70 (1): 1–18. doi:10.1016/S0167-1987(02)00139-3.
- Ma, Y., J. Xu, Q. Wei, S. Yang, L. Liao, S. Chen, and Q. Liao. 2017. “Organic Carbon Content and Its Liable Components in Paddy Soil under Water-saving Irrigation.” Plant, Soil and Environment 63: 125–130. doi:10.17221/817/2016-PSE.
- Mattivi, P., F. Franci, A. Lambertini, and G. Bitelli. 2019. “TWI Computation: A Comparison of Different Open Source GISs.” Open Geospatial Data, Software and Standards 4 (6): 1–12. doi:10.1186/s40965-019-0066-y.
- Mendas, A., and A. Delali. 2012. “Integration of MultiCriteria Decision Analysis in GIS to Develop Land Suitability for Agriculture: Application to Durum Wheat Cultivation in the Region of Mleta in Algeria.” Computers and Electronics in Agriculture 83: 117–126. doi:10.1016/j.compag.2012.02.003.
- Mighty, M.A. 2015. “Site Suitability and the Analytic Hierarchy Process: How GIS Analysis Can Improve the Competitive Advantage of the Jamaican Coffee Industry.” Applied Geography 58: 84–93. doi:10.1016/j.apgeog.2015.01.010.
- MoA. 2017. Agricultural Sector Development Programme Phase Two (ASDP II). Dar es Salaam: Ministry of Agriculture.
- Murray, A. 2010. “Advances in Location Modeling: GIS Linkages and Contributions.” Journal of Geographical Systems 12: 335–354. doi:10.1007/s10109-009-0105-9.
- NBS. 2014. Tanzania Agriculture Statistics Strategic Plan (2014/15–2018/19). Dar es Salaam: National Bureau of Statistics.
- NGA. 2020. “Virginia: National Geospatial-Intelligence Agency (NGA).” Accessed 6 March 2020. https://www.nga.mil/About/History/NGAinHistory/Pages/SRTM.aspx
- Nkuba, J., A. Ndunguru, R. Madulu, D. Lwezaura, G. Kajiru, A. Babu, B. Chalamila, and G. Ley. 2016. “Rice Value Chain Analysis in Tanzania; Identification of Constraints, Opportunities, and Upgrading Strategies.” African Crop Science Journal 24: (s1):73–87. doi:10.4314/acsj.v24i1.8S.
- O’Loughlin, E.M. 1981. “Saturation Regions in Catchments and Their Relations to Soil and Topographic Properties.” Journal of Hydrology 53 (3–4): 229–246. doi:10.1016/0022-1694(81)90003-2.
- Ouma, Y.O., and R. Tateishi. 2014. “Urban Flood Vulnerability and Risk Mapping Using Integrated Multi-parametric AHP and GIS: Methodological Overview and Case Study Assessment.” Water 6: 1515–1545. doi:10.3390/w6061515.
- Ozdemir, S., and G. Sahin. 2018. “Multi-criteria Decision-making in the Location Selection for a Solar PV Power Plant Using AHP.” Measurement 129: 218–226. doi:10.1016/j.measurement.2018.07.020.
- Palchaudhuri, M., and S. Biswas. 2016. “Application of AHP with GIS in Drought Risk Assessment for Puruliya District, India.” Natural Hazards 84: 1905–1920. doi:10.1007/s11069-016-2526-3.
- Perveen, M.F., R. Nagasawa, D. Chongo, and C.A.A. Ould. 2007. “Land Suitability Analysis for Rice Crop Using Remote Sensing and GIS Technology: A Case Study in Haripur Upazila, Bangladesh.” Journal of the Japanese Agricultural Systems Society 23 (4): 283–295. doi:10.14962/jass.23.4_283.
- Pramanik, M.K. 2016. “Site Suitability Analysis for Agricultural Land Use of Darjeeling District Using AHP and GIS Techniques.” Modeling Earth Systems and Environment 2: 56. doi:10.1007/s40808-016-0116-8.
- Qin, C.Z., A. Zhu, T. Pei, B.L. Li, T. Scholten, T. Behrens, and C.H. Zhou. 2011. “An Approach to Computing Topographic Wetness Index Based on Maximum Downslope Gradient.” Precision Agriculture 12: 32–43. doi:10.1007/s11119-009-9152-y.
- Raza, S.M.H., S.A. Mahmood, A.A. Khan, and V. Liesenberg. 2018. “Delineation of Potential Sites for Rice Cultivation through Multi-criteria Evaluation (MCE) Using Remote Sensing and GIS.” International Journal of Plant Production 12: 1–11. doi:10.1007/s42106-017-0001-z.
- Riggio, J., A.P. Jacobson, R.J. Hijmans, and T. Caro. 2019. “How Effective are the Protected Areas of East Africa?” Global Ecology and Conservation 17: e00573. doi:10.1016/j.gecco.2019.e00573.
- Rosa, I., D. Rentsch, and J. Hopcraft. 2018. “Evaluating Forest Protection Strategies: A Comparison of Land-use Systems to Preventing Forest Loss in Tanzania.” Sustainability 10 (12): 4476. doi:10.3390/su10124476.
- Saaty, T.L. 1977. “A Scaling Method for Priorities in Hierarchical Structures.” Journal of Mathematical Psychology 15: 234–281. doi:10.1016/0022-2496(77)90033-5.
- Saaty, T.L. 1987. “Decision Making, New Information, Ranking and Structure.” Mathematical Model 8: 125–132. doi:10.1016/0270-0255(87)90555-0.
- Saaty, T.L. 1994. “How to Make a Decision: The Analytic Hierarchy Process.” Interfaces 24 (6): 19–43. doi:10.1016/0377-2217(90)90057-I.
- Şener, S., E. Şener, B. Nas, and R. Karagüzel. 2010. “Combining AHP with GIS for Landfill Site Selection: A Case Study in the Lake Beyşehir Catchment Area (Konya, Turkey).” Waste Management 30 (11): 2037–2046. doi:10.1016/j.wasman.2010.05.024.
- Sørensen, R., and J. Seibert. 2007. “Effects of DEM Resolution on the Calculation of Topographical Indices: TWI and Its Components.” Journal of Hydrology 347 (1–2): 79–89. doi:10.1016/j.jhydrol.2007.09.001.
- Tanaka, A., and S.A. Navasero. 1966. “Growth of the Rice Plant on Acid Sulfate Soils.” Soil Science and Plant Nutrition 12 (3): 23–30. doi:10.1080/00380768.1966.10431192.
- Tateishi, R., N. Thanh Hoan, T. Kobayashi, B. Alsaaideh, G. Tana, and D. Xuan Phong. 2014. “Production of Global Land Cover Data - GLCNMO2008.” Journal of Geography and Geology 6 (3): 99–122. doi:10.5539/jgg.v6n3p99.
- UNEP-WCMC and IUCN. 2017. The World Database on Protected Areas (Wdpa)/the Global Database on Protected Areas Management Effectiveness (GD-PAME). Cambridge: United Nations Environment Programme World Conservation Monitoring Centre (UNEP-WCMC), and the International Union for Conservation of Nature (IUCN). Accessed 22 February 2017. www.protectedplanet.net
- Voogd, J.H. 1982. “Multicriteria evaluation for urban and regional planning”. dissertation, Delftsche Uitgevers Maatschappij, Delft.
- Zabihi, H., A. Anuar, I. Vogeler, M. Said, M. Golmohammadi, B. Golein, and M. Nilashi. 2015. “Land Suitability Procedure for Sustainable Citrus Planning Using the Application of the Analytical Network Process Approach and GIS.” Computers and Electronics in Agriculture 117: 114–126. doi:10.1016/j.compag.2015.07.014.
- Zhang, J., Y. Su, J. Wu, and H. Liang. 2015. “GIS Based Land Suitability Assessment for Tobacco Production Using AHP and Fuzzy Set in Shandong Province of China.” Computers and Electronics in Agriculture 114: 202–211. doi:10.1016/j.compag.2015.04.004.