
 ?Mathematical formulae have been encoded as MathML and are displayed in this HTML version using MathJax in order to improve their display. Uncheck the box to turn MathJax off. This feature requires Javascript. Click on a formula to zoom.
ABSTRACT
Impervious surface mapping is essential for urban environmental studies. Spectral Mixture Analysis (SMA) and its extensions are widely employed in impervious surface estimation from medium-resolution images. For SMA, inappropriate endmember combinations and inadequate endmember classes have been recognized as the primary reasons for estimation errors. Meanwhile, the spectral-only SMA, without considering urban spatial distribution, fails to consider spectral variability in an adequate manner. The lack of endmember class diversity and their spatial variations lead to over/underestimation. To mitigate these issues, this study integrates a hierarchical strategy and spatially varied endmember spectra to map impervious surface abundance, taking Wuhan and Wuzhou as two study areas. Specifically, the piecewise convex multiple-model endmember detection algorithm is applied to automatically hierarchize images into three regions, and distinct endmember combinations are independently developed in each region. Then, spatially varied endmember spectra are synthesized through neighboring spectra using the distance-based weight. Comparative analysis indicates that the proposed method achieves better performance than Hierarchical SMA and Fixed Four-endmembers SMA in terms of MAE, SE, and RMSE. Further analysis suggests that the hierarchical strategy can expand endmember class types and considerably improve the performance for the study areas in general, specifically in less developed areas. Moreover, we find that spatially varied endmember spectra facilitate the reduction of heterogeneous surface material variations and achieve the improved performance in developed areas.
1. Introduction
Spectral Mixture Analysis (SMA) and its extensions are widely used for estimating impervious surfaces from remote sensing images (Long, Rivard, and Rogge Citation2020; Powell and Roberts Citation2008; Powell et al. Citation2007; Small and Lu Citation2006). In the past decades, efforts have been made that focused on the selection of appropriate spectral signatures to reduce (or enhance) inter-class variation, leading to the development of Automated Shortwave Infrared (SWIR) unmixing method (Asner and Heidebrecht Citation2010), the Normalized Spectral Mixture Analysis (NSMA) (Wu Citation2004), and Derivative Spectral Unmixing (DSU) method (Zhang, Rivard, and Sanchez-Azofeifa Citation2004). Furthermore, the importance of spectral bands with the lowest intra-class variations in impervious surface mapping led to the development of Weighted Spectral Mixture Analysis (WSMA) (Chang and Ji Citation2006) and Stable Zone Unmixing (SZU) (Somers et al. Citation2010).
In addition to the selection of appropriate spectral signatures, the types and amounts of endmember classes are also essential to the success of SMA (Li Citation2019; Fan and Deng Citation2014, Citation2015; Degerickx, Roberts, and Somers Citation2019). Numerous studies have found that inappropriate endmember combinations may lead to considerably reduced accuracy of land cover abundance estimates, resulting in inaccurate reference biophysical compositions of urban environments. Ridd (Citation1995) proposed a three-component model that describes the composition of the urban environment: the vegetation–impervious surface–soil. Moreover, the High Albedo-Low Albedo-Soil-Vegetation (H-L-S-V) and the Low Albedo-Soil-Vegetation (L-S-V) models were developed and applied in low-density and high-density urban areas, respectively (Zhang et al. Citation2014; Wu and Murray Citation2003; Small and Lu Citation2006; Rashed et al. Citation2003; Foody and Cox Citation1994). If a nonexistent land cover endmember class is included, the estimated abundance of this endmember class is usually non-zero, thus inevitably resulting in overestimation errors. Rather than using a fixed-set of endmembers for an entire image, Multiple Endmembers Spectral Mixture Analysis (MESMA) (Roberts et al. Citation1998), as the most representative trial-and-error method, cyclically tests all combinations of endmembers and finds the best-fit model with the lowest-error criterion (Fernández-Manso, Quintano, and Roberts Citation2012). Despite that MESMA takes into account endmember types, however, it does not consider their spatial distribution.
Recently, a number of studies have found that spatial information can assist in improving unmixing results (Franke et al. Citation2009; Rogge et al. Citation2007; Eches, Dobigeon, and Tourneret Citation2010). Deng and Wu (Citation2013) developed a Spatially Adaptive Spectral Mixture Analysis (SASMA) that synthesized the endmember spectral signature of pixels by incorporating the spectra of neighboring endmember pixels. Several per-field methods used distinct endmember combinations of different homogenous regions partitioned from an image to tackle complex scenes with a large number of materials (Shi and Wang Citation2014; Sun et al. Citation2017; Liu and Yang Citation2013). Zare et al. (Citation2013) proposed a Piecewise Convex Multiple-Model Endmember Detection (PCOMMEND) algorithm that employed fuzzy clustering methods to identify regions composed of a single spectrum endmember set. The Geographic Information Assisted Temporal Mixture Analysis (GATMA) was developed to address the issues of endmember class variability and endmember spectral variability (Li and Wu Citation2015; Citation2017). A more detailed discussion can be found in a review that introduced and categorized spatial information incorporated unmixing methods (Shi and Wang Citation2014).
Despite the aforementioned efforts, challenges still remain (Li Citation2017; Shi and Wang Citation2014; Zare and Ho Citation2014; Somers et al. Citation2011; Zhang et al. Citation2019). A well-noted problem is that the numbers and types of endmember classes are inadequate to meet material diversity in urban scenes when implementing three/four-components SMA. In general cases, the number of endmember classes is restricted to + 1, where
is the number of available image bands. In fact, a complex urban scene often contains diverse materials (Wetherley, Roberts, and Mcfadden Citation2017). For instance, artificial urban surface materials could include asphalt, concrete, metal, cement, and tiles (Wetherley, Roberts, and Mcfadden Citation2017; Herold and Roberts Citation2005). Soils, depending on moisture and type, could also show spectral variability that is similar to impervious surfaces (Hu and Weng Citation2009). In addition, the spatial heterogeneity of the ground surface is associated with the density of population and economic factors (Shao et al. Citation2020a; Liu et al. Citation2020, Citation2021; Gao et al. Citation2019). Impervious surfaces are mainly found in urban centers, while vegetation tends to lie in mountains or surrounding plains. Therefore, the ignorance of the impact of geographical distribution and economic factors on the endmember spectral variability will inevitably occur mis-estimation. For most studies, extreme pixels identified from the vertex of the n-dimensional scatter plot are usually extracted as endmembers and then applied to the entire image (Yang, He, and Oguchi Citation2014; Li and Wu Citation2014; Hsieh, Lee, and Chen Citation2001). These extreme endmembers with global endmember spectra are able to maximize inter-class variation in an effective manner but fail to reduce intra-class variation (Mei et al. Citation2010). Thus, it is not valid to use extreme endmembers’ spectral signatures and apply them to the whole image. However, most existing efforts failed to consider endmember combinations and spatial variations of endmember simultaneously.
The overlooked types and spatial variations of endmembers would lead to under- or over-estimation of fractional land cover. To mitigate this problem, we took into account the endmember combinations and endmember spatial variations through a hierarchical strategy and localizing spatially varied endmember spectra in this study. Hierarchical strategy is considered to be effective in reducing spectral variations (Franke et al. Citation2009; Yang and He Citation2017; Sun et al. Citation2017). The initial Land Cover Abundances (LCAs) estimated by the PCOMMEND method were used to stratify the whole image into three regions via a specific threshold, with each region have distinct endmember combinations. For the whole image, the number of endmember classes is enriched to a certain extent, thus mitigating the restriction of . Moreover, localizing spatial variation could partially address the issue using spatially adaptive endmembers (Li Citation2017; King and Younan Citation2006). Via a distance-based weight, we applied the Synthetic Spectral Signature Method (SSUME) (Deng and Wu Citation2013) to calculate spatially varied endmember spectra.
This study deals with endmember class diversity and their spatial variations in unmixing by proposing an extended SMA based on hierarchical strategy and SSUME. We aim to reduce confusion between spectrally similar classes via various endmember classes and local spatially varied endmember spectra when mapping accurate impervious surface abundances. The rest of this article is structured as follows. Section 2 describes the study area and datasets. Section 3 presents the proposed methods in detail, including hierarchization, endmembers selection, impervious surface estimation, and validation data. Section 4 presents the estimation results of the proposed methods, quality assessment, and comparative analysis. Finally, Section 5 presents the discussion, followed by the conclusion in Section 6.
2. Study area and dataset
2.1. Study area
In this study, Wuhan and Wuzhou, China, were selected as our study areas (). Wuhan, a city located in central China that has experienced rapid urbanization in the past decades, is the capital city of Hubei Province with a population of over 11 million. At latitude 29°58’–31°22’ N and longitude 113°41’–115°05’ E, Wuhan lies in the confluence of the Han River into the Yangtze River at in the East of the JiangHan Plain. Middle Wuhan is featured by low and flat terrain, while southern Wuhan is rather hilly. An older town, i.e. HanYang, lies in the west of Wuhan. The southeastern urban center is mainly covered by residential, commercial, and university buildings, with industrial, farmland, and woodland occupying the surrounding areas. Our study area in Wuhan covers a total of 4,500 km2, including the downtown and industrial regions.
Figure 1. Two study areas. (a) The People’s Republic of China map; (b) The Landsat OLI image used in the Wuhan study area. (c) The GF-1 image used in the Wuzhou study area.
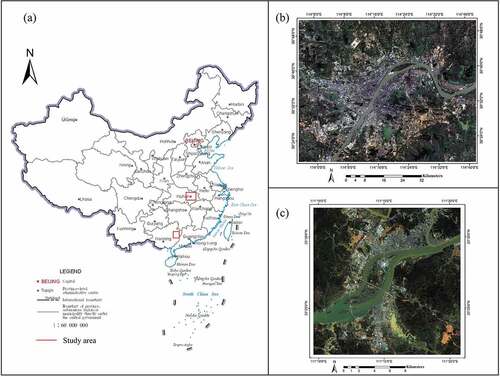
Wuzhou, with a population of 2.99 million, is located in southeast Guangxi Province. At latitude 22°58′12″–24°10′14″ N and longitude 111°51′14″–111°40′ E, Wuzhou sits at the confluence of the Gui River and the Xun River. The topography of Wuzhou is featured by high in northern-southern regions and a low, hilly central region. An older town is located in southeastern Wuzhou, mainly composed of dense low-rise houses, roads, and vegetation. The south is a newly developed area, mainly consisting of high-rise buildings and industrial buildings. As our second study area, the Wuzhou study area covers a total of 1024 km2 urban areas and is characterized by complex urban fabrics. With different local economic, political, and social factors, these two study areas show different urban forms with complex urban-rural spatial patterns (Huang et al. Citation2021). Hence, we believe Wuhan and Wuzhou are ideal study areas for testing the proposed method. Moreover, impervious surface mapping can facilitate the evaluation of the urbanization process, providing essential supports that benefit architectural design and urban planning in Wuhan and Wuzhou (Shao et al. Citation2020c; Trinder and Liu Citation2020).
2.2. Dataset
This study used images collected from Landsat Operational Land Imager (OLI) and GaoFen-1 (GF-1) satellite to estimate impervious surface abundance in Wuhan and Wuzhou. Landsat OLI contains eight 30 m multispectral bands and one 15 m panchromatic band. GF-1 has one 2 m panchromatic band, four 8 m Multispectral (MS) bands, and four 16 m resolution Wide-Angle Multispectral (WFV) bands.
A Landsat OLI acquired on 15 September 2018 covering Wuhan urban area, was used in our study. It was collected from the United States Geological Survey (USGS) website. A 2 m pan-sharpened image generated by GF-1 image in 2018 was collected as the reference image in Wuhan. The Landsat OLI image was geometrically registered into the Universal Transverse Mercator (UTM) projection of pan-sharpened image with geometric errors of less than one pixel and then clipped into 2500 × 2000 pixels. A GF-1 WFV image acquired in 2018, covering the whole urban area, was used in the Wuzhou study area. Ground-based measurement vector data serve as the reference of the Wuzhou study area. In this paper, the co-registered GF-1 WFV image and Ground-based measurement data were collected from Wuzhou Municipal Housing and Urban-Rural Development.
3. Methodology
Studies have shown that three/four-component SMA does not allow a fine distinguishment of complex urban characteristics when applying to the entire region, and inappropriate endmember combinations would lead to over/under-estimation of land cover abundance (Zhang et al. Citation2015). To tackle this problem, we first divided a complex urban scene into three regions. Endmember combinations were independently defined in each region according to respective landscape characteristics. The SSUME further derived spatially varied endmember spectra to minimize intra-class variation. Finally, the three/four-component SMA was used to estimate impervious surface abundance. The flowchart of the proposed method is shown in .
Figure 2. The flowchart of the proposed method.
3.1. Hierarchization of image
In this study, the initial LCAs estimated by the PCOMMEND method were utilized to characterize the urban landscape. The PCOMMEND method is a spatial-spectral unmixing method that considers the spectral and spatial information to generate land cover abundances. Multiple endmembers sets are generated using an iterative fuzzy approach. For each endmember set, the endmember spectrum is simplex. Proportions was derived by minimizing the objective function using EquationEquation (1)
(1)
(1) .
where is the input data;
is an
matrix, and the percentage is estimated with
sample points for each group;
is the percent of pixel
;
is the percentage of the
pixel on the
endmember, ranging from 0 to 1; The sum of
is required to be 1;
is the membership value of the
data pixel in the
endmember set; The sum of
is equal to 1. The number of endmember sets
and the number of endmembers per set
are set as 3 and 4, respectively.
Based on the urban characteristic, the initial LCAs, referenced as proportions in EquationEquation (1)
(1)
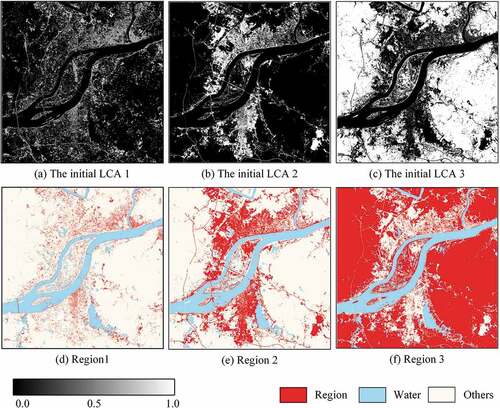
(1) , were estimated by the PCOMMEND method. Major urban components were coarsely categorized into low albedo materials, high albedo materials, and vegetation, linking to the initial LCA 1,2,3, respectively. The initial LCAs have a significantly high correlation with major urban components and can distinguish the different landscapes. For example, low reflectance impervious surfaces and fallow farmland tend to have a high initial LCA 1. In the initial LCA 2, high reflectance impervious surfaces and bare soil are highlighted with positive values. Forest and grass have positive values in the initial LCA 3. Therefore, the initial LCAs are regarded as reliable urban landscape indicators to delineate various typical land covers.
A threshold was set to separate the initial LCAs into three regions. The threshold selection is an important step to characterize urban surface materials in each region. Existing studies have shown that three/four components achieve the optimal solution in the least-squares equation of SMA (Ridd Citation1995; Zhang Citation2008). The ill-posed problem occurs in SMA when the amount of endmember classes is more than the number of available image bands. The threshold was manually determined and aimed to assure that three/four endmember classes are distributed in each region, and their types are consistent across the urban surface features. We designed the rules as follows. Region 1 = the initial LCA 1 >
; Region 2 = the initial LCA 2 >
; Region 3 = 1- (Region 1 ∪ Region 2). Relating to the initial LCAs, Low albedo materials and High albedo materials mostly appear in Regions 1 and 2. Region 3 is mainly covered by vegetation. Thus each region is characterized by its respective landscape characteristics and is treated individually to maximize inter-class spectral variability between urban and natural features.
3.2. Selection of endmembers
Endmembers can be considered as samples in unmixing. Existing methods tend to obtain endmember sets by setting a threshold or constructing a classification tree, which is usually time-consuming (Zhou, Wetherley, and Gader Citation2020). Most approaches yield endmember sets with a single spectrum when applying SMA (Zhang et al. Citation2014; Wu and Murray Citation2003; Small and Lu Citation2006). However, the most “representative” endmembers and endmember bundles could minimize intra-class spectral variability, reducing the mixing of impervious surfaces and other land cover types.
In this study, the most “representative” endmembers were captured through manual interaction with the aid of endmember candidates. In the degree of membership, pixels with the same membership values represent land covers with similar spectral characteristics. Hence, pixels with the same membership value are aggregated into endmember candidates in this study. In addition, it is crucial to ensure pure pixels in endmember candidates. For this reason, border pixels and small objects were removed from endmember candidates using a corrosion algorithm. Then, representative endmembers were identified and selected.
The three/four components were applied to describe the composition of urban surface in Region 1–3. Endmember combinations were formed by the low albedo, high albedo, vegetation, and soil components. For instance, a L-S-V combination was used in Region 1, including low reflectance impervious surfaces, soil, and vegetation. In this study, the L-L-S-V, the H-H-L-S, the H-H-S, and the L-S-V combinations were applied based on the urban characteristics. Such utilization of multiple combinations takes into account the spectrum diversity of land cover types, leading to improved impervious surface estimation.
3.3. Estimation of impervious surface abundance
After identifying representative endmembers in Section 3.2, we further implemented SSUME to synthesize spatially varied endmember spectra. The SSUME was proposed to reduce intra-class variations considering the spatial distribution of endmembers. The spatial dependency theory assumes that the endmember spectra of a target object should be highly associated with the closer neighboring objects corresponding to higher weight and vice versa (Wulder and Boots Citation1998). The spatially varied spectra of each endmember class were calculated using the reciprocal of the Euclidian distance, as:
with
subject to
where represents the synthetic spectral signature of endmember class
for the target pixel located at
;
is the spectral signature of the endmember pixel located at
; the weight
is the target-object distance between the endmember pixel and the target pixel for endmember class
; and
denotes the radius of the search window.
After the synthesis of endmember spectra, a linear SMA with full abundance constraints was adopted to estimate land cover abundance:
subject to
where is the reflectance at band
;
, representing the synthetic spectral signature of endmember
at band
, can be obtained from EquationEquation (2)
(2)
(2) ;
is the calculated abundance of endmember of class
;
denotes the number of endmember classes;
denotes the residual.
3.4. Land cover validation data
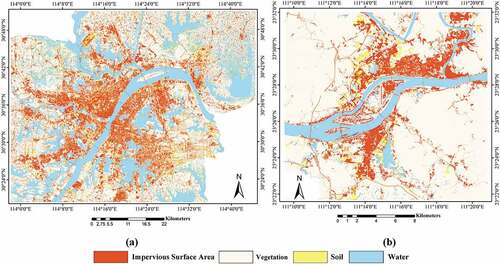
A pan-sharpened multispectral image and ground-based measurement data were used to produce reference images for Wuhan and Wuzhou (see ), respectively. For the Wuhan study area, the pan-sharpened image generated by GF-1 in 2018 was classified into four classes using an object-based classification with the support vector machines classifier. The classified result was manually modified, then downscaled to 30 m as the reference image. For the Wuzhou study area, vector data based on ground-based measurements were converted to a raster at 0.5 m spatial resolution and resampled to 16 m spatial resolution as the reference image. In ground-based measurement data, underground artificial constructions covered by pervious surfaces were removed to avoid confusion. The overall classification accuracy of the Wuhan and Wuzhou study areas was 97.28% and 99.63%, respectively. Note that validation data do not fully cover the Wuhan study area, and the water body in Landsat and GF-1 were masked assisted by the validation data.
Figure 3. The impervious surface classification in Wuhan (a) and Wuzhou (b).
3.5. Accuracy assessment
Further, we randomly selected 300 pixels and performed a pixel-by-pixel comparison between estimated impervious surface abundance and reference abundance. Three statistical indices widely used in previous studies were applied in this study, namely the Mean Absolute Error (MAE), the Systematic Error (SE), and the Root Mean Square Error (RMSE), given by:
where is the estimated impervious surface abundance at pixel
and
represents the reference impervious surface abundance;
are the mean value of reference abundance;
is the total number of pixels. RMSE measures the standard deviation of the residuals. SE quantifies the tendency of over/under-estimation. MAE measures the relative estimation error.
To evaluate the importance of spatially varied endmember spectra and hierarchical strategy, we compared the performance of the Fixed Four-endmember SMA (FFSMA) and the Hierarchical SMA (HSMA). FFSMA is the conventional SMA using four-endmember classes with a single spectrum of each endmember. High albedo, low albedo, soil, and vegetation were chosen as fixed endmember combinations for FFSMA. HSMA also partitioned the whole image into three landscapes and shared the same endmember combinations with the proposed method but used global endmember spectra. This ablation experiment was designed to evaluate how hierarchical strategy and spatially varied endmember spectra affect the accurate estimation of impervious surface abundance.
4. Results
4.1. Hierarchical results
In this study, parameters and
were set as 3 and 4 in Wuhan and Wuzhou, and the threshold was set as 0.7. The optimal solution was achieved using three/four endmember classes (see EquationEquation (4)
(4)
(4) ). For this reason, parameters and the threshold were tested so that three/four land cover types were found in each region. Three/four endmember classes were identified based on the surface materials of each region to ensure that endmember combinations align well with the urban environment.
Landsat OLI and GF-1 WVF images were used to generate the initial LCAs using PCOMMEND. show the initial LCAs automatically derived from PCOMMEND in Wuhan and Wuzhou, respectively. The results suggest that the initial LCA 1–3 effectively represented the primary land covers in the urban environment. Low-albedo pixels tend to be high fractions in the initial LCA 1, including low reflectance artificial materials, soil, and fallow farmland. High-albedo pixels also present high fractions in the initial LCA 2, and they mainly consist of sand, bare soil, and artificial materials with high reflectance. Vegetation shows higher values in the initial LCA 3. The above results confirm that the PCOMMEND is a convzenient, automated technique and effective in discriminating different surface materials.
Figure 4. An illustration of hierarchical results in Wuhan: (a), (b), and (c) are the initial LCAs; (d), (e), and (f) are the corresponding Region 1, Region 2 and Region 3.
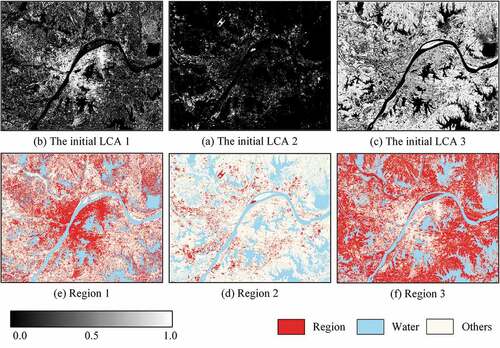
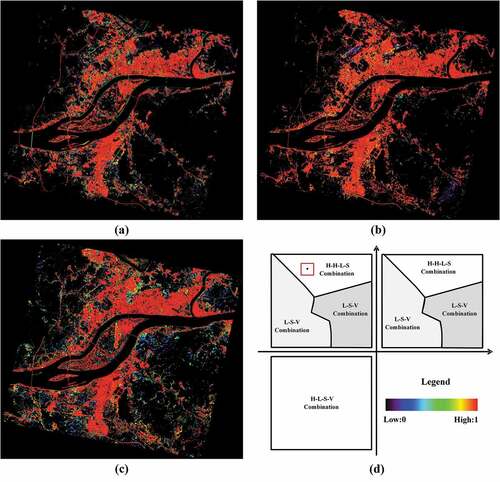
Figure 5. An illustration of hierarchical results in Wuzhou: (a),(b), and (c) are the initial LCAs; (d), (e), and (f) are the corresponding Region 1, Region 2 and Region 3.
The corresponding Region 1, Region 2, and Region 3 were the hierarchical results, shown in for two study areas, respectively. Areas highlighted by red are Regions 1–3, and the water body (highlighted by blue) was masked out. In general, the spatial distribution of hierarchical results in the two study areas is in common. For both study areas, Region 1 covers the old urban center area featured by the industrial district, low-rise residential buildings, and soil. Region 2 represented urban sprawl or urban fringe occupied by plant and high albedo natural ground (e.g. stone and sand). Region 3 illustrates suburban areas, which is a typical mosaic of low-rise residential buildings and vegetation. The urban sprawl patterns in both study areas are slightly different. The rapid urban expansion in Wuhan occurred earlier in Wuzhou, evidenced by Wuhan’s higher degree of urbanization with larger urban cores with less urban sprawl in recent years. Despite the varying degree of urbanization in the two study areas, the hierarchical results are able to summarize the discrepancies in their urban characteristics, establishing foundations for the endmember selection.
4.2. Endmember selection
The urban environment is complicated and covered by spectrally similar surface materials. Therefore, distinguishing diverse land cover enables the performance improvement of impervious surface estimation. In this study, endmember candidates were produced by the degree of membership values using the corrosion algorithm. The small objects with area < 10 pixels for Wuhan and < 30 pixels for Wuzhou were removed, and structural elements of the corrosion algorithm are disk = 5 and 7 for Wuhan and Wuzhou, respectively. Manual identification and selection of endmembers were performed for better performance.
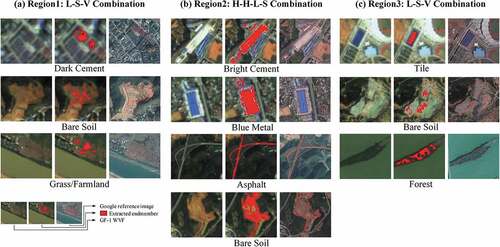
An illustration of endmember combinations and types in Wuhan and Wuzhou is shown in , respectively. ) displays a high albedo impervious surface -low albedo impervious surface-soil-vegetation combination, referred to as the L-L-S-V combination, which was applied in Region 1. The L-L-S-V combination included four land cover types, i.e. tile, dark cement, bare soil, and forest. The first column of ) is an RGB image. Areas highlighted by red in the second column are the locations of endmembers. Additionally, Google Earth images acquired in 2018 were used as a reference for quality assurance, shown in the third column of ). The H-H-S combination, including bright cement, blue metal roof, and bare soil, was used in Region 2 ()). ) shows the L-S-V combination in Region 3 consisted of the tile roof, soil, and forest. In Wuzhou, the L-S-V combination was applied in Region 1 and Region 3, and the H-H-L-S combination was utilized in Region 2. Specific urban surface materials of the three combinations in the Wuzhou study area are shown in .
Figure 6. (a), (b), and (c) are the endmember combinations and types using in Region 1, Region 2 and Region 3 of Wuhan, respectively.
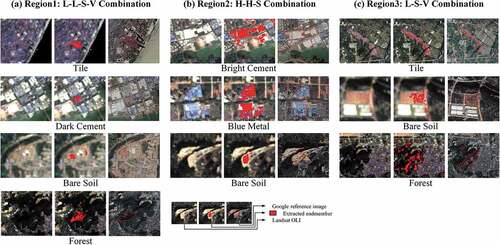
Figure 7. (a), (b), and (c) are the endmember combinations and types using in Region 1, Region 2 and Region 3 of Wuzhou, respectively.
Via visual examination, we found that the spatial distribution of endmembers matches the actual distribution of vegetation and impervious surfaces. Importantly, giant plants and industrial zones usually have large-scale, clear boundaries between artificial and natural surfaces. Therefore, the extracted endmembers from large-scale objects are more concentrated and match well with the actual shape, as demonstrated in ). On the other hand, the endmembers extracted from compact high/low-rise building zone and natural surfaces are geographically scattered, with some partially missing and incomplete, presumably due to hue and texture variations. Owing to the shadow effect, forests are divided into sunny sides and shadow sides, given their different spectral characteristics (see )).
In general, the endmember combinations conform well with the urban environment, and diverse endmember classes were adopted to synthesize spatially varied endmember spectra. The positive effect of synthesized endmember spectra has been proven in the literature (Deng and Wu Citation2013). In this study, we tested the radius of the search window from 21 to 71, with 10 as an interval, referring to the literature (Deng and Wu Citation2013). Spatially varied endmember spectra were synthesized using EquationEquation (2)(2)
(2) with a window of 51 ×51 and 31 ×31 pixels for Wuhan and Wuzhou, respectively. In other words, the endmember spectra were localized through spectra of neighboring pixels in a local search window. Further, impervious surface abundance was calculated following EquationEquation (4)
(4)
(4) using the synthesized endmember spectra. Finally, various endmember classes and localizing spatially varied endmember spectra were employed to reduce confusion between spectrally similar classes, aiming to estimate impervious surface abundance in an accurate manner.
4.3. Spatial distribution of impervious surfaces
display the visual comparison of the impervious surface abundance from our proposed method, HSMA, and FSMA of Wuhan and Wuzhou, to illustrate the effectiveness of endmember classes and their spatially varied endmember spectra in unmixing. show a sketch map of HSMA, the proposed method, and FFSMA in the first, second, and third quadrants. The fourth quadrants of ) present the color bars. In general, the spatial distribution of impervious surfaces aligned well with the known land cover/use distribution for Wuhan and Wuzhou. High abundances of impervious surfaces were found in the central business district and heavily populated areas, which are largely made of cement, concrete, and asphalt. The low-density impervious surfaces, in contrast, were found in the suburban areas that primarily consist of forests, fallow, and low-rise buildings.
Figure 8. The impervious surface abundance of Wuhan in Landsat OLI using (a) the proposed method, (b) HSMA, (c) FFSMA; The first, second and third quadrants of (d) are the sketch maps of HSMA, the proposed method, and FFSMA; the fourth quadrant is the color bar.
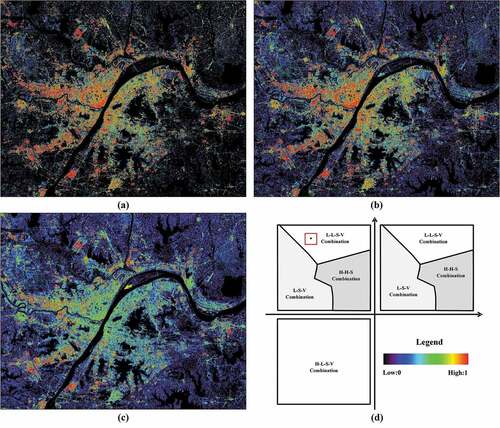
Figure 9. The impervious surface abundance of Wuhan in GF-1 WVF using (a) the proposed method, (b) HSMA, (c) FFSMA; The first, second, and third quadrants of (d) are the sketch maps of HSMA, the proposed method, and FFSMA; the fourth quadrant is the color bar.
The urban landscapes of the two study sites are different. Developed from a relatively early time and having experienced a long expansion process, Wuhan is in a mature stage, as it was developed from a relatively early time and has experienced a long expansion process. The artificial buildings of Wuhan consist of mostly compact high/low-rise buildings and large low-rise industrial buildings. In comparison, Wuzhou is still in its earlier stage of development, and its urban sprawling areas (e.g. compact high-rise building zone and industrial zone) are located in the west and south of the city. According to our field survey, the compact low-rise building zone of Wuzhou is covered by QiLou, a unique two-storied structure.
We conducted a quantitative analysis in this study to evaluate the performance of the proposed method (). In particular, quantitative assessments were conducted not only for the whole study area but also for less-developed areas and developed areas specifically. The developed areas were defined as the zones where impervious surface abundance was equal or over 30%. The less-developed areas, on the contrary, were defined as the zones where impervious surface abundance was less than 30%. These accuracy measurements indicate that the proposed method has achieved an excellent performance in estimating impervious surface abundance for Wuhan and Wuzhou sites, respectively with MAE = 8.19% and 7.88%, SE = −3.25% −1.70%, whilst RMSE = 10.63% and 11.19%. In addition, better performance is found in less developed areas in both study areas (e.g. MAE = 5.24% and 4.68%, SE = 4.07% and 3.14%, RMSE = 4.89% and 5.20%), when compared to developed areas (e.g. MAE = 9.73% and 9.37%, SE = −7.09% and −3.94%, RMSE = 10.57% and 12.23%).
Table 1. Accuracy assessment of impervious surfaces with the proposed method, HSMA, and FFSMA
4.4. Comparative analysis
In our proposed method, we first partitioned the whole image into three landscapes and took advantage of the appropriate endmember combinations extracted from each landscape for impervious surface estimation. To evaluate its effectiveness, we compared the proposed method with FFSMA and HSMA via visual comparison and quantitative assessment.
For better comparison purposes, a series of suburban and urban impervious surface abundances are displayed in to demonstrate how the spatially varied endmember spectra and hierarchical strategy could improve the performances of impervious surface estimation. The first column of represents the original image. The second to the fourth column of are the estimated impervious surface abundances of the proposed method, HSMA, and FFSMA, respectively. display urban landscape on the urban-rural gradient. ) show inner-city regions that are largely covered by compact low/high-rise buildings. present regions that are undergoing construction. are rural areas covered by crops and forests. These subsets are typical representatives of urban features from our two study sites and were selected to demonstrate the effectiveness of the proposed method.
Figure 10. The impervious surface abundance of the suburban and urban subsets in Wuhan using the proposed method, HSMA, and FFSMA.
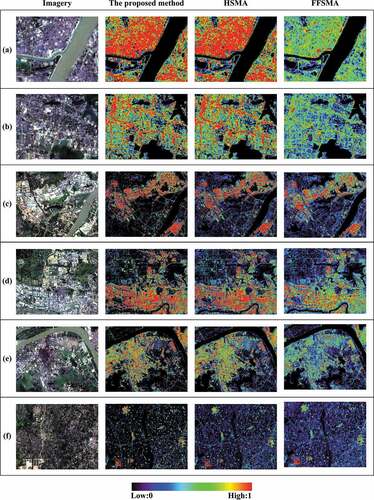
Figure 11. The impervious surface abundance of the suburban and urban subsets in Wuzhou using the proposed method, HSMA, and FFSMA.
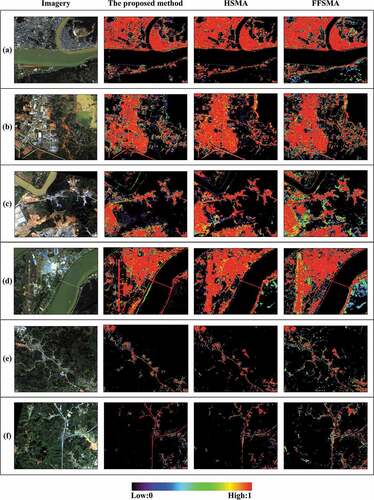
Quantitative measurements can be found in . For the whole study area, the proposed method outperforms FFSMA and HSMA in both Wuhan and Wuzhou sites. For the developed areas however, the proposed method has slightly lower RMSE than HSMA. In less-developed areas, our proposed method and HSMA perform considerably better than FFSMA. In summary, our proposed method is able to achieve a more accurate estimation of impervious surfaces.
5. Discussion
Despite that studies on spectral-only unmixing began about a decade ago, spectral methods incorporating both endmember class variations and spatially varied endmember spectra are still underexploited. In this session, we discuss the importance of endmember types variability and spatially varied endmember spectra.
5.1. The importance of hierarchization
The evaluation of the effectiveness of hierarchization can be achieved by comparing the proposed method and HSMA with FFSMA. Generally, FFSMA tends to underestimate impervious surfaces in urban areas and overestimate impervious surfaces in suburban areas. Specifically, the performances of our method and HSMA are considerably better than FFSMA in low/mid-high impervious surface area (see ). RMSE, MAE, and SE of the proposed method and HSMA in the less-developed area have better accuracy than developed area, and the values of assessment indices are much lower than both less-developed and developed area of FFSMA. The estimated impervious surface abundance is generally greater than zero in pixels of suburban areas where the true impervious surface abundance should be zero (Song Citation2005). FFSMA tends to overestimate impervious surface abundances, as it applies a fixed four endmember combination to all pixels in SMA. Studies have suggested that the endmember class diversity is essential for mapping impervious surfaces (Li Citation2017; Heiden et al. Citation2012). When partitioning the image into three regions and considering an appropriate endmember combination in each region, the actual number and types of endmember classes can address the variability in land cover types, thus effectively reducing residuals and leading to satisfactory results.
In addition, we found that the impervious surface of the downtown area is more likely to be underestimated in FFSMA (see )). Unlike suburban areas, urban environment comprises relatively complex artificial materials, including asphalt, concrete, metal, and tiles. When dealing with such heterogeneous landscapes, ignoring endmember variability inevitably leads to impervious surface underestimation. Our results suggest that the consideration of endmember variability effectively improves the accuracy of impervious surface abundance using a hierarchical strategy. Further quantitative measurements have also demonstrated the importance of hierarchical strategy in urban impervious surface estimation. The overall MAE, SE, and RMSE of the proposed method and HSMA are considerably lower than FFSMA by approximately 5%, −2.57%, and 5.99%, respectively. Compared with FFSMA, the RMSE (average value of RMSE reduction of Wuhan and Wuzhou) of the proposed method and HSMA in the developed area is reduced by approximately 4.08% and 2.53%, respectively, while RMSE in the less-developed area is reduced by 1.16% and 0.63%, respectively.
5.2. The importance of spatially varied endmember spectra
The effectiveness of spatially varied endmember spectra was assessed by comparing the proposed method with HSMA. The proposed method matches the spatial characteristics of the ground surface in a more consistent manner and is able to remove the misclassification of impervious surfaces from mixed-vegetation-soil areas (see ). For natural surroundings, both FFSMA and HSMA severely overestimate impervious surfaces. Bare soil with sparse vegetation is the primary error source of impervious surface overestimation, given its similar spectrum to low albedo impervious surfaces. In ), the impervious surface abundance of the steel plants of Wuhan (in the center of )) is notably underestimated by FFSMA and HSMA, possibly due to the existence of intra-class variations between low albedo impervious surfaces (e.g. tile and dark cement). Local endmember spectra synthesized via neighboring spectra are more appropriate to reduce the impact of intra-class variation rather than global endmember spectra used in HSMA. Thus, spatially varied endmember spectra in unmixing are preferred in impervious surfaces estimation.
We re-tracked the location of the endmember classes and found that easily-confused land cover types were mainly partitioned into separate regions. Specific endmember combinations were selected according to regional biophysical characteristics. Also, endmember signatures were generated by localizing the spatial variation of endmember classes via neighborhood information. Consequently, the proposed method considers the variability of endmember combinations in different regions and takes spatially varied endmember spectra into account in the unmixing. Thus, the proposed method mitigates the issue that the spectral-only mixture analysis inadequately deals with within-class spectral variability. Further quantitative measurements also show that the proposed method performs better than HSMA in terms of the whole study area, with comparable accuracy improvement in less-developed and developed areas.
5.3. Further study
Although the proposed method has achieved a satisfactory performance for mapping impervious surfaces, some limitations still exist. For instance, we observe that our proposed method shows a slight underestimation for impervious surfaces surrounded by vegetation (e.g. scattered houses in suburban areas). In addition, lush vegetation can be easily extracted as endmembers. As a result, the spectral of vegetation endmember could have a heavier weight on unmixing, thus leading to impervious surface underestimation. Moreover, in the Wuzhou sites () where the types of soil are laterite and stony soil, estimation errors occur as stony soil has high reflectance and is fractionally confused with high albedo impervious surfaces (e.g. concrete, tile). Studies have shown that contextual and topological knowledge can benefit endmember extraction and selection of endmember combinations for accurate impervious surface estimation (Du et al. Citation2014; Zhang Citation2008). Therefore, further efforts can be made to explore the utility of such information on unmixing.
We also found other unexpected results in ). Transportation lines are usually expected to have a high impervious surface abundance (see )). However, the transportation lines in Wuzhou sites ()) present considerably low impervious surface abundance. This phenomenon could be explained by the varying characteristics of transportation lines between these two cities. Unlike the transportation lines of Wuhan with six lanes of overhead roads and extra four lanes on the ground, the transportation lines in Wuzhou are four-lane roads bordered by lush trees, thereby causing an underestimation. Challenges still remain to capture the spectral information of impervious surfaces under the tree cover. We believe supplementary geographic information and street view data that offer ground observations might overcome the spectral deficiency of impervious surfaces (Shao et al. Citation2020b, Citation2021). Further efforts can be made to improve the mapping of covered impervious surfaces by incorporating Geographic Information Systems information and street view data (Chen et al. Citation2021; Guo et al. Citation2021).
6. Conclusions
SMA has been widely employed in analyzing urban environments, but challenges still remain to accurately estimate impervious surfaces in complex urban scenes In this study, we propose an extended SMA that integrates hierarchical strategy and spatially varied endmember spectra for impervious surface estimation. We compare the performance of the proposed method, HSMA, and FFSMA via visual comparison and quantitative assessment.
Built upon the initial LCAs estimated by the PCOMMEND method, the proposed method characterizes the urban landscape into three regions. Appropriate endmember combinations are independently introduced for each region. With the incorporation of the hierarchical strategy, the proposed method considers three endmember combinations where each endmember combination has three/four endmember classes. Thus, the diversity of endmember classes is expanded to minimize intra-class variation. Both visual comparison and accuracy assessment indicate that the proposed method has significantly improved the performance for the entire study area in general, especially in less developed areas. Furthermore, spatially varied endmember spectra are synthesized through neighboring spectra. The proposed method incorporates local endmember spectra into SMA, aiming to reduce the impact of intra-class variation. Additional comparative analyses indicate that the proposed method achieves a satisfactory performance when compared to HSMA, especially in the developed areas.
In summary, this study shows that the endmember class diversity and spatially varied endmember spectra can effectively improve impervious surface estimation. First, we find that the hierarchical strategy is able to expand endmember classes and develop appropriate endmember combinations. The proposed method incorporates the hierarchical strategy into SMA, thus enhancing its ability to handle diverse land cover types. Second, assisted by spatially varied endmember spectra, estimation errors can be reduced in heterogeneous surface materials, especially in complicated urban fabrics. Finally, this study provides scientific evidence to support land use/land cover unmixing. Accurate abundance estimations derived from the proposed method can be used to support urban landscape management.
Acknowledgments
Acknowledgement for the data support from “ Institute of Soil Science, Chinese Academy of Sciences. (http://vdb3.soil.csdb.cn)”
Disclosure statement
No potential conflict of interest was reported by the author(s).
Data availability statement
The data that support the findings of this study are available from the corresponding author, upon reasonable request.
Additional information
Funding
Notes on contributors
Zhenfeng Shao
Yuan Zhang received her B.S. degree at the School of Geosciences and Info-physics, Central South University. She is currently now pursuing her PhD degree at the State Key Laboratory of Information Engineering in Surveying, Mapping and Remote Sensing, Wuhan University. Her research interests include spatial data analysis and remote sensing applications.
Yuan Zhang
Zhenfeng Shao received the PhD degree in photogrammetry and remote sensing from Wuhan University in 2004. Since 2009, he has been a Full Professor with the State Key Laboratory of Information Engineering in Surveying, Mapping and Remote Sensing (LIESMARS), Wuhan University. He has authored or coauthored over 70 peer-reviewed articles in international journals. His research interests include high-resolution image processing, pattern recognition, and urban remote sensing applications. Since 2019, he has served as an Associate Editor of the Photogrammetric Engineering & Remote Sensing (PE & RS) specializing in smart cities, photogrammetry and change detection. He was the recipient of the Talbert Abrams Award for the Best Paper in Image matching from the American Society for Photogrammetry and Remote Sensing in 2014, the New Century Excellent Talents in University from the Ministry of Education of China in 2012.
Cheng Zhang
Cheng Zhang received her B.S. degree at the School of Geodesy and geomatics, Wuhan University. She is currently a Ph.D. student at the State Key Laboratory of Information Engineering in Surveying, Mapping and Remote Sensing, Wuhan University. Her research interests include spatial data analysis and the applications of deep learning in remote sensing.
Xiao Huang
Xiao Huang received his PhD degree in Geography from the University of South Carolina in 2020. He is currently an Assistant Professor in the Department of Geosciences at the University of Arkansas, with his expertise in GeoAI, deep learning, big data, remote sensing, and social sensing.
Tao Cheng
Tao Cheng received his M.S. degree in photogrammetry and remote sensing from Wuhan University in 2017. He is now pursuing his PhD degree in photogrammetry and remote sensing at Wuhan University. His research interests include spatial data analysis and remote sensing applications based on deep learning.
References
- Asner, G.P., and K.B. Heidebrecht. 2010. “Spectral Unmixing of Vegetation, Soil and Dry Carbon Cover in Arid Regions: Comparing Multispectral and Hyperspectral Observations.” International Journal of Remote Sensing 23 (19): 3939–3958. doi:10.1080/01431160110115960.
- Chang, C., and B. Ji. 2006. “Weighted Abundance-constrained Linear Spectral Mixture Analysis.” IEEE Transactions on Geoscience and Remote Sensing 44 (2): 378–388. doi:10.1109/TGRS.2005.861408.
- Chen, L., F. Rottensteiner, and C. Heipke. 2021. ”Feature detection and description for image matching: from hand-crafted design to deep learning.” Geo-Spatial Information Science 24 (1):58–74. doi:10.1080/10095020.2020.1843376
- Degerickx, J., D.A. Roberts, and B. Somers. 2019. “Enhancing the Performance of Multiple Endmember Spectral Mixture Analysis (MESMA) for Urban Land Cover Mapping Using Airborne Lidar Data and Band Selection.” Remote Sensing of Environment 221: 260–273. doi:10.1016/j.rse.2018.11.026.
- Deng, C., and C. Wu. 2013. “A Spatially Adaptive Spectral Mixture Analysis for Mapping Subpixel Urban Impervious Surface Distribution.” Remote Sensing of Environment 133: 62–70. doi:10.1016/j.rse.2013.02.005.
- Du, P., S. Liu, P. Liu, K. Tan, and L. Cheng. 2014. “Sub-pixel Change Detection for Urban Land-cover Analysis via Multi-temporal Remote Sensing Images.” Geo-Spatial Information Science 17 (1): 26–38. doi:10.1080/10095020.2014.889268.
- Eches, O., N. Dobigeon, and J. Tourneret. 2010. “Estimating the Number of Endmembers in Hyperspectral Images Using the Normal Compositional Model and a Hierarchical Bayesian Algorithm.” IEEE Journal of Selected Topics in Signal Processing 4 (3): 582–591. doi:10.1109/JSTSP.2009.2038212.
- Fan, F., and Y. Deng. 2014. “Enhancing Endmember Selection in Multiple Endmember Spectral Mixture Analysis (MESMA) for Urban Impervious Surface Area Mapping Using Spectral Angle and Spectral Distance Parameters.” International Journal of Applied Earth Observation and Geoinformation 33: 290–301. doi:10.1016/j.jag.2014.06.011.
- Fan, F., and Y. Deng. 2015. “Corrigendum to “Enhancing Endmember Selection in Multiple Endmember Spectral Mixture Analysis (MESMA) for Urban Impervious Surface Area Mapping Using Spectral Angle and Spectral Distance Parameters”.” International Journal of Applied Earth Observation and Geoinformation 36: 103–105. doi:10.1016/j.jag.2014.11.004.
- Fernández-Manso, A., C. Quintano, and D. Roberts. 2012. “Evaluation of Potential of Multiple Endmember Spectral Mixture Analysis (MESMA) for Surface Coal Mining Affected Area Mapping in Different World Forest Ecosystems.” Remote Sensing of Environment 127: 181–193. doi:10.1016/j.rse.2012.08.028.
- Foody, G.M., and D.P. Cox. 1994. “Sub-pixel Land Cover Composition Estimation Using a Linear Mixture Model and Fuzzy Membership Functions.” International Journal of Remote Sensing 15 (3): 619–631. doi:10.1080/01431169408954100.
- Franke, J., D.A. Roberts, K. Halligan, and G. Menz. 2009. “Hierarchical Multiple Endmember Spectral Mixture Analysis (MESMA) of Hyperspectral Imagery for Urban Environments.” Remote Sensing of Environment 113 (8): 1712–1723. doi:10.1016/j.rse.2009.03.018.
- Gao, Y., J. Cheng, H. Meng, and Y. Liu. 2019. “Measuring Spatio-temporal Autocorrelation in Time Series Data of Collective Human Mobility.” Geo-Spatial Information Science 22 (3): 166–173. doi:10.1080/10095020.2019.1643609.
- Guo, M., Y. Zhou, J. Zhao, T. Zhou, B. Yan, and X. Huang. 2021. ”Urban Geospatial Information Acquisition Mobile Mapping System based on close-range photogrammetry and IGS site calibration.” Geo-Spatial Information Science 24 (4):558–579. doi:10.1080/10095020.2021.1924084
- Heiden, U., W. Heldens, S. Roessner, K. Segl, T. Esch, and A. Mueller. 2012. “Urban Structure Type Characterization Using Hyperspectral Remote Sensing and Height Information.” Landscape and Urban Planning 105 (4): 361–375. doi:10.1016/j.landurbplan.2012.01.001.
- Herold, M., and D. Roberts. 2005. “Spectral Characteristics of Asphalt Road Aging and Deterioration: Implications for Remote-sensing Applications.” Applied Optics 44 (20): 4327–4334. doi:10.1364/AO.44.004327.
- Hsieh, P., L.C. Lee, and N. Chen. 2001. “Effect of Spatial Resolution on Classification Errors of Pure and Mixed Pixels in Remote Sensing.” IEEE Transactions on Goscience and Remote Sensing 39 (12): 2657–2663. doi:10.1109/36.975000.
- Hu, X., and Q. Weng. 2009. “Estimating Impervious Surfaces from Medium Spatial Resolution Imagery Using the Self-organizing Map and Multi-layer Perceptron Neural Networks.” Remote Sensing of Environment 113 (10): 2089–2102. doi:10.1016/j.rse.2009.05.014.
- Huang, X., A. Liu, and J. Li. 2021. ”Mapping and analyzing the local climate zones in China’s 32 major cities using Landsat imagery based on a novel convolutional neural network.” Geo-Spatial Information Science 24 (4):528–557. doi:10.1080/10095020.2021.1892459
- King, R.L., and N.H. Younan. 2006. “Pixel Unmixing via Information of Neighboring Pixels.” Giscience and Remote Sensing 43 (4): 310–322. doi:10.2747/1548-1603.43.4.310.
- Li, W., and C. Wu. 2014. “Phenology-based Temporal Mixture Analysis for Estimating Large-scale Impervious Surface Distributions.” International Journal of Remote Sensing 35 (2): 779–795. doi:10.1080/01431161.2013.873147.
- Li, W., and C. Wu. 2015. “A Geostatistical Temporal Mixture Analysis Approach to Address Endmember Variability for Estimating Regional Impervious Surface Distributions.” Giscience and Remote Sensing 53 (1): 102–121. doi:10.1080/15481603.2015.1118975.
- Li, W., and C. Wu. 2017. “A Geographic Information-Assisted Temporal Mixture Analysis for Addressing the Issue of Endmember Class and Endmember Spectra Variability.” Sensors 17 (3): 624. doi:10.3390/s17030624.
- Li, W. 2017. “Examining the Importance of Endmember Class and Spectra Variability in Unmixing Analysis for Mapping Urban Impervious Surfaces.” Advances in Space Research 60 (11): 2389–2401. doi:10.1016/j.asr.2017.09.019.
- Li, W. 2019. “Mapping Urban Impervious Surfaces by Using Spectral Mixture Analysis and Spectral Indices.” Remote Sensing 12 (1): 94. doi:10.3390/rs12010094.
- Li, Z., L. Jiao, B. Zhang, G. Xu, and J. Liu. 2021. “Understanding the pattern and mechanism of spatial concentration of urban land use, population and economic activities: a case study in Wuhan, China.” Geo-Spatial Information Science 24 (4):678–694. doi:10.1080/10095020.2021.1978276
- Liu, F., X. Zhang, Y. Murayama, and T. Morimoto. 2020. “Impacts of Land Cover/Use on the Urban Thermal Environment: A Comparative Study of 10 Megacities in China.” Remote Sensing 12 (2): 307. doi:10.3390/rs12020307.
- Liu, T., and X. Yang. 2013. “Mapping Vegetation in an Urban Area with Stratified Classification and Multiple Endmember Spectral Mixture Analysis.” Remote Sensing of Environment 133: 251–264. doi:10.1016/j.rse.2013.02.020.
- Long, Y., B. Rivard, and D. Rogge. 2020. “Incorporating Band Selection in the Spatial Selection of Spectral Endmembers.” International Journal of Applied Earth Observation and Geoinformation 84: 101957. doi:10.1016/j.jag.2019.101957.
- Mei, S., M. He, Z. Wang, and D. Feng. 2010. “Spatial Purity Based Endmember Extraction for Spectral Mixture Analysis.” IEEE Transactions on Geoscience and Remote Sensing 48 (9): 3434–3445. doi:10.1109/TGRS.2010.2046671.
- Powell, R., D. Roberts, P. Dennison, and L. Hess. 2007. “Sub-pixel Mapping of Urban Land Cover Using Multiple Endmember Spectral Mixture Analysis: Manaus, Brazil.” Remote Sensing of Environment 106 (2): 253–267. doi:10.1016/j.rse.2006.09.005.
- Powell, R.L., and D.A. Roberts. 2008. “Characterizing Variability of the Urban Physical Environment for a Suite of Cities in Rondônia, Brazil.” Earth Interactions 12 (13): 1–32. doi:10.1175/2008EI246.1.
- Rashed, T., J.R. Weeks, D. Roberts, J. Rogan, and R. Powell. 2003. “Measuring the Physical Composition of Urban Morphology Using Multiple Endmember Spectral Mixture Models.” Photogrammetric Engineering and Remote Sensing 69 (9): 1011–1020. doi:10.14358/PERS.69.9.1011.
- Ridd, M.K. 1995. “Exploring a V-I-S (Vegetation-impervious Surface-soil) Model for Urban Ecosystem Analysis through Remote Sensing: Comparative Anatomy for Cities.” International Journal of Remote Sensing 16 (12): 2165–2185. doi:10.1080/01431169508954549.
- Roberts, D.A., M. Gardner, R. Church, S. Ustin, G. Scheer, and R.O. Green. 1998. “Mapping Chaparral in the Santa Monica Mountains Using Multiple Endmember Spectral Mixture Models.” Remote Sensing of Environment 65 (3): 267–279. doi:10.1016/S0034-4257(98)00037-6.
- Rogge, D.M., B. Rivard, J. Zhang, A. Sanchez, J. Harris, and J. Feng. 2007. “Integration of Spatial–spectral Information for the Improved Extraction of Endmembers.” Remote Sensing of Environment 110 (3): 287–303. doi:10.1016/j.rse.2007.02.019.
- Shao, Z., C. Li, D. Li, O. Altan, L. Zhang, and L. Ding. 2020b. “An Accurate Matching Method for Projecting Vector Data into Surveillance Video to Monitor and Protect Cultivated Land.” ISPRS International Journal of Geo-Information 9 (7): 448. doi:10.3390/ijgi9070448.
- Shao, Z., G. Cheng, D. Li, X. Huang, Z. Lu, and J. Liu. 2021. “Spatio-temporal-spectral-angular observation model that integrates observations from UAV and mobile mapping vehicle for better urban mapping.” Geo-Spatial Information Science 24 (4):615–629. doi:10.1080/10095020.2021.1961567
- Shao, Z., L. Ding, D. Li, O. Altan, M.E. Huq, and C. Li. 2020a. “Exploring the Relationship between Urbanization and Ecological Environment Using Remote Sensing Images and Statistical Data: A Case Study in the Yangtze River Delta, China.” Sustainability 12 (14): 5620. doi:10.3390/su12145620.
- Shao, Z., N.S. Sumari, A. Portnov, F. Ujoh, W. Musakwa, and P.J. Mandela. 2020c. “Urban Sprawl and Its Impact on Sustainable Urban Development: A Combination of Remote Sensing and Social Media Data.” Geo-Spatial Information Science 24 (2): 241–255. doi:10.1080/10095020.2020.1787800.
- Shi, C., and L. Wang. 2014. “Incorporating Spatial Information in Spectral Unmixing: A Review.” Remote Sensing of Environment 149: 70–87. doi:10.1016/j.rse.2014.03.034.
- Small, C., and J.W.T. Lu. 2006. “Estimation and Vicarious Validation of Urban Vegetation Abundance by Spectral Mixture Analysis.” Remote Sensing of Environment 100 (4): 441–456. doi:10.1016/j.rse.2005.10.023.
- Somers, B., G.P. Asner, L. Tits, and P. Coppin. 2011. “Endmember Variability in Spectral Mixture Analysis: A Review.” Remote Sensing of Environment 115 (7): 1603–1616. doi:10.1016/j.rse.2011.03.003.
- Somers, B., S. Delalieux, W.W. Verstraeten, J.A.N. van Aardt, G.L. Albrigo, and P. Coppin. 2010. “An Automated Waveband Selection Technique for Optimized Hyperspectral Mixture Analysis.” International Journal of Remote Sensing 31 (20): 5549–5568. doi:10.1080/01431160903311305.
- Song, C. 2005. “Spectral Mixture Analysis for Subpixel Vegetation Fractions in the Urban Environment: How to Incorporate Endmember Variability?” Remote Sensing of Environment 95 (2): 248–263. doi:10.1016/j.rse.2005.01.002.
- Sun, G., X. Chen, J. Ren, A. Zhang, and X. Jia. 2017. “Stratified Spectral Mixture Analysis of Medium Resolution Imagery for Impervious Surface Mapping.” International Journal of Applied Earth Observation and Geoinformation 60: 38–48. doi:10.1016/j.jag.2017.04.006.
- Trinder, J., and Q. Liu. 2020. “Assessing Environmental Impacts of Urban Growth Using Remote Sensing.” Geo-Spatial Information Science 23 (1): 20–39. doi:10.1080/10095020.2019.1710438.
- Wetherley, E.B., D.A. Roberts, and J.P. Mcfadden. 2017. “Mapping Spectrally Similar Urban Materials at Sub-pixel Scales.” Remote Sensing of Environment 195: 170–183. doi:10.1016/j.rse.2017.04.013.
- Wu, C., and A.T. Murray. 2003. “Estimating Impervious Surface Distribution by Spectral Mixture Analysis.” Remote Sensing of Environment 84 (4): 493–505. doi:10.1016/s0034-4257(02)00136-0.
- Wu, C. 2004. “Normalized Spectral Mixture Analysis for Monitoring Urban Composition Using ETM+ Imagery.” Remote Sensing of Environment 93 (4): 480–492. doi:10.1016/j.rse.2004.08.003.
- Wulder, M., and B. Boots. 1998. “Local Spatial Autocorrelation Characteristics of Remotely Sensed Imagery Assessed with the Getis Statistic.” International Journal of Remote Sensing 19 (11): 2223–2231. doi:10.1080/014311698214983.
- Yang, J., and Y. He. 2017. “Automated Mapping of Impervious Surfaces in Urban and Suburban Areas: Linear Spectral Unmixing of High Spatial Resolution Imagery.” International Journal of Applied Earth Observation and Geoinformation 54: 53–64. doi:10.1016/j.jag.2016.09.006.
- Yang, J., Y. He, and T. Oguchi. 2014. “An Endmember Optimization Approach for Linear Spectral Unmixing of Fine-scale Urban Imagery.” International Journal of Applied Earth Observation and Geoinformation 27: 137–146. doi:10.1016/j.jag.2013.09.013.
- Zare, A., and K.C. Ho. 2014. “Endmember Variability in Hyperspectral Analysis: Addressing Spectral Variability during Spectral Unmixing.” IEEE Signal Processing Magazine 31 (1): 95–104. doi:10.1109/MSP.2013.2279177.
- Zare, A., P. Gader, O. Bchir, and H. Frigui. 2013. “Piecewise Convex Multiple-Model Endmember Detection and Spectral Unmixing.” IEEE Transactions on Geoscience and Remote Sensing 51 (5): 2853–2862. doi:10.1109/TGRS.2012.2219058.
- Zhang, C., L. Ma, J. Chen, Y. Rao, Y. Zhou, and X. Chen. 2019. “Assessing the Impact of Endmember Variability on Linear Spectral Mixture Analysis (LSMA): A Theoretical and Simulation Analysis.” Remote Sensing of Environment 235: 111471. doi:10.1016/j.rse.2019.111471.
- Zhang, J., B. Rivard, and A. Sanchez-Azofeifa. 2004. “Derivative Spectral Unmixing of Hyperspectral Data Applied to Mixtures of Lichen and Rock.” IEEE Transactions on Goscience and Remote Sensing 42 (9): 1934–1940. doi:10.1109/TGRS.2004.832239.
- Zhang, J., C. He, Y. Zhou, S. Zhu, and G. Shuai. 2014. “Prior-knowledge-based Spectral Mixture Analysis for Impervious Surface Mapping.” International Journal of Applied Earth Observation and Geoinformation 28: 201–210. doi:10.1016/j.jag.2013.12.001.
- Zhang, Y.Y.J.F. 2008. “Fractal Features of Urban Morphology and Simulation of Urban Boundary.” Geo-Spatial Information Science 11 (2): 121–126. doi:10.1007/s11806-008-0032-9.
- Zhang, Z., C. Liu, J. Luo, Z. Shen, and Z. Shao. 2015. “Applying Spectral Mixture Analysis for Large-scale Sub-pixel Impervious Cover Estimation Based on Neighbourhood-specific Endmember Signature Generation.” Remote Sensing Letters 6 (1): 1–10. doi:10.1080/2150704X.2014.996677.
- Zhou, Y., E.B. Wetherley, and P.D. Gader. 2020. “Unmixing Urban Hyperspectral Imagery Using Probability Distributions to Represent Endmember Variability.” Remote Sensing of Environment 246: 111857. doi:10.1016/j.rse.2020.111857.