
 ?Mathematical formulae have been encoded as MathML and are displayed in this HTML version using MathJax in order to improve their display. Uncheck the box to turn MathJax off. This feature requires Javascript. Click on a formula to zoom.
ABSTRACT
With the undergoing and planned implementations of mega constellations of thousands of Low Earth Orbiting (LEO) satellites, space will become even more congested for satellite operations. The enduring effects on the long-term space environment have been investigated by various researchers using debris environment models. This paper is focused on the imminent short-term effects of LEO mega constellations on the space operation environment concerned by satellite owners and operators. The effects are measured in terms of the Close Approaches (CAs) and overall collision probability. Instead of using debris environment models, the CAs are determined from integrated orbit positions, and the collision probability is computed for each CA considering the sizes and position covariance of the involving objects. The obtained results thus present a clearer picture of the space operation safety environment when LEO mega constellations are deployed. Many mega constellations are simulated, including a Starlink-like constellation of 1584 satellites, four possible generic constellations at altitudes between 1110 km and 1325 km, and three constellations of 1584 satellites each at the altitudes of 650 km, 800 km, and 950 km, respectively, where the Resident Space Object (RSO) spatial density is the highest. The increases in the number of CAs and overall collision probability caused by them are really alarming. The results suggest that highly frequent orbital maneuvers are required to avoid collisions between existing RSOs and constellation satellites, and between satellites from two constellations at a close altitude, as such the constellation operation burden would be very heavy. The study is not only useful for satellite operators but a powerful signal for various stakeholders to pay serious attention to the development of LEO mega constellations.
1. Introduction
With the undergoing and planned implementations of mega constellations of Low Earth Orbiting (LEO) satellites, such as Starlink, the number of meter-size on-orbit objects will increase dramatically, leading to much more Close Approaches (CAs) between Resident Space Objects (RSOs) in space. As a result, more collisions between RSOs, even the Kessler Syndrome may occur, which may render the LEO region unusable for thousands of years (Kessler Citation1991; Rossi et al. Citation1997; Anselmo, Rossi, and Pardini Citation1999; Liou and Johnson Citation2008; Pardini and Anselmo Citation2014; Shen, Jin, and Chang Citation2014). The concern on the potentially more frequent collisions as severe as that between Iridium 33 and Cosmos 2251 in 2009 (Anselmo and Pardini Citation2009) is real for satellite owners, operators, and space communities. The study of Oltrogge and Alfano shows that the 2009 collision (happened at 790 km in altitude) could send debris fragments to orbit region as high as 26,000 km in altitude, while the GEO collision can send debris fragments down to the Earth’s surface and envelop much of the GEO belt within a day (Oltrogge and Alfano Citation2019). The potential collisions and space debris could affect not only the operating satellites such as BeiDou series, Gaofen series satellites (Hao et al. Citation2018; Zhong et al. Citation2021), but also the study and implementation of the LeGNSS (LEO enhanced global navigation satellite system) (Ge et al. Citation2021). This motivates the studies on the effects of mega LEO constellations on the imminent space operation safety and long-term space environment. Although it is generally known that the collision risk will increase significantly with the deployment of mega constellations, this paper is intended to depict a detailed and clear picture of the space operation environment over a short-time period of 1 week through the analysis of the close approaches between the RSOs and mega constellation satellites in the LEO region and associated collision probability. Several LEO mega constellations at various orbital altitudes and inclinations, which are more or less in agreement with those of the proposed mega constellations, are simulated. The results will further stress the need for coordinated and operational space environment management.
Through different perspectives and methods, many researchers have analyzed the long-term effects of mega constellations on the space environment. Assuming different mega constellation scenarios, Radtke et al. show that a mega constellation of 720 satellites at 1200 km in altitude would have a 35% probability to catastrophically fragment during the investigated mission lifecycle (over 8.5 years) by using the MASTER-2009 evolutionary debris model (Radtke, Kebschull, and Stoll Citation2017). Researches by May et al. indicate that the probability of at least one catastrophic collision in 5 years involving a spacecraft from OneWeb or SpaceX, is 5.0% and 45.8%, respectively (Le May et al. Citation2018). Virgili et al. utilize four different tools to show that the accumulation of failed constellation satellites may become a catalyst for a detrimental population increase (Virgili et al. Citation2016). Based on ORDEM, the model of Foreman indicates that the orbital slots selected for the OneWeb constellation and the initial deployment of the SpaceX constellation likely cause 17.95 and 68.42 collisions with debris in 7 years, respectively (Foreman, Siddiqi, and De Weck Citation2017). Rossi et al. use tools developed at IFAC-CNR to analyze the collision risk between constellations and the clusters formed by massive derelict objects in the constellations, and find that the cumulative collision probability for OneWeb-like and Starlink-like constellations will be and
over 20 years from 2020 to 2040, respectively (Rossi, Petit, and McKnight Citation2020). The Future Constellations Model (FCM) created by the Aerospace Corporation shows that almost all collisions occur because of failed systems (Muelhaupt et al. Citation2019).
Apart from the long-term effect, the short-term risk from thousands of LEO satellites put into space over a relatively short time period may be highly alarming, exampled by the forced orbit maneuver of an ESA satellite Aeolus at 320 km, which was maneuvered on 2 September 2019 to avoid a collision with Starlink-44 (Foust, Citation2020a). Muelhaupt et al. use the FCM to show that a simulated constellation (of 1225 satellites distributed in 35 planes in circular orbits at 1000 km altitude, at 98° inclination) will cause a few warnings to 6 simulated satellites (circular orbits at the same altitude, at 63° inclination) in a month (Muelhaupt et al. Citation2019), which is really alarming. Using the CUBE model in the SDM (Space debris mitigation), the short-term (30 days) close approaches within 4 “clusters” are also presented in Section 5 of the paper by Rossi et al (Liou Citation2006; Rossi, Petit, and McKnight Citation2020). The CUBE method to determine close approaches is to first uniformly sample circumterrestrial system in space and time and then discretize the space into small cubes. If two objects are in the same cube, a close approach is determined. In the computation of Rossi et al, “a very short time step of 1s is adopted for the orbital propagation” and a cube with the typical size of 10 km is used (Rossi, Petit, and McKnight Citation2020).
It is worth noting that researchers use the space object spatial density obtained from a space environment model such as MASTER-2009 (in Radtke et al., May et al. and Rossi et al.) and ORDEM (Foreman et al.) to calculate the collision probability in all the papers mentioned above. The methodology of these methods is similar, which is to multiply the spatial density around a space object by the collision volume to obtain the mean number of collisions and collision probability (Liou Citation2006; Foreman, Siddiqi, and De Weck Citation2017; Radtke, Kebschull, and Stoll Citation2017; Le May et al. Citation2018; Rossi, Petit, and McKnight Citation2020). However, the research on the short-term imminent effects of mega constellations on space operation environment is largely unfound, which is the first motivation of this paper (Again, only collision risk between satellites in constellations is studied in the paper of Rossi et al (Rossi, Petit, and McKnight Citation2020)). A detailed and clear picture of the space operation environment following deployments of mega LEO constellations can present important information to satellite/constellation owners and operators. The second motivation is that, although using object spatial density to evaluate the long-term effect is effective, a more accurate approach is required to obtain robust CA and collision risk results over the short term. The velocity of RSOs can reach 7.8 km/s and the average relative velocity is around 10 km/s (Boley and Byers Citation2021). Given high relative velocity between two LEO objects, the use of a time step of 1 s to determine CA would result in many missed CAs. In addition, using the spatial density to compute the collision probability mainly results in statistical results. It is better to consider the object characteristics (i.e. position, velocity, size and covariance) to obtain more accurate and reliable results.
The largest publicly available RSO catalog is the US Space Command 18th Space Control Squadron (USSPACECOM) catalog that contains more than 20,000 RSOs, mostly larger than 10 cm in diameter, with about 76.08% being LEO ones (Apogee below than 2000 km of altitude) (Kelso Citation2019). These RSOs consist of operational satellites, spent rocket bodies, and debris. The RSO spatial density is highest at the altitude of about 800 km, and there are also two little peaks at around 500 km and 1400–1500 km, respectively. There are also many smaller RSOs whose orbital information is not available. Since the number of satellites in a single mega LEO constellation would easily be more than a thousand, multiple such mega constellations would increase the spatial density of LEO RSOs larger than 10 cm by a significant percentage.
The great potential of mega LEO constellations for communications has prompted many mega constellation programs. presents information of several major constellations available from the Federal Communications Commission (FCC) and the International Telecommunication Union (ITU). We note that the full Hongyan constellation may consist of 324 satellites. In addition, the information of 2 Chinese mega constellations, “GW-A59” and “GW-2”, is obtained from ITU, and their official names are not known. The “GW-A59” and “GW-2” are the application codes.
Table 1. The number and orbit of several mega constellations
Starlink is the well-known mega constellation under deployment. According to the plan of Starlink submitted by the SpaceX company to the FCC, the whole Starlink constellation comprises 4 sub-constellations in various altitudes, including satellites within altitude from 540 km to 570 km(FCC.report). As of 24 October 2020 895 Starlink satellites have been put into orbit as part of the initial Starlink program (Foust Citation2020b). More detailed orbital information of Starlink is given in the relevant section.
Given multiple operational mega constellations, this research tries to figure out exactly how many CAs there are and how high the overall collision probability involving the constellation satellites is over a short term, typically 1 week in view of satellite operators. For this purpose, instead of sampling circumterrestrial system in space and time to obtain CAs and collision probabilities, we take a conventional but robust approach. First, a time step of 0.01 s is used in the orbit propagation to ensure no CA is missed. Second, for each determined CA, the collision probability is computed using theoretically rigorous and efficient algorithm based on space compression and infinite series, in which the object characteristics such as size and position covariance are considered. The algorithms are presented in Section 2.
In this paper, the focus is on the increases in the number of CAs and collision warnings caused the insertion of mega LEO constellations over a time period of 1 week. Several mega constellations at various orbit altitudes, including a Starlink-link constellation, are considered, and their effects are assessed. Moreover, a hypothetical constellation with a high inclination (85°) at 800 km is simulated to study whether the high-inclination constellation has a greater impact on RSOs. At last, the inter-effects between two mega constellations at the same orbit altitude are studied.
The rest of this article starts with a brief introduction to the methodology of the CA and collision probability computation in Section 2. Next, situations of the CAs and collision probability in the existing space debris environment are presented. Then, the increases of CAs and collision probabilities caused by the mega constellations are presented and analyzed in Section 4. Finally, Section 5 concludes this paper.
2. Methodology of CA and Collision Probability Computation
2.1. Computation of CA
A CA occurs when the minimum distance between a primary object and a secondary object is less than a threshold at a time within a period of time
. Hence, the purpose of the CA computation is to determine the time of the closest approach (TCA)
and
. As mentioned above, the time step as small as possible is required to use in orbital propagation to ensure no CAs are missed. Considering all CAs between each pair of objects in more than 20 thousand objects needed to be determined, the computation time would be very long. In this paper, the Alfano and Negron (A-N) method is adopted to compute CA(Alfano and Negron Citation1993; Alfano Citation1994), which will reduce the computation time greatly while ensuring the calculation accuracy.
The position vectors of the primary object and the secondary object at time are assumed to be
and
, respectively. The relative position vector and its time derivatives are expressed as
where ,
, and
are the relative position vector, the first and second derivatives of the relative position vector, respectively.
A distance function and its time derivatives are then
where ,
, and
are the distance function, its first and second time derivatives, respectively.
The is the real root of
, if
and
. Dividing the time period
into
equal intervals, and for each interval, a cubic polynomial,
, is defined to represent the first derivative function. Thus, solving of the root of
is equivalent to finding the root of
. For an individual interval, if a real root exists, that is, there is a
that makes
and
, a minimum value of
is found in the interval. A few such time epochs may be found in the interval, and
is the epoch at that the distance is the minimum. The polynomial,
, for the i-th interval is expressed as
where ,
,
, and
are the coefficients;
is the normalized time variable.
The real root of
can be determined after the coefficients are obtained from the boundary equation.
can be expressed as
where is the number of intervals, and
is the duration of each interval.
For an interval, each of the three components of the relative position vector in the Earth-Centered Inertial (ECI) coordinate system is defined as a quintic polynomial
where ,
,
,
,
, and
are coefficients, which can be obtained from the boundary equation too.
Let and
be the quintic polynomials for the X, Y, and Z components, respectively. The minimum distance
is then
2.2. Collision probability computation
Assuming that the RSO position errors follow a three-dimensional Gaussian distribution, then the mean and covariance matrix of the Gaussian distribution fully describe the position uncertainty of RSOs. To compute the probability of collision between two RSOs, the following two hypotheses are usually made (Akella and Alfriend Citation2000)
The shape of an object is regarded as a sphere;
The relative motion of two objects is assumed to be linear during the close approach over a very short time, and the position covariances remain the same over the short time.
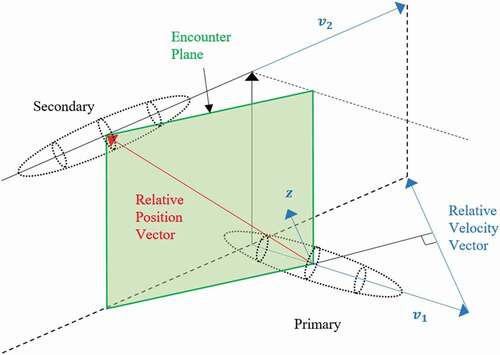
The collision probability at TCA is equivalent to the probability that the distance between the centers of two objects is less than the sum of the sphere radiuses of the two objects in the ECI coordinate system. The relative position vector is perpendicular to the relative velocity vector at TCA(Chan Citation1997). Therefore, the encounter coordinate system can be defined as follows: the position of primary is the origin and the
-axis parallel to the relative velocity vector. With that, the position of the secondary object must be in the
plane (encounter plane), as shown in .
Figure 1. The encounter plane of two objects(Zaidi and Hejduk Citation2016).
As the error distributions of the two objects are independent of each other, the combined covariance matrix and a combined sphere with the radius being the sum of the radiuses of the two objects can be generated. Then, the collision probability
in the three-dimensional space is equivalent to the probability that the distance between the two points is less than the combined radius
of the circle, which is the projected circle of the sphere onto the encounter plane (Alfano and Negron Citation1993)
where and
are the coordinates of the circle center. A rapid algorithm based on space compression and infinite series is used to compute this two-dimensional integration (Bai and Chen Citation2009). First, the above integral is converted into an integral with equal variance in the elliptic domain, as
where the compression coefficient , and
. Then, the elliptic integral domain is replaced by a circular domain with equal area, expressed as
To achieve the desirable computation accuracy and efficiency, the method based on space compression and infinite series is used to compute , in which only the first of the expanded terms is considered (Bai and Chen Citation2009). Thus,
is approximated as
where is the first term of the infinite series.
3. CA and collision probability situations in the existing debris environment
To assess the adversary effects due to mega constellations, it is necessary to compute the CAs and collision probability in the existing RSOs environment.
In the experiments, the CA threshold of the minimum distance between two RSOs is set at 5 km, a general standard to declare a CA event, and an interval duration of s is set to ensure the computation accuracy, which means, a week (
) is divided into 3024 intervals, and a cubic polynomial
is defined to find the real roots for each interval. The positions of the RSOs are computed using the USPACECOM TLE sets and the analytical SGP4 propagator (SpackTrack).
The computation of the collision probability between two RSOs at the TCA needs their radiuses, which could be estimated from their Radar Cross-Section (RCS) information. Satellite Situation Report (SSR) in the USPACECOM TLE catalog has 16,685 RSOs, all but 622 objects have the RCS information (SpaceTrack Citation2019). The relationship between object RCS and size is very complex. The Swelling fluctuation model and SEM model of Lincoln Laboratory are example models to estimate object size from its RCS (Lambour et al. Citation2004). However, the SSR only provides three RCS categories in Large, Medium, and Small for RSOs. In this paper, the radius of RSO is set to 3 m, 0.371 m, and 0.114 m with respect to the object of Large, Medium, and Small RCS, respectively. For those 662 RSOs without RCS information, their size is set to 0.1 m.
Considering the difficulty in the acquisition of covariance information for RSOs, fixed errors are set to 300 m, 100 m, and 100 m in the in-track, cross-track, and radial directions for each RSO, respectively. The collision probability threshold of NASA’s collision warning is set at 10−4 for the red warning and 10−5 for the yellow warning (Gavin Citation2010).
Computation of CAs and collision probability for the RSOs in the existing space debris environment over a short time period provides us a more specific picture of the existing space environment and a reference to assess the immediate effects of mega constellations. The CAs and the collision probability in the week starting from 24 May 2019 are computed, in which the TLEs of 17,347 RSOs are taken from the USSPACECOM catalog. gives the distribution of CAs that occur in the LEO region and the associated collision probabilities with respect to the orbit altitude.
Figure 2. The CA and collision probability distributions of the current space in the May 2019 week.
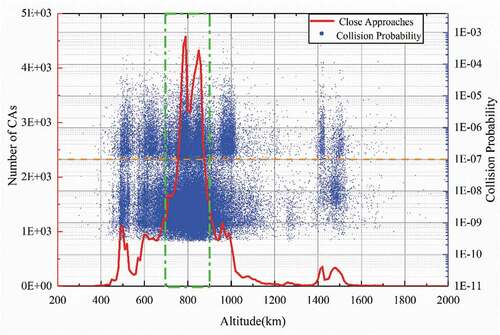
There are 92,663 CAs in total in the space over the May 2019 week. shows the CAs in the LEO region which accounts for 99.88% of all CAs in the space. Each blue dot represents a CA event that is associated to an altitude and a collision probability. The number of CAs (red line in ) increases with the altitude from around 550 km to 800 km, and then decreases from 850 km to 1400 km. Besides, there are two small peaks at altitudes around 550 km and 1400–1500 km. Understandably, such fluctuation of the red line is caused by the different object spatial density at different altitudes. The variation trend of CA number with altitude is consistent with that of the RSO spatial density given by Pardini and Anselmo (Pardini and Anselmo Citation2020).
In , it is seen that there is a line at the probability of separating the whole probability map into two areas. Taking CAs from 800 km to 900 km (CAs in the green box in ) in altitude as an example, it is believed that this separation is caused by the assumption on the combined radius of two RSOs. When all CAs in the green box are divided into 6 groups in terms of object size, we have groups of Large–Large (LL), Large-Medium (LM), Large-Small (LS), Medium–Medium (MM), Medium-Small (MS), and Small–Small (SS), which represent combinations of the primary and secondary objects of different sizes. The CA statistics of each group are computed and given in (where LN, MN, SN, and NN stand for CAs involving objects with no RCS data).
Table 2. Grouping CAs in the 800 km – 900 km altitude region in terms of RSO size
As seen from , the group LS accounts for more than 77% of CAs with the collision probability exceeding , and SS account for more than 79% of CAs with the probability less than
. Such statistics may suggest that, the object radius and the resulting CA grouping lead to the collision probabilities concentrated in two areas above and below the yellow separation line (
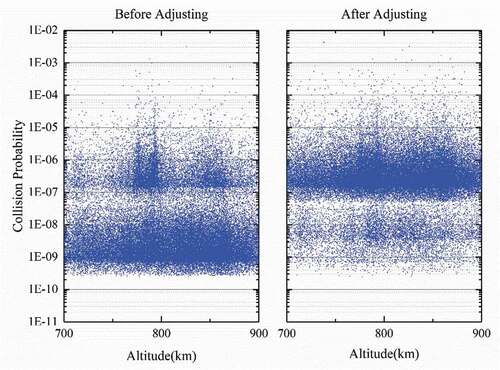
). This suggestion may be further illustrated by a small experiment, in which the collision probability associated to an SS CA is re-computed with the size of one of two small objects is set to large. The probability maps before and after the re-computation are shown in . As a result, the original collision probability area associated with SS CAs is moved up and merged into the area mostly representing the LS CA group.
Figure 3. Collision probability map before (left) and after (right) adjusting only one of two RSO sizes in the original SS CAs from small to large.
The above results are obtained for the week starting 24 May 2019. For the better understanding of the weekly changes of CAs over a relatively long time period, three other weeks, respectively, in August and November of 2018 and February of 2019 are chosen, and the CA numbers of the 4 weeks are summarized in , and the CA number distributions with the orbit altitude are shown in .
Figure 4. CAs in four weeks over a year.
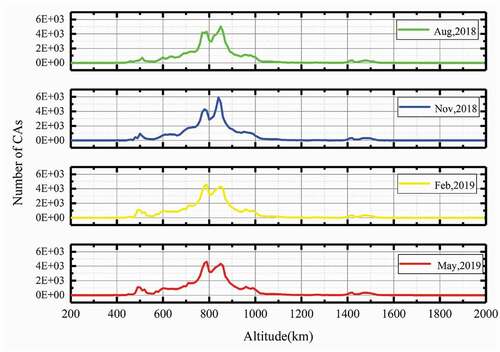
Table 3. Numbers of RSOs and CAs in the chosen representative 4 weeks
Judging from , it is seen that the numbers of RSOs and resulted CAs in these 4 weeks are very close. shows that the distributions of CAs with altitude in the 4 weeks are roughly the same. In the assessment of the effects of mega constellations, we will make experiments only with the week in May of 2019.
Apart from the CA grouping in terms of the RSO size (large, medium, or small), they can also be categorized according to the RSO type (satellite, rocket body, or debris), and the distributions are shown in .
Figure 5. Distributions of CAs according to RSO type and size. The left one is the CA distribution with respect to the RSO type, and the right one to the RSO size. Sat stands for satellites, R/B for rocket body, and Deb for debris.
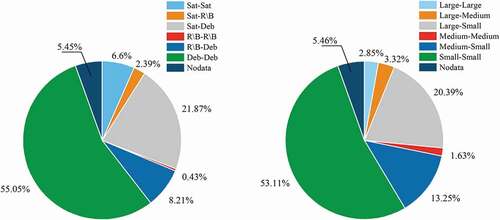
As seen from the left of , Deb–Deb CAs account for more than half of all CAs, and Sat-Deb CAs account for 21.87%, respectively. CAs involving debris account for 85.13% of all CAs, which is obviously due to the large proportion of debris among the RSOs. In the right of , Small–Small CAs and Large-Small CAs account for 53.11% and 20.39%, respectively, because RSOs are mostly Small. As a result, RSOs of Small size contribute to more than 85% of all CAs.
4. Effects of mega constellations on CA and collision probability in the existing space environment
In this section, several mega LEO constellations are simulated, and their effects on the CA and collision probability are assessed. The first one is a full Starlink-like constellation of 4409 satellites including 5 sub-constellations. In addition, two Chinese constellations that are Hongyun-like and Hongyan-like constellations comprising 156 and 60 satellites are simulated, respectively. Then, three hypothetical constellations at orbit altitudes of high spatial density in the LEO region are simulated to investigate their effects. Moreover, a hypothetical constellation with a high inclination (85°) at 800 km is simulated to study whether the high-inclination constellation has a greater impact on RSOs. At last, the inter-effects between two mega constellations at the same orbit altitude are investigated.
It is noted that, as far as the satellites in a constellation are functioning and controlled, there will be no collision between satellites in the same constellation. Therefore, no analysis is made to the collision between satellites in the same constellation.
4.1. Effects of the simulated Starlink-like constellation
4.1.1. Orbital simulation of mega constellations
The 5 constellations listed in are simulated according to the initial report of the Starlink constellation submitted to FCC in December 2018. We notice that the Starlink constellation has been changed in April 2021, with all the satellites are to be placed in the 540 km ~570 km altitude range. This paper still uses the 5 constellations in to study the effects of mega constellations at different altitudes.
Table 4. Design of simulated constellations
It is noted that CON.1 simulates the Starlink constellation at the orbit altitude of 550 km, CON.2 through CON.5 are possible generic constellations at altitudes between 1110 km and 1325 km. Each of the 5 constellations is of a Walker configuration.
To facilitate the computation of the CAs and collision probability, the positions of the Starlink-like satellites are needed. The TLEs at the initial time epoch of satellites in a sub-constellation are set as follows. First, the mean motion of a satellite is determined from the semi-major axis which is the sum of the sub-constellation altitude and the Earth radius. Then, the Right Ascension of Ascending Node (RAAN) of the first orbital plane of the sub-constellation, , is set according to the constellation design, and the perigee argument
of the first satellite in the first orbital plane is set to zero degrees. Therefore, the right ascension of the m-th plane,
, and perigee argument of the n-th satellite in the m-th plane,
, are
where and
are the numbers of the planes and the total satellites of Walker sub-constellation, respectively;
is the phase factor. Besides, the B* Drag coefficient for a satellite is set to either the value of an existing Starlink satellite or a typical value for a satellite at the Starlink-like sub-constellation altitude. Given the difficulty of obtaining the attitude of each satellite, we treat each satellite as a sphere, to ensure that the worst-case scenario (such as an uncontrolled tumbling satellite) is considered. In the computation, each Starlink-like satellite is assumed to be a sphere with its radius being 2 m.
4.1.2. Overall effects of the simulated Starlink-like constellation
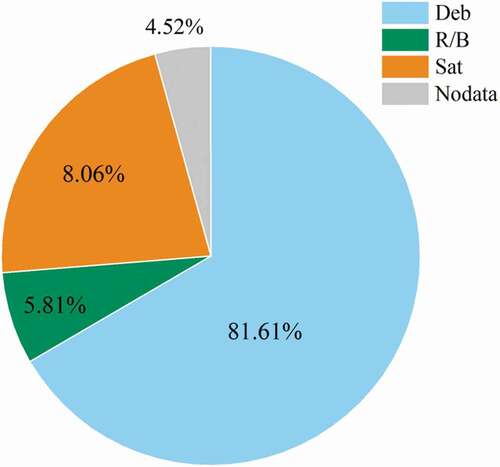
The combination of the simulated Starlink-like satellites with the cataloged RSOs on 24 May 2019 results in 108,217 CAs in the May week. Compared with the CAs without the simulated constellation, the number of CAs is increased by 15,554, with an increment of 16.79%. For each of the increased CAs, one object is an RSO, and the other is a Starlink-like satellite. Partitions of the increased CAs in terms of the RSO type are shown in . It is seen that space debris contributes to more than 80% of all the increased CAs over the week.
Figure 6. RSO partitions of CAs with Starlink-like constellation in the May 2019 week.
Besides, using the probability threshold of NASA’s collision warning for satellite, the number of CAs in the week that exceed the red warning threshold is increased from 72 to 111, while that exceeding the yellow warning threshold grows from 592 to 871 concerning because of the simulated constellation.
Although the CA number given above appears less concerning, an analysis on the collision probability will reveal more alarming numbers. One would be interested in the probability of a collision involving a Starlink-like satellite in a short time period, for example, 1 week. Such a probability could be computed as follows. Each CA associated with a Starlink-like satellite is regarded as an independent event, and its collision probability is denoted as . Then, the overall probability of at least one collision occurring over the week from CAs is computed as
where is the number of all CAs involving Starlink-like satellites.
It is accentuated that the probability computed using EquationEq (13)(13)
(13) does not take into account for the impact of the collision avoidance maneuvers by satellites. Accordingly, the overall collision probabilities without and with the Starlink-like constellation are 6.58% and 31.34% in the May week, respectively. The conclusion can be made that, the insertion of the full Starlink-like constellation results in the probability increase by 3.76 times, which means if there is no collision warning and avoidance maneuver operation, a satellite from the Starlink-like constellation is almost certainly to collide with one of RSOs in a few weeks. It is noted that the uncertainties in orbits (state covariances) and the properties (object sizes and shape) are assumed in the collision probability computation, which leads anyway to results that are “statistical”; however, the method used provides an alternative approach to assess the collision probability between the mega constellation and RSOs.
4.1.3. Effects of sub-constellations on RSOs
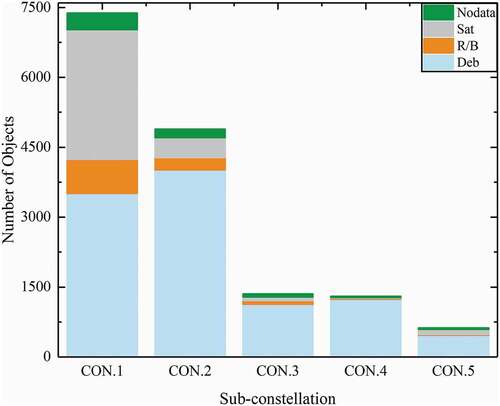
As described above, the simulated Starlink-like constellation consists of five sub-constellations at different altitudes. To study the effects of sub-constellations on RSOs in their corresponding altitude regions, a shell of 20 km in altitude centered at the altitude of each sub-constellation is considered. The number of CAs and their collision probabilities within each of the 5 shells are computed, as shown in and listed in .
Figure 7. CAs and collision probability map in sub-constellation shells without and with the Starlink-like constellation.
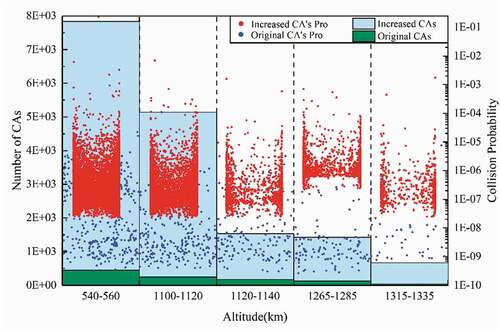
Table 5. Changes on the number of CAs at corresponding shells
As shown in , the CAs with the existing RSOs in the five shells decrease with the increasing altitude. The insertion of the Starlink-like constellation results in significant increases in the CAs within all the five shells, by a factor of 16.34, 19.40, 7.64, 10.48, and 14.81, respectively, for the sub-constellations from low to high altitude. The magnitude of the CA increase appears to depend on the RSO spatial density, with the high density leading to more significant CA increase. For example, CON.1 and CON.2 have increases of 7385 and 4889 CAs, respectively, where the densities are about and
km3, respectively.
On the warnings based on the collision probability, there are also very significant increases within the 5 shells due to the Starlink-like constellation, as shown in and listed in . In particular, it can be seen that there is only one red warning CA in each of the CON.1 and CON.2 shells without the Starlink-like constellation. With the constellation, the red warning CAs increase to 22 and 15 in the two shells. The red warning CAs would occur in the CON.3 and CON.5 shells, while there is no warning happen without the Starlink-like constellation. The number of yellow warning CAs will also have big jumps in all the shells.
Figure 8. Red and yellow warning increases due to the Starlink-like constellation.
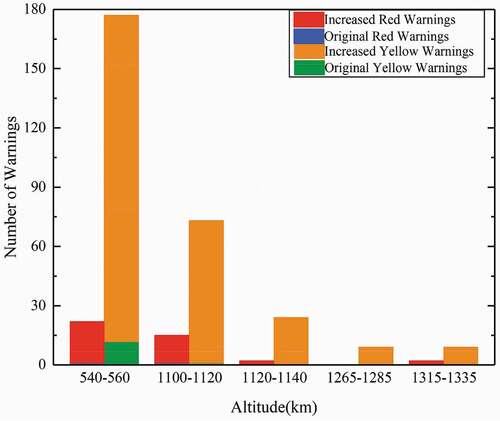
Table 6. The number of red and yellow warnings CAs due to the Starlink constellation
Finally, the overall collision probabilities computed using EquationEquation (13)(13)
(13) ,
, within the shells in the week are summarized in . As seen from that table, the probability in the CON.1 shell has increased by a factor of 407, and the increases in the other 4 sub-constellation shells are between a factor between 92 and 250, and the factor becomes smaller with the increase of the shell altitude. Again, the magnitude of the increase is large when a shell has high RSO spatial density. Clearly, the large number and big size of the Starlink-like satellites are responsible for the astonishing increase in the overall collision probability.
Table 7. The changes of overall collision probability in the May week due to the Starlink-like constellation
Current and future satellite owners and operators would be more concerned with the safety of their satellites at these shell altitudes; therefore, a partition of the Starlink-related CAs in terms of the RSO type is more revealing, and the partitions are shown in . Consistent with , CON.1 has the most CAs among the 5 sub-constellations. For the 4 higher sub-constellations, the vast majority of the CAs are related to debris. But alarmingly, satellites at the CON.1 shell altitude are more likely than those at other altitudes to involve in CAs with the Starlink-like satellites.
Figure 9. Partition of the CAs involving Starlink-like satellites in terms of RSO type.
4.2. Effects of the Chinese LEO constellations
The first satellites for both the Hongyun and the Hongyan constellations have been launched, which not only marks the beginning of the Chinese constellation program, but also inspires our interest in the effects of such constellations on RSOs. The Hongyun constellation comprises 156 satellites, which are distributed evenly over 13 orbital planes, and the inclination of each satellite is designed to be 80°. The Hongyan constellation consists of 60 satellites with 5 planes, and the inclination is 80.4° for each satellite (Han et al. Citation2021). Both constellations are simulated in the same way for the Starlink-like constellation, and the effects of constellations on the RSOs within the corresponding shells are summarized in .
Table 8. Orbital information and effects of two Chinese constellations
Even though more CAs occur in the 1040 km shell (440 CAs) than in the 1100 km shell (281 CAs), the is smaller. There are 1 red and 4 yellow warnings in the 1100 km shell, which collision probabilities exceed 10−4 and 10−5, respectively, and such warnings significantly increase the
in the 1100 km shell. The insertion of Hongyun-like constellation increases 1206 CAs, and the
in the shell is increased by 2 orders of magnitude. Besides, there are 2 red and 17 new yellow warnings for Hongyun-like constellation in 1 week. With fewer satellites, the Hongyan-like constellation increase 327 CAs and the
by a factor of 8. More than that, the red and yellow warnings faced by Hongyan-like constellation are less. There is no doubt that, with similar altitudes and inclination, the constellation with less satellites is better for the space environment.
4.3. Effects of hypothetical LEO mega constellations at different altitudes
RSOs, many of them are operational Earth-observing satellites, are more crowded in the LEO region from 600 km to 1000 km in altitude, which means higher object spatial density in the region. This drives our interest to explore the effects of possible mega constellations on RSOs in this region. Three hypothetical LEO constellations at altitudes of 650 km, 800 km, and 900 km, respectively, are simulated. Each of them is of a Walker configuration similar to CON.1. The information of the three LEO constellations denoted as ICON.1, ICON.2 and ICON.3, respectively, is given in .
Table 9. Orbits of hypothetical constellations
Adding the three hypothetical constellations to the existing RSO catalog results in the big changes of CAs in numbers in the corresponding regions and the associated collision probability. They are shown in , in which the relevant information with CON.2 at the altitude of 1100–1120 km is also shown in the yellow box for comparison. More specific changes of CAs in number are given in .
Figure 10. Effects of three hypothetical LEO constellations and CON.2 on corresponding regions.
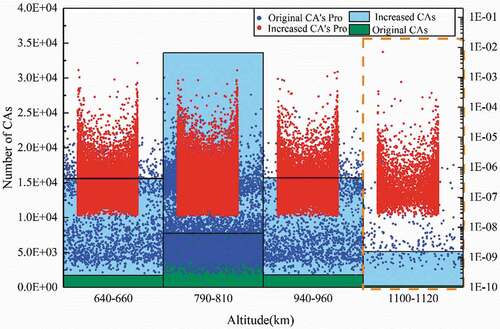
Table 10. Changes on numbers of CA at corresponding shells
As shown in , the numbers of CAs without the mega constellations, shown in green, in the shells of ICON.1 and ICON.3 are 1725 and 1801, respectively; but the number in the ICON.2 shell is a much bigger 7797 because the RSO spatial density is highest at the ICON.2 altitude. The insertion of the three hypothetical constellations results in much more CAs, shown in light blue, within the three shells, by 13,913, 25,828, and 13,870, for ICON.1, ICON.2, and ICON.3, respectively. Compared with CON.2, the hypothetical constellations result in 1.85, 4.28, and 1.84 times more CAs than those caused by CON.2. In particular, one would be really worried if a mega constellation is deployed at the ICON.2 altitude of 800 km.
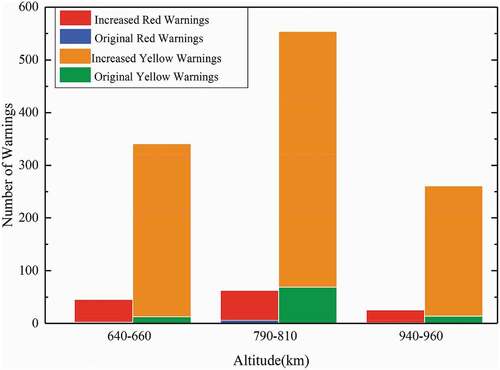
Again, there are also significant increases in the numbers of the red and yellow warnings CAs within the three hypothetical constellations shells, as shown in . It is noted that there are only 2 and 1 red warning CAs in the shells of ICON.1 and ICON.3, respectively, and six in the ICON.2 shell without the hypothetical constellations. With the constellations, the red warning CAs are increased by 44, 57, and 25 in the three shells, respectively. The yellow warning CAs also have big jumps in all shells as well.
Figure 11. Red and yellow warning increases due to the hypothetical constellations.
Finally, the overall collision probabilities in the May 2019 week computed using EquationEq (13(13)
(13) ),
, within the shells are summarized in . The probabilities in the shells of ICONs are increased by a factor of 24.14, 7.60, and 14.83, respectively.
Table 11. The overall collision probability changes due to the hypothetical constellations
It appears that a mega constellation of 1584 satellites deployed at an altitude of high RSO spatial density will lead to a significant increase in the overall collision probability. For the ICON.2, the overall collision probability in the May 2019 week increases by 7.60 times, from the originally high value of without the constellation to
. This implies that a collision between RSOs in the ICON.2 shell with a constellation satellite would occur in about 20 weeks if there is no satellite orbit maneuverer. The time for a collision to occur is about 29 and 38 weeks, respectively for the ICON.1 and ICON.3 constellations.
As described in Sections 4.1 and 4.2, the implementations of the mega constellations will increase the collision probability in space. In this section, the situations of the red and yellow warnings involving RSO satellites and the simulated mega constellations are presented. RSO satellites have to make orbit maneuvers to avoid collisions. It is noted that all the increased warnings are between the RSO satellites and constellation satellites. shows these increased red and yellow warnings, as well as the original warnings without the constellations. These numbers are also given in .
Figure 12. Increased warnings involving RSO satellites. The upper one is the increased red warnings and the lower one on the yellow warnings. The bar charts in the green box are for warnings due to the three hypothetical constellations, and the rest of the charts to the Starlink-like sub-constellations.
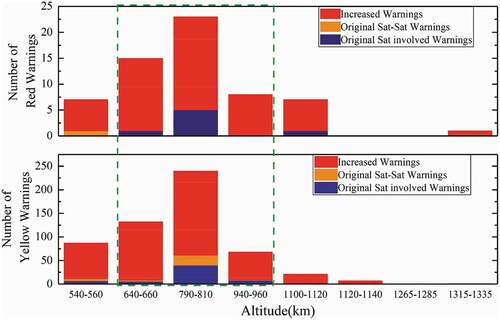
Table 12. The increased warnings involving RSO satellites
As shown in , the insertions of the mega constellations lead to many more warnings involving RSO satellites in the relevant shells, except for the shell of CON.4. The number of the warning increases appears strongly correlated to the RSO spatial density, with the high density resulting in more warning increase. It is found that the warning increases in the ICON.1 shell are more than those in the ICON.3 shell, because the satellite spatial density in the ICON.1 shell is higher.
4.4. Effect of LEO mega constellation of high orbital inclination
In the current RSO catalog, objects with orbital inclination from 80° to 100° account for more than 49.48% of the total population, which means that these RSOs are likely clustered near the North and South Pole regions. It would be interesting to see whether a mega constellation with a high inclination will have a bigger effect on RSOs. For this purpose, another hypothetical LEO mega constellation, ICON.4, is simulated. This Walker constellation has the same number of satellites (1584) and altitude (800 km) as those of ICON.2, but the inclinations of each satellite are increased from 53° to 85°. The effects of ICON.4, including increased CA number and within the shell in the May 2019 week, are summarized in . For comparison, the effects of ICON.2 are also presented in . It is seen that, although with the same number of satellites and altitude, a highly inclined ICON.4 results in 55% more CAs than ICON.2, and the overall collision probability
is increased by 60%.
Table 13. The comparison of the effect of ICON.2 and ICON.4 on RSOs
To show the spatial distribution of the CA caused by two constellations, the latitudinal distribution of CA numbers within the 790–810 shell is shown in .
Figure 13. Latitudinal distribution of CA numbers within 790–810 km.
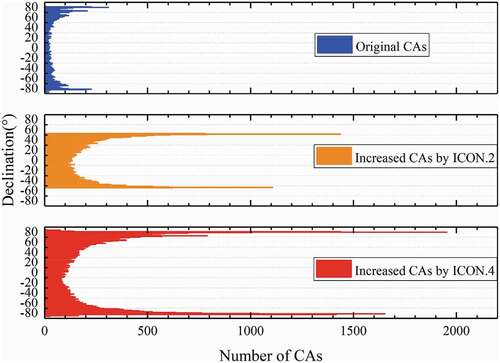
For the original CAs, because the RSOs with inclination from 80° to 100° account for nearly half of all RSOs, the CAs occur more frequently in the space of high latitude, as the blue bar shown in . The increased CAs caused ICON.2 are all in the space bounded by the orbital inclination, but they also occur more frequently in the high latitude space (yellow bar in ). There are more increased CAs caused by ICON.4 (red bar), and the frequency in the space of latitude 70 – 80° is much higher than that in the low latitude space.
4.5. Inter-effects between two LEO constellations at close altitudes
Based on the constellation programs of different institutions mentioned in the Introduction, it is quite possible that multiple LEO constellations will operate at the same time. Even if several constellations are operating at the same time but at different altitudes, the CAs will not occur between satellites from different constellations, as long as the difference between orbit altitudes of any two constellations is significantly large, because the orbits are all nearly circular.
However, if two constellations are at the same altitude, the inter-effects between them must be considered. It is seen from in the Introduction that, the altitude of the Hongyan constellation is 1100 km, and that of sub-constellation CON.2 of Starlink is 1110 km. In the extreme case, two constellations may be at the same altitude, and there could be unexpectedly high numbers of the CAs and collision warnings. To assess this extreme scenario, a constellation comprising 324 satellites operating at the same altitude as CON.2 is assumed. The hypothetical constellation, called E-Hongyan, is simulated having with 6 orbital planes and an orbital inclination of 80.4°. Over the May 2019 week, the insertion of the E-Hongyan and CON.2 results in 1835 and 4889 CAs with RSOs, respectively, and the in the 1110 km shell is increased to 3.29
by E-Hongyan.
The inter-effects between two constellations may be dependent on the configuration of the ascending nodes of the orbital planes. According to the design parameters, the difference between the ascending nodes of the first orbital planes of the two constellations can be any value from 0 to 11.25°. Therefore, we consider 11 scenarios about this difference. The numbers of CAs between constellations and the of these CAs for each of these scenarios are summarized in .
Table 14. The CAs and overall collision probability between E-Hongyan and CON.2 over a week
It is seen that the number of CAs and the overall collision probability are almost independent of the difference between the first ascending nodes. Alarmingly, there are more than 29 thousands CAs between E-Hongyan and CON.2 in the May 2019 week, and the overall collision probability of these CAs is high at . Compared to the numbers of the CAs between existing RSOs and constellation satellites (1835 by E-Hongyan, and 4889 by CON.2), the number of CAs between the two constellations is much larger. The total
in the 1110 km shell is also increased from 1.56
to 3.63
, if both the constellations are operating at the same altitude.
It is imperative to note that, the extraordinarily high number of CAs between the two constellations over a week will place a heavy operation burden on the constellation owners. This would demand meticulous consideration in the constellation altitude design. It also indicates the extreme importance of collaboration between constellation operators, such as the orbital adjustment of satellites in a constellation. Essentially, the orbital adjustment is to keep the safety of satellites within and outside the constellation when there are many potential collisions. The issue should be considered cooperatively: firstly, the balance between the cost and effectiveness of satellite maneuvering. The operator of satellite must decide whether it is safe to perform a maneuver, and whether the maneuver is cost and may even reduce the operational life of the satellite when it faces a collision warning. Secondly, the maneuvered satellite needs to return to its original position in the constellation as soon as possible to keep the constellation configuration, which is an important factor in planning the orbital adjustment. Third, the increased workload of collision avoidance maneuver should be minimized and automated. As the current conjunction assessment and the planning of avoidance maneuvers are largely manually processed, the dramatically increased collision warnings will cause a huge workload, and thus automated collision avoidance is highly demanded.
5. Conclusions
Mega LEO constellations of hundreds or thousands of satellites, mainly for communications, have been proposed, and the Starlink constellation has been in rapid implementation. Researches on their effects on the long-term space environment suggest that the probability of collision with satellites from mega LEO constellations is high. Current and future satellite owners and operators would be more concerned with the short-term imminent operation safety of their satellites at the mega constellation altitudes, exampled by ESA’s Aeolus satellite maneuverer on 2 September 2019 to avoid a collision with Starlink-44.
In this paper, a Starlink-like constellation consisting of 1584 satellites, 4 possible generic constellations at altitudes between 1110 km and 1325 km, Hongyan-like and Hongyun-like constellation, and 4 other hypothetical mega constellations, are simulated, and the close approaches in a time span of 1 week between existing resident space objects and satellites from the simulated constellations, and the associated collision probabilities, are computed and analyzed.
Results show that the number of total CAs in a week is increased by 15,554 due to the insertion of the Starlink-like constellation, and this results in the probability of at least one collision in a week is increased from 6.58% to 31.38% in the whole space if there is no satellite orbit maneuver operation. Moreover, the 5 sub-constellations have even more severe impacts on their corresponding orbit regions. The 4 higher sub-constellations increase not only the numbers of CAs, but also the probabilities of at least one collision by 2 orders of magnitude in their corresponding regions, and the lower one at an altitude of 550 km increases the probability by 3 orders of magnitude. Besides, there would be 39 red and 279 yellow warnings more issued in 1 week. The results also reveal that the seriousness of the effects from the mega constellations is greater at the region with high RSO spatial density.
Similar alarming results are also obtained from the computations of the CAs and collision probability between the existing RSOs and satellites from the three hypothetical LEO constellations at the altitudes of 650 km, 800 km, and 950 km, respectively. Because the 800 km altitude region has the highest RSO spatial density, the probability of a collision in this region in 1 week due to the constellation of 1584 satellites is about , an increase by almost 1 order of magnitude. The red/yellow warnings would increase by 44/328, 57/485, and 25/247, respectively, with respect to the three hypothetical constellations from low to high altitude. The result shows that the red warnings increased by the mega constellations are a real concern. For the 800 km altitude region, the red warning increases from 6 to 63 in the May 2019 week, suggesting it needs more frequent orbit maneuvers to keep satellites safe. In other regions of altitude from 550 to 1110 km, the red warnings also have large increases.
To investigate the effect of orbital inclination, another hypothetical constellation with a high inclination (85°) is simulated. Because of the higher RSO spatial density in the regions near the Poles, the mega constellation will cause much more CAs and higher collision risk within the corresponding shell.
A number of proposed mega constellations are close in the orbital altitude. The study of the inter-effects between a sub-constellation of 1600 satellites and another of 324 satellites, both at the altitude of 1110 km, reveals that there are more than 29,000 CAs in a week. The high number of CAs would demand a very careful consideration in the constellation configuration design.
In summary, when a mega constellation is fully deployed, there would be very significant increases in the numbers of CAs and red/yellow warnings in the constellation altitude region, and the increases would be really alarming in some regions. This suggests that the space safety after deployment of mega LEO constellations would be a concerned challenge, and there could be an extraordinary orbital operation burden for constellation owners to avoid space collision. A comprehensive space traffic management system would be essential to ensure the space operation safety.
Acknowledgments
The authors are grateful to anonymous reviewers whose constructive and valuable comments greatly helped us to improve the paper.
Disclosure statement
No potential conflict of interest was reported by the author(s).
Additional information
Funding
Notes on contributors
Yan Zhang
Yan Zhang is currently working toward a PhD degree in geodesy and surveying engineering with the School of Geodesy and Geomatics, Wuhan University. His research interests include space traffic management, satellite collision warning, and collision probability.
Bin Li
Bin Li received the MS and PhD degrees 2013 and 2017, respectively. He is currently an Associate Research Fellow with the School of Geodesy and Geomatics, Wuhan University, Wuhan, China. His research interests include space object surveillance and catalog, orbital mechanics, orbit determination and prediction, uncertainty propagation, and machine learning.
Hongkang Liu
Hongkang Liu is currently working toward a PhD degree in geodesy and surveying engineering with the School of Geodesy and Geomatics, Wuhan University. His research interests include orbit mechanics, machine learning and uncertainty quantification and propagation.
Jizhang Sang
Jizhang Sang received the BS and MS degrees in geodesy from the Wuhan Technical University of Surveying and Mapping (now part of Wuhan University), Wuhan, China, in 1983 and 1986, respectively, and the PhD degree in satellite navigation from the Queensland University of Technology, Brisbane, QLD, Australia, in 1997. From 1998 to 2013, he was a Senior/Principal Research Engineer with EOS Space Systems, Canberra, ACT, Australia. Since 2013, he has been a Professor at the School of Geodesy and Geomatics, Wuhan University, Wuhan, China. He has published widely in geodesy, satellite navigation, and space debris orbit determination. His research interests include space debris surveillance, orbit determination, atmospheric mass density modeling, space geodesy, and satellite navigation.
References
- Akella, M.R., and K.T. Alfriend. 2000. “Probability of Collision between Space Objects.” Journal of Guidance Control and Dynamics 23 (5): 769–772. doi:https://doi.org/10.2514/2.4611.
- Alfano, S. 1994. “Determining Satellite Close Approaches .2.” Journal of the Astronautical Sciences 42 (2): 143–152.
- Alfano, S., and D. Negron. 1993. “Determining Satellite Close Approaches.” Journal of the Astronautical Sciences 41 (2): 217–225.
- Anselmo, L., and C. Pardini. 2009. “Analysis of the Consequences in Low Earth Orbit of the Collision between Cosmos 2251 and Iridium 33.” Proceedings of the 21st International Symposium on Space Flight Dynamics, Paris, France, Centre nationale d'etudes spatiales.
- Anselmo, L., A. Rossi, and C. Pardini. 1999. “Updated results on the long-term evolution of the space debris environment.“ Advances in Space Research 23 (1): 201–211.
- Bai, X., and L.E.I. Chen. 2009. “A Rapid Algorithm of Space Debris Collision Probability Based on Space Compression and Infinite Series.” Acta Mathematicae Applicatae Sinica 32 (2): 336–353.
- Boley, A.C., and M. Byers. 2021. “Satellite Mega-constellations Create Risks in Low Earth Orbit, the Atmosphere and on Earth.” Scientific Reports 11 (1): 1–8. doi:https://doi.org/10.1038/s41598-021-89909-7.
- Chan, K. 1997. “Collision probability analysis for earth orbiting satellites.” Space Cooperation into the 21st Century , 1033–1048.
- FCC.report. 2020. “Application for Fixed Satellite Service by Space Exploration Holdings, LLC.” FCC.report, Last Modified 2020-04-30. https://fcc.report/IBFS/SAT-MOD-20200417-00037 .
- Foreman, V.L., A. Siddiqi, and O. De Weck. 2017. “Large Satellite Constellation Orbital Debris Impacts: Case Studies of Oneweb and Spacex Proposals.” AIAA SPACE and Astronautics Forum and Exposition, Orlando, FL.
- Foust, J. 2020a. “How to Better Manage Space Traffic: Aeolus/Starlink Encounter Shows Emails and Late-night Phone Calls No Longer Cut It.” Space News, Last Modified updated, Jan 14. Accessed 31 Oct 2020. https://spacenews.com/how-to-better-manage-space-traffic-aeolus-starlink-encounter-shows-emails-and-late-night-phone-calls-no-longer-cut-it/ .
- Foust, J. 2020b. “SpaceX Reaches 100 Successful Launches with Starlink Mission.” Space News, Last Modified updated Oct 31; Accessed 31 Oct 2020. https://spacenews.com/spacex-reaches-100-successful-launches-with-starlink-mission/ .
- Gavin, R.T. 2010. “NASA’s Orbital Debris Conjunction Assessment and Collision Avoidance Strategy.” Advances in the Astronautical Sciences 137 (7): 2010.
- Ge, H., B. Li, S. Jia, L. Nie, T. Wu, Z. Yang, J. Shang, Y. Zheng, and M. Ge. 2021. “LEO Enhanced Global Navigation Satellite System (Legnss): Progress, Opportunities, and Challenges.” Geo-Spatial Information Science. doi:https://doi.org/10.1080/10095020.2021.1978277. (online published)
- Han, Y., L. Wang, W. Fu, H. Zhou, L. Tao, B. Xu, and R. Chen. 2021. “LEO Navigation Augmentation Constellation Design with the Multi-objective Optimization Approaches.” Chinese Journal of Aeronautics 34 (4): 265–278. doi:https://doi.org/10.1016/j.cja.2020.09.005.
- Hao, M., J. Zhang, R. Niu, C. Deng, and L. Hong. 2018. “Application of BeiDou Navigation Satellite System in Emergency Rescue of Natural Hazards: A Case Study for Field Geological Survey of Qinghai–Tibet Plateau.” Geo-Spatial Information Science 21 (4): 294–301. doi:https://doi.org/10.1080/10095020.2018.1522085.
- Kelso, T.S. 2019. “Satellite Catalog (SATCAT).” CelesTrak SATCAT Boxscore, Last Modified updated May 24. Accessed 31 Oct 2020 . http://celestrak.com/satcat/boxscore.asp .
- Kessler, D. J. 1991. “Collisional Cascading: The Limits of Population Growth in Low Earth Orbit.” Advances in Space Research 11 (12): 61–66. doi:https://doi.org/10.1016/0273-1177(91)90543-S.
- Lambour, R., N. Rajan, T. Morgan, I. Kupiec, and E. Stansbery. 2004. “Assessment of Orbital Debris Size Estimation from Radar Cross-section Measurements.” Advances in Space Research 34 (5): 1013–1020. doi:https://doi.org/10.1016/j.asr.2003.02.043.
- Le May, S., S. Gehly, B.A. Carter, and S. Flegel. 2018. “Space Debris Collision Probability Analysis for Proposed Global Broadband Constellations.” Acta Astronautica 151: 445–455. doi:https://doi.org/10.1016/j.actaastro.2018.06.036.
- Liou, J.C. 2006. “Collision Activities in the Future Orbital Debris Environment.” Advances in Space Research 38 (9): 2102–2106. doi:https://doi.org/10.1016/j.asr.2005.06.021.
- Liou, J.-C., and N.L. Johnson. 2008. “Instability of the Present LEO Satellite Populations.” Advances in Space Research 41 (7): 1046–1053. doi:https://doi.org/10.1016/j.asr.2007.04.081.
- Muelhaupt, T.J., M.E. Sorge, J. Morin, and R.S. Wilson. 2019. “Space Traffic Management in the New Space Era.” Journal of Space Safety Engineering 6 (2): 80–87. doi:https://doi.org/10.1016/j.jsse.2019.05.007.
- Oltrogge, D.L., and S. Alfano. 2019. “The Technical Challenges of Better Space Situational Awareness and Space Traffic Management.” Journal of Space Safety Engineering 6 (2): 72–79. doi:https://doi.org/10.1016/j.jsse.2019.05.004.
- Pardini, C., and L. Anselmo. 2014. “Review of past On-orbit Collisions among Cataloged Objects and Examination of the Catastrophic Fragmentation Concept.” Acta Astronautica 100: 30–39. doi:https://doi.org/10.1016/j.actaastro.2014.03.013.
- Pardini, C., and L. Anselmo. 2020. “Environmental Sustainability of Large Satellite Constellations in Low Earth Orbit.” Acta Astronautica 170: 27–36. doi:https://doi.org/10.1016/j.actaastro.2020.01.016.
- Radtke, J., C. Kebschull, and E. Stoll. 2017. “Interactions of the Space Debris Environment with Mega constellations-Using the Example of the OneWeb Constellation.” Acta Astronautica 131: 55–68. doi:https://doi.org/10.1016/j.actaastro.2016.11.021.
- Rossi, A., A. Cordelli, P. Farinella, L. Anselmo, and C. Pardini. 1997. “Long term evolution of the space debris population.” Advances in Space Research 19 (2):331–340.
- Rossi, A., A. Petit, and D. McKnight. 2020. “Short-term Space Safety Analysis of LEO Constellations and Clusters.” Acta Astronautica 175: 476–483. doi:https://doi.org/10.1016/j.actaastro.2020.06.016.
- Shen, S., X. Jin, and H. Chang. 2014. “Cleaning Space Debris with a Space-based Laser System.” Chinese Journal of Aeronautics 27 (4): 805–811. doi:https://doi.org/10.1016/j.cja.2014.05.002.
- SpaceTrack. 2019. “SPACE-TRACK.ORG.SSR.” Space-track Website, Last Modified Updated. May 24. Accessed 31 Oct 2020. https://www.space-track.org/#/ssr .
- SpackTrack. 2019. “SPACE-TRACK.ORG.SGP4.” Space-track Website, Last Modified updated May 24. Accessed 31 Oct 2020. https://www.space-track.org/documentation#/sgp4 .
- Virgili, B.B., J.C. Dolado, H.G. Lewis, J. Radtke, H. Krag, B. Revelin, C. Cazaux, C. Colombo, R. Crowther, and M. Metz. 2016. “Risk to Space Sustainability from Large Constellations of Satellites.” Acta Astronautica 126: 154–162. doi:https://doi.org/10.1016/j.actaastro.2016.03.034.
- Zaidi, W., and M.D. Hejduk. 2016. “Earth Observing System Covariance Realism.” Paper presented at AIAA/AAS Astrodynamics Specialist Conference, Long Beach, California. https://arc.aiaa.org/doi/abs/10.2514/6.2016-5628 .
- Zhong, Y., X. Wang, S. Wang, and L. Zhang. 2021. “Advances in Spaceborne Hyperspectral Remote Sensing in China.” Geo-spatial Information Science 24 (1): 95–120. doi:https://doi.org/10.1080/10095020.2020.1860653.