
 ?Mathematical formulae have been encoded as MathML and are displayed in this HTML version using MathJax in order to improve their display. Uncheck the box to turn MathJax off. This feature requires Javascript. Click on a formula to zoom.
ABSTRACT
The accessibility provided by the transportation system plays an essential role in driving urban growth and urban functional land use changes. Conventional studies on land use simulation usually simplified the accessibility as proximities and adopted the grid-based simulation strategy, leading to the insufficiencies of characterizing spatial geometry of land parcels and simulating subtle land use changes among urban functional types. To overcome these limitations, an Accessibility-interacted Vector-based Cellular Automata (A-VCA) model was proposed for the better simulation of realistic land use change among different urban functional types. The accessibility at both local and zonal scales derived from actual travel time data was considered as a key driver of fine-scale urban land use changes and was integrated into the vector-based CA simulation process. The proposed A-VCA model was tested through the simulation of urban land use changes in the City of Toronto, Canada, during 2012–2016. A vector-based CA without considering the driving factor of accessibility (VCA) and a popular grid-based CA model (Future Land Use Simulation, FLUS) were also implemented for comparisons. The simulation results reveal that the proposed A-VCA model is capable of simulating fine-scale urban land use changes with satisfactory accuracy and good morphological feature (kappa = 0.907, figure of merit = 0.283, and cumulative producer’s accuracy = 72.83% ± 1.535%). The comparison also shows significant outperformance of the A-VCA model against the VCA and FLUS models, suggesting the effectiveness of the accessibility-interactive mechanism and vector-based simulation strategy. The proposed model provides new tools for a better simulation of fine-scale land use changes and can be used in assisting the formulation of urban and transportation planning.
1. Introduction
Urbanization is a global trend unique to the past few centuries, featured with continuous urban land expansion in urban fringes (Liu et al. Citation2020; Yeh, Li, and Xia Citation2021) and multitype urban land use changes within cities (Chen et al. Citation2020, Citation2017). As suggested by many previous studies, urban expansions and urban land use changes are closely linked to the development of transportation system (Wegener Citation2021; Soteropoulos, Berger, and Ciari Citation2019). In fact, the urban transportation network not only provides opportunities for socioeconomic activities within/between cities but also contributes to shape the city forms and urban land use patterns over the long term (Iacono, Levinson, and El-Geneidy Citation2008; Wee Citation2004). Specifically, the transport supply from the transportation network determines the attractiveness of location to people’s activities, for example, the choices for places to live, work, sport, and leisure, which therefore drives the urban growth and the changes the functional land use in urban areas (Bertolini Citation2017; Rodrigue, Comtois, and Slack Citation2016). Thus, urban transportation system has long been regarded as the fundamental driving force of the socioeconomic developments and urban land use changes, especially in metropolitan areas (Glaeser, Kahn, and Rappaport Citation2008; Zhang, Zhang, and He Citation2021).
Given that urban land use and transportation system are interacted together as a synthesis, a series of land use and transport interaction models have been designed to investigate the urban land use changes driven by accessibility provided by transportation infrastructure (Chang Citation2006; Ortuzar and Willusen Citation2001; Wegener Citation2021). Previous models can be roughly generalized into three categories: method based on regression analysis (Iacono and Levinson Citation2009), agent-based modeling (Salvini and Miller Citation2005; Wise, Crooks, and Batty Citation2016), and Cellular Automata (CA) land use simulations (Abolhasani et al. Citation2016). Among these models, the CA-based approaches can provide advantage in comprehending the complex dynamics of the urban growth and its interactions with the local environment. Conventional CA models are composed of five components (Santé et al. Citation2010; Verburg et al. Citation2004; Batty, Xie, and Sun Citation1999): a space containing a collection of homogeneous cells, a sequence of discrete time steps, a definition of neighborhood of each cell, a set of states describing the dynamics of cells, and a set of transition rules determining the changes of state of each cell. Because of its simplicity of computations and assumptions, CA models are immensely popular for simulating the spatiotemporal dynamics of land use changes (Wu and Martin Citation2002; Mohan Rajan and Loganathan Citation2021).
In the context of urban expansion and urban functional land use change, accessibility, which is known as a measure of easiness with which people can reach or interact with destinations (Hansen Citation1959), plays an essential role in connecting the transportation system and urban land use dynamics (Kelobonye et al. Citation2019; Liu and Zhu Citation2004). A series of studies suggested that the dynamic couple of accessibility into the land use model is a feasible way to investigate the evolution of urban land use driven by the transportation (Aljoufie et al. Citation2013; Liu and Zhu Citation2004; Kasraian, Maat, and van Wee Citation2017). In fact, many existing studies on urban change simulation have already taken into account the impact from transportation system in CA modeling by adopting transportation-related variables, such as distance to road networks and bus stations (Liu et al. Citation2017; Verburg et al. Citation2004). Although great progress has been made previously (Chang Citation2006; Ortuzar and Willusen Citation2001), there are still limitations on the integration of accessibility in CA modeling, which needs further improvements for a better simulation of urban land use change driven by the transportation system.
The first limitation is that most traditional CA models usually interpretate the accessibility as simplified variables, for example, proximity to transportation facilities (Euclidean distance to road network or bus stations) (Feng and Tong Citation2018; Liu et al. Citation2010; Zhang et al. Citation2020). There is no doubt that the urban development is closely related to the proximity of land patch to roads and other travel facilities. However, these simplified proximity variables are incapable of reflecting actual people’s movement and traffic flows, whereas the urban land use dynamics, especially the changes among different urban functional types (e.g. transition from residential to mixed land use or commercial use), are more directly linked to this kind of travel information. Some studies also pointed out that the routinely collected travel information, such as travel time and traffic volumes on the transportation network, is a more intuitive and rational representation in the modeling of interaction between urban transportation and land use (Luna, Miller, and Shoshanna Citation2018; Rad and Alimohammadi Citation2021). Unfortunately, there is limited research on the integration of such detail traffic information into the land use simulation, probably due to the difficulty of traffic data collection.
The second limitation is that conventional CA models adopt the grid-based representation (raster data format) in the urban land use change simulation because of its simplicity of data organization and convenience of computation (Aljoufie et al. Citation2013). These CA models typically take grid cells as their basic modeling unit without considering the fine-scale shape of ground objects. Therefore, they are usually considered inadequate for applications with fine resolution spatial data (Pinto, Antunes, and Roca Citation2017; Moghadam, Karimi, and Habibi Citation2018) and thus unable to simulate the spatial configuration of urban patches (Chen et al. Citation2019; Yao et al. Citation2017). In addition, the simulation of land use patterns from the grid-based CA model is usually sensitive to the cell size parameter and neighborhood configuration (Chen et al. Citation2014; Dahal and Chow Citation2015). Moreover, the subtle urban land use changes, which are closely related to human daily travel behaviors, are barely able to be captured and simulated with the regular geometry of grid cell in the CA simulation (González, Gómez-Delgado, and Benavente Citation2015; Stevens and Dragićević Citation2007). In fact, people living in urban areas usually schedule their destination and routine of activities according to the location’s accessibility provided by the transportation network (Badoe and Miller Citation2000; Li et al. Citation2021). When introducing the accessibility into the land use simulation, the complexity of accessibility itself (e.g. travel time on the road network) requires fine-scale shape of land patches to better represent the actual travel cost in the transportation network rather than simplified Euclidean distances between the origins and destinations. Compared with the grid-based representation, the vector format data is more capable of capturing fine-scale ground objects with irregular polygons and thus can avoid the bias caused by the grid-based representation (Yao et al. Citation2017; Chen et al. Citation2019; Barreira-González, Gómez-Delgado, and Aguilera-Benavente Citation2015). Recently, a series of patch-based and vector-based CA models were proposed to simulate fine urban land use changes and proved to be more realistic for revealing the temporal dynamics of ground object (Abolhasani et al. Citation2016; Dahal and Chow Citation2015; Barreira-González, Gómez-Delgado, and Aguilera-Benavente Citation2015; Chen et al. Citation2014; Lu, Cao, and Zhang Citation2015). Thus, the incorporation of vector-based simulation strategy into the modeling is expected to better characterize the interaction between the transportation system and land use dynamics, especially the subtle urban changes driven by the accessibility.
The motivation of this study is to overcome the two abovementioned limitations and develop a better model for the simulation of urban land use change driven by the transportation system. To achieve this, we proposed an Accessibility-interacted vector-based CA (A-VCA) model to simulate the subtle urban land use changes among different functional types. Different from previous models, we took the accessibility derived from actual urban traffic data as a key driver to investigate the urban land use changes driven by transportation infrastructures. In order to simulate the urban land use changes among different urban functional types, for example, transition from residential to mixed land use, we adopted the Random Forest Algorithm (RFA) to calibrate the A-VCA model since it is popular and effective for high-dimensional data modeling (Belgiu and Drăguţ Citation2016; Yao et al. Citation2017). Specifically, the accessibility variables at both local and zonal scales were estimated based on using actual auto-in-vehicle travel time collected by the Transportation Tomorrow Survey (TTS) and was processed with the EMME transportation network analysis software (https://www.inrosoftware.com/en/products/emme/). Then, the estimated accessibility variables were incorporated into the vector-based CA model to explore the transition rules and derive the land use transition probabilities. The proposed A-VCA model was applied and tested in the City of Toronto, Canada, during 2012–2016. Note that we mainly focused on the fragmented processes of urban land use change among different functional types within the urban area. The number of such land use changes is usually not large, and most of them mainly occur in discrete and fragmented land parcels within the urban area. Thus, simulations for a relatively shorter time span, that is, from 2012 to 2016 in this study, are more suitable to test the model’s capability of simulating these fragmented and subtle urban land use changes among different functional types. Hopefully the model is expected to accurately simulate the subtle urban land use changes in the City of Toronto with good morphological features.
The rest of the article is organized as follows: In Section 2, we give a brief description of the study area (City of Toronto, Canada) and the data used to conduct the simulations and analyses. Section 3 presents the development of the proposed A-VCA model, including how to define and derive the accessibility (at both local and zonal scales), and how to embed the accessibility variable into a vector-based CA model. In Section 4, we apply the proposed A-VCA model in the study area and evaluate the performance of the simulation. A comparison of the proposed and existing models is also presented in this section. Finally, some conclusive remarks and limitations are presented in the Section 5. The results and findings in this study can deepen our undersetting of the interaction between land use changes and transportation, and provide useful knowledge for urban growth management and transportation planning.
2. Study area and data
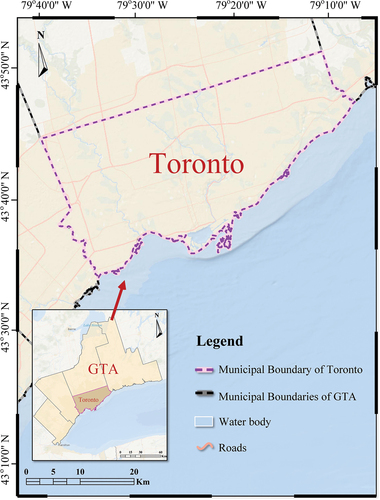
The proposed model was tested through the simulation of urban land use changes in the City of Toronto, Canada (). The City of Toronto is the most populous city in Canada (2.96 million in 2018) and the fourth largest city in North America (630.2 km2). In recent decades, Toronto has been among the fastest-growing large metropolitan areas in high-income countries and became the principal commercial center in Canada. Like most megacities in North America, Toronto formed a monocentric urban structure with large urban sprawl in the suburban area after urbanization. The downtown area is densely built with commercial and high-rise residential land use. The monocentric urban structure and long-term urban growth indicate that Toronto is in the phase of steady urbanization stage, which led to the rapid urban land use changes within the study area. Thus, the City of Toronto is a suitable study area for testing the performance of the proposed A-VCA model.
Figure 1. Geographic location of the study area: City of Toronto.
The travel data used to estimate the accessibility were acquired from the 2011 TTS. The TTS is a 1-day telephone-based travel survey that is sampled at a rate of 5% of households within the Greater Toronto Area (Data Management Group Citation2013). In this study, we randomly selected the auto in-vehicle travel time records from the TTS on a weekday to estimate the accessibility variables. The auto in-vehicle travel time records are archived as an origin–destination matrix of average travel hours from 625 TTS Traffic Analysis Zones (TAZs) of the City of Toronto. The accessibility of a land parcel depends not only on the traffic demands from the origin to the destination but also on the width of the road network. Since the TTS travel time records are synthesis observations from the real traffic flow in the transportation network, these traffic time data should have already implicitly taken both the traffic demand and road width into consideration. The time period we used in this study was the morning rush hour on a weekday.
The land use data used in the simulation were obtained from the Geospatial Competency Centre, City of Toronto, which originally includes the detailed land use information in 50 subcategories. The vector-format land use data set in the study area of the City of Toronto consists of totally 487,509 parcels. To simplify the initial data set, the land use data were generalized and then reclassified into 10 categories according to , including high-rise residential, low-rise residential, commercial, industrial, government, institution, or community (G/IC), open space, mixed, utilities, vacant, and water. The initial year of vector land use data we used is 2012, and the simulation was performed from 2012 to 2016. Because of the availability of land use data in 2016, we conducted the model calibration only based on land use data in the downtown Toronto, where detailed spatial information of multifarious land use changes is available.
Table 1. Reclassification and generalization of land use categories.
The auxiliary geospatial variables data, which are contributed to drive the urban land uses from transforming into others, were used to estimate land use suitability with the RFA regression model. The details of the geospatial variables selected in our study are summarized in . The auxiliary spatial variables can be categorized into three major categories, including natural condition variables, traffic location variables, and urban environment variables. shows the visualizations of the spatial variables after using spatial analysis tools (e.g. Euclidean distance, Kernel density) via ArcGIS toolboxes (ESRI Company, CA, USA; https://www.esri.com/software/arcgis). All the data used in this study were registered and reprojected into the Universal Transverse Mercator zone 17 north coordinate system.
Figure 2. Spatial patterns of auxiliary geospatial variables. All variables were normalized into the range of 0–1.
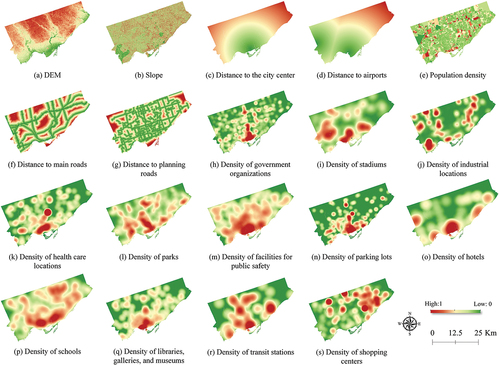
Table 2. List of auxiliary geospatial variables used in the study.
3. Methodology
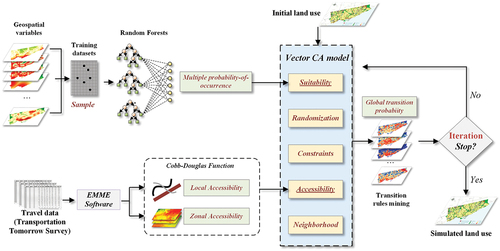
In this study, we developed a A-VCA model to simulate the land use changes among different urban subtypes driven by the transportation system. illustrates the flow of the land use change simulation using the A-VCA model. Firstly, the selected geospatial driving factors and urban land use maps were used to calibrate a random forest regression to estimate the land use suitability (probability-of-occurrence) for each urban land use subtype. Secondly, the transportation data collected from TTS were processed to derive the local and zonal accessibilities for vector and TAZ scales, respectively. Thirdly, a vector-based CA model was built, taking into account the land use suitability (probability-of-occurrence), accessibility (combination of local and zonal accessibilities with the Cobb–Douglas function), neighborhood environments, development constraints, and unexpected random factors. Finally, the land use changes of difference urban subtypes were iteratively simulated with the vector-based simulation strategy.
Figure 3. The methodology of the proposed A-VCA model.
3.1. Accessibility
The accessibility to urban land use types was generated from the travel time derived from the actual trip generation and conducted from the production and attraction per vector for each specific land use category. The transportation data from TTS were based on the TAZ level, and the trip generation could be simply calculated from the average number of trip origins and trip destinations per TAZ. However, the trip generation results calculated in this manner could be biased and bring the inhomogeneity since they only focus on the TAZ center rather than the global extent. In fact, the actual trip generations for the rest of the TAZ are heterogeneous and may be greatly different from the average situation because of some traffic condition such as congestions. Thus, we designed a two-perspective accessibility (i.e. local and zonal) to better describe trip generation at a finer scale:
where denotes the accessibility for urban type k in urban land parcel i,
denotes the local accessibility calculated at the vector scale, and
denotes the zonal accessibility calculated at TAZ scale. We applied the Cobb–Douglas production function to numerically combine these two accessibilities together, and EquationEquation (1)
(1)
(1) can be rewritten as
where μ, a, and b are parameters set according to empirical knowledge. The Cobb–Douglas production function has long been popular for measuring and regressing factors accounting for the differences in productivity (Lobo et al. Citation2013; Montolio and Solé Ollé Citation2009) because of its simple formulation and empirical estimation mechanisms, and can be generalized in urban studies and geography (Santías, Cadarso-Suárez, and Rodríguez-Álvarez Citation2011).
The local accessibility in EquationEquation (2)(2)
(2) is defined as a function to describe the accessibility for urban land parcels relative to the road network:
where is calibrated parameter for differenct land use type k and road type
(we considered two road types in this study: highways and main roads),
is the nearest distance from current land use k in land parcel
to the road network, and Dr is the distance decay parameter to control the proximity effect for road type r. For current land parcels located near the highway interchanges within a specific distance, the accessibility for people to get to the highways is superior to other roads (main roads). Thus, we built a set of buffer rings around the highway interchanges and calculated the
for these land parcels according to the buffer distance without considering other road types. For current land parcels located outside the buffer rings, the
were calculated through finding the nearest Euclidean distance to the road network. The buffer rings distance and
can be calibrated in calibration procedure.
The zonal accessibility in EquationEquation (2)(2)
(2) represents the accessibility that can be reached by all land use types from all TAZs. We assumed that the zonal accessibility for the current land use types in a TAZ is influenced by all other land uses within the study area through a distribution function. The gravity model (Erlander and Stewart Citation1990) was adopted to calculate the zonal accessibility of all land parcels from all other TAZs:
where z and z’ denote the origin and destination of TAZs, respectively, denotes the in-vehicle travel time from origin to the destination zone,
counts the current iterated land use amount for land use type k in zone z’, and α and β are the parameters of the gravity model that vary from cases to cases and calibrated and set in calibration procedure.
3.2. A-VCA model
Different from the conventional grid-based CA models, the proposed A-VCA model uses land parcel as the basic modeling unit for the simulation process. Thus, the land use data should be divided into small land parcels beforehand in order to simulate the subtle urban land use changes. Based on previous studies (Vanegas et al. Citation2009; Yao et al. Citation2017), we adopted an interactive dichotomy strategy to spit large land parcels into subparts and maintain the along-the-road direction after the land parcel subdivision. For the detailed process of land parcel subdivision, please refer to Yao et al. (Citation2017).
In general, the transition rules in a classic CA model typically consist of four components (Li and Yeh Citation2002; Liu et al. Citation2017): the land use suitability to describe the suitability for specific land use type to convert according to the essential nature of land use, the neighborhood interaction to represent the spatial autocorrelation, the constrain to denote the difficulty of change from one land use type to another one for a specific land parcel, and the randomness to account for unexpected random factors. In this study, we introduced the accessibility estimated from the previous section as an additional independent component to derive the urban land use transition rule within the proposed A-VCA model:
where the subscripts k and i represent land use type k and land parcel i, respectively; denotes the final transition probability;
denotes the land use suitability;
is neighborhood interactions;
represents the processed accessibility; the stochastic factors
can be further expressed as
, where γ and α are uniform random variables where γ ranges from 0 to 1 and α ranges from 0 to 10, respectively; and
represents the constraints of the conversion.
The land use suitability in EquationEquation (5)
(5)
(5) was calibrated with a series of geospatial variables listed in . We adopted the RFA regression model to calibrate and estimate the land use suitability since it is capable of overcoming the multicollinearity problem among spatial variables and efficient for high-dimensional fitting tasks (Palczewska et al. Citation2014). For each land parcel, the land use suitability can be expressed as
where denotes total number of decision tree in the RFA,
is the indicator function, X denotes the high-dimensional vector of auxiliary spatial variables listed in , and
denotes the prediction land use type of the tth decision tree for X.
The neighborhood interaction in the CA model is an important component to describe the spatial autocorrelation of complex geographical phenomena (Dahal and Chow Citation2015; Liu et al. Citation2017). Traditional neighborhood definitions in the grid-based CA model, such as the Moore neighborhood and Von Neumann neighborhood, are not applicable for the vector-based CA models because of the irregular geometry of land parcels. In this study, we adopted a land parcel area-weighted method (Abolhasani et al. Citation2016; Yao et al. Citation2017) to define the neighborhood effect in the A-VCA model:
where denotes the neighborhood effect of land use type k for land parcel i at time t;
is the distance between the centroids of land parcel i and j; d is the buffer range from land parcel i;
and
represent the geometric areas of land parcel j and i, respectively;
and
are the maximum and minimum geometric areas of land parcel within the entire study area. The
is updated in each simulation iteration and only valid when
.
The constraints of the conversion in EquationEquation (5)
(5)
(5) represent the easiness (or cost) of a particular land use type to change to another. Here, we set land use of water-type-restricted areas that cannot be changed during the simulation. The conversion costs among other land use types were estimated based on an analysis of the historical land use data in the study area and regional expert opinions. During the simulation, we iteratively estimated the final transition probability for each land use type in every land parcels according to EquationEquation (5)
(5)
(5) . A conversion was taken when the highest transition probability at a land parcel exceeds the conversion thresholds for different land use types. The threshold for a specific conversion (e.g. from residential to commercial) was set to be the mean probability of all transition probabilities of this specific conversion estimated from the entire study area. The simulation will keep iterating until all land use changes reach the land use areas in the terminate year.
3.3. Model assessment indicators
In this study, three indicators were selected to assess the simulation performance of the A-VCA model, including the kappa indicator, Figure of Merit (FoM) indicator, and the Cumulative Producer’s Accuracy (CPA). Firstly, we used the kappa indicator, a traditional and reliable approach for evaluating the accuracy of CA land use simulations, especially for multiple land uses (Sim and Wright Citation2005; Van Vliet, Bregt, and Hagen-Zanker Citation2011). After generating a confusion matrix, the kappa indicator can evaluate the simulation results against the actual land use pattern:
where pk+ represents the proportion of land parcels in the confusion matrix simulated in land use type k, p+k represents the proportion of land parcels in the confusion matrix that are land use type k in the actual land use pattern, and pkk represents the proportion of land parcels that were simulated as land use type k and are actually land use type k in the actual land use pattern.
Previous studies suggested that using the kappa indicator might be unstable in simulations in which the unchanged land parcels dominate (Pontius et al. Citation2008; Chen et al. Citation2014; Liu et al. Citation2017). Thus, we also adopt the FoM indicator (Pontius et al. Citation2008) to assess the performance of the simulation results. The FoM is often used in the CA simulation estimations to reveal the relevance of the ground truth land use changes and the simulated urban land use changes. It is a ratio of four subvariables, namely, the denominator (A), the numerator (B), and the errors C and D:
Specifically, A represents the error due to observed land use change and is simulated as the persistence, B represents the number of samples that are observed and simulated correctly, C is the error caused by the observed changes and is meanwhile simulated as an incorrect gaining category, and D represents the error caused by observed persistence and is simulated as changed.
The last indicator is the producer’s spatial accuracy (PA, and its cumulative form, namely, CPA). The PA indicator is commonly applied to evaluate the performance of simulating correctly and stands for the proportion of correctly simulated cells to all cells (Lu et al. Citation2019):
where Carea represents the count of correctly modeled transformed cells, and TCarea is the total number of all transformed cells. Note that the PA indicator can also be calculated through four subvariables in the FoM indicator, that is, B/(A + B + C). However, the PA calculated in this manner is more reasonable for assessing the accuracy of grid-based CA simulations (He et al. Citation2015). In this study, the PA indicator is calculated specifically for vector-based CA by taking the area of transition land parcels into consideration. Furthermore, we designed the cumulative form of PA, namely, CPA, to assess the stability of the simulation model through multiple repeating simulations:
where M is the repeating times of simulation.
4. Results and discussion
4.1. Calibration of the A-VCA model
In this study, the auto in-vehicle travel time was calculated using EMME V4.2 software, and the urban land use changes was simulated using the proposed A-VCA model. Through model calibrations, we calibrated all parameters for the calculation of the gravity model-based zonal accessibility, the distance decay effect-based local accessibility, the Cobb–Douglas function, the RFA formulation, and the neighborhood distance. In local accessibility calibration, is defined as the weight parameter for road type r for land use k, and
is the impedance parameter related to distance decay effect for road type r and land use k. lists the results of the calibrated parameters of local accessibility. All other certain calibrated parameters are listed in , where the value of β in zonal accessibility calibration refers to a previous study on Toronto (Kasraian, Maat, and van Wee Citation2017). Besides, the data sets for the A-VCA calibration were randomly divided into two groups, that is, training samples (60%) and validation samples (40%). Thus, the training samples used to calibrate the A-VCA model are completely independent from the validation samples used to evaluate the model performance.
Table 3. The calibrated parameters of local accessibility in this study.
Table 4. Calibrated parameters for zonal accessibility, Cobb–Douglas function, RFA formulation, and neighborhood interaction in the A-VCA model.
4.2. Simulation of urban land use changes
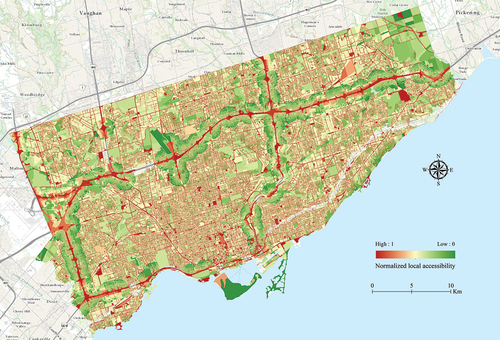
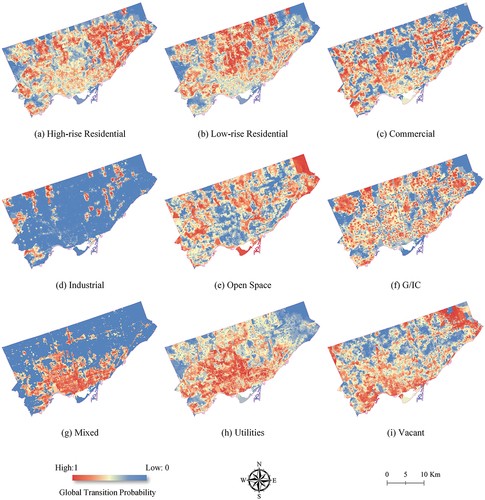
The estimation of accessibility is the first step of the implementation of the proposed A-VCA model for the land use simulation in this study. As mentioned in Section 3, the accessibility used in this study consists of two separate components, that is, the zonal accessibility, generated by gravity model with actual in-vehicle travel time from the TTS records, and the local accessibility estimated based on the hierarchical distance decay effect. illustrate the zonal accessibility results for nine land use types and the local accessibility results toward different land use and road hierarchies, respectively. Generally, the higher zonal accessibility for urban land types of residential, commercial, G/IC, mixed, and utilities is mainly located in the central area of Toronto. The higher zonal accessibility for industrial land use is found in the west, whereas the higher zonal accessibility for open space and vacant is in the east. For local accessibility, the higher values are found mainly around the highways (Ontario 401 Express, Don Valley Express, and Gardiner Express) since they have higher priority in the estimation of local accessibility.
Figure 4. The normalized zonal accessibility for the nine land use subtypes in the study area.
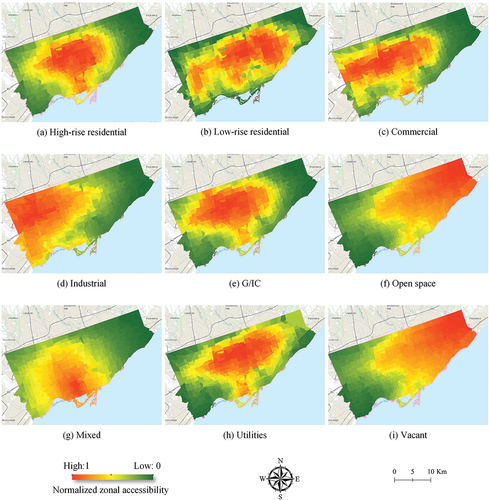
Figure 5. The normalized local accessibility in the study area.
We used the training data set that contains the urban land use changes and auxiliary geospatial variables to calibrate the RFA regression model and estimate the land use suitability for each urban land use type. visualizes the spatial patterns of the land use suitability for nine urban land use types after a minimum–maximum normalization. They describe the suitability for specific land use type to covert according to the essential nature of land use. This pattern of land use suitability will be combined with the estimated accessibility, the neighborhood effect, the constraints of conversion, and stochastic factor to update the final conversion probability in every iteration of the simulation process according to EquationEquation (5)(5)
(5) .
Figure 6. Spatial patterns of land use suitability for the nine urban land use subtypes.
The proposed A-VCA model was applied to simulate the land use changes among different urban land use types from 2012 to 2016. The simulation will keep iterating until all land use changes reach the land use areas in the terminate year. The computational complexity of the proposed A-VCA during the simulation iteration is , where T is the total iteration time, K is the number of urban functional types, N is the total land use parcels in the study area, and J is the number of land use parcels within the neighborhood buffer range. The proposed A-VCA model was implemented in C++ programming language. We carried out the simulations on a local workstation equipped with Intel Core i9-9900 K CPU, NVIDIA GeForce RTX 2080 (8 GB graphics memory), and 16 GB dual-channel DDR4 RAM. The computational time cost for the entire simulation process was 37.32 ± 3.42 s in 10 times repeating simulations.
We presented the actual () and simulated () patterns in 2016 to show a visual comparison at global scale. Overall, the simulated pattern agrees well with the actual land use across the entire study area. The zoom-in view of the simulation result in downtown Toronto is also illustrated in to present more spatial details of land use changes and the spatial agreement of the simulation result. From the zoom-in view of the downtown Toronto (), we can see that obvious land use changes were taking place during this period, especially in areas marked with dashed circles. Favorably, most of the changed land parcels were well simulated with the proposed A-VCA model ().
Figure 7. The simulated and actual land use patterns in this study.
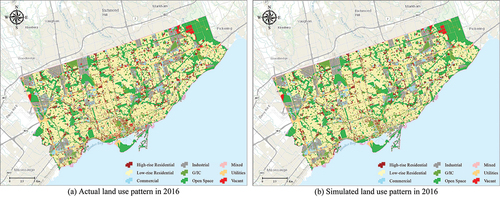
Figure 8. Enlargement of simulated and actual land use patterns in downtown Toronto.
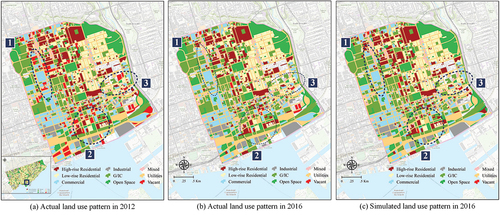
The regions marked with dashed circles () are three typical areas where urban land use changes were taking place during this period. Region 1 is an aggregated commercial zone near the Yonge Street. The main change of land use in this area was the transition from vacant to commercial land use. In region 2, many vacant land parcels were transformed into G/IC buildings during this period because this area possesses very high accessibility to multilevel roads and various land uses. Region 3 is the south cabbage town of Toronto with many low-rise residential buildings aggregated (e.g. semi-detached house, town house). Some vacant land parcels were developed into functional buildings like G/IC and mixed uses (residential and commercial). Our model generated a good result to show the details of land use changes in these three regions.
4.3. Assessments of the urban land use simulation
To quantitatively evaluate the performance of the simulation, we first summarized the proportions of actual and simulated areas of land use changes for each land use type and examined their agreement (). We found that the average bias of all land use types is +0.56% for the entire City of Toronto, and the largest bias of the simulation is the vacant type (−2.52%). As to the downtown Toronto, relatively higher average bias was observed for all land use types (+1.37%), and the largest bias was found in the commercial land type (−3.84%). This might be due to the fact that there are much more fragmented land parcels in the downtown Toronto than in the entire city. Nevertheless, the small biases of the simulated land use pattern in suggest that the proposed A-VCA model is capable of simulating the changes of multiple urban land use types at least from the quantity perspective.
Table 5. The actual and simulated proportions of land use changes in the City of Toronto and downtown Toronto.
In order to quantify spatial agreement of the simulation against actual land use pattern, we constructed the confusion matrix of the simulation result and estimated three indicators described in Section 3, that is, the kappa, FoM, and CPA indicators. The results of these three indicators are summarized in . From the assessment results shown in the table, the proposed A-VCA model yields satisfactory pattern agreement when applied in the City of Toronto with both values of kappa and overall accuracy higher than 0.90. Moreover, the FoM indicator, which focuses on the change simulation and can avoid bias introduced by persistent unchanged land parcels, yields a value of 0.283 for the study area. According to the recent studies on traditional urban development simulations (from nonurban to urban), a range of FoM values from 0.10 to 0.30 have been reported at various spatial scales (Chen et al. Citation2014; Thapa and Murayama Citation2011; Xu, Zhang, and Chen Citation2020). Thus, our simulation result achieves similar and even slightly better than the results reported previously, considering the simulation was conducted among different subtypes of urban land use changes. Moreover, we conducted multiple repeating simulations to estimate the CPA and its standard deviation that take the transition area into consideration. A CPA value of 72.83% ± 1.535% was derived after 10 times repeating simulations, indicating that the proposed A-VCA model is capable of describing the urban land use change with satisfactory accuracy and stability.
Table 6. Accuracy assessment and model comparisons for urban land use simulation.
To demonstrate the outperformance of our proposed A-VCA model, we compared the A-VCA model with three existing models that are capable of simulating multitype land use changes. These comparative models include the original VCA model (Yao et al. Citation2017) without the accessibility component and two grid-based CA models, that is, the ANN-CA model (Li and Yeh Citation2002) and the future land use simulation (FLUS) model (Liu et al. Citation2017). The purpose of the comparison with the VCA model is to test the effectiveness of the accessibility-interactive mechanism in the vector-based simulation strategy; and the comparisons with the two grid-based CA models are to examine the superiority of the vector-based strategy in simulating fragmented land use changes at a fine scale. All these comparative models were calibrated with the same geospatial variables listed in , and the transition probabilities were estimated without the accessibility variables. As to the grid-based ANN-CA and FLUS models, the urban land use change was calibrated and simulated at spatial resolution of 30 m, which is a commonly used resolution in many previous grid-based CA studies. The comparison results are summarized in . We can observe from the table that the simulated result from the VCA model is apparently not as good as the result simulated from the A-VCA model. All three assessment indicators show decline in varying degree (the second row in ) compared with those of the A-VCA model. This confirms the importanct role of accessibility in driving the urban land use dynamics, and the cooperation of accessibility in the CA model can better simulate the subtle land use changes in urban area. The comparisons against the two grid-based CA models also show lower kappa, FoM, and cumulative PA values of the ANN-CA and FLUS models (the last two rows in ). Note that the cumulative PA values for these two grid-based CA models were estimated based on grid unit and thus may not be comparable to the value of the A-VCA model. It is worth mentioning that the assessment indicators for the two grid-based CA models are even lower than that of the VCA model, which suggests the effectiveness of the vector-based strategy in the simulation of fractal land use changes among multiple urban subtypes at a finer spatial scale.
The size of land parcel is the key variable for determining the details of urban land use from both perspectives of spatial detail and urban functional types. Thus, the sensitivity of the simulation performance to the size of land parcel needs to be examined. In order to conduct the simulation on different sizes of land parcel, we manually broke down each of the original land parcel into two (1/2), three (1/3), and four (1/4) subparcels, and maintained the land use types of the subparcel consistent to the original ones. Within each original land parcel, the areas of the broken subparcel were kept as equal as possible. Then we conducted the simulations on the broken subparcels to test the sensitivity of the model performance to the land parcel size. The quantitative comparison among different land parcel sizes is summarized in . From the table, we can observe that all the assessment indicators show a slight decrease as the size of parcel becomes smaller. Such a minor performance degradation might probably be due to the reason that the increased number of land parcels introduces much more complex conflicts among different urban functional types. As expected, the computational cost increased dramatically (from 37.32 to 202.57 s) as the size of land parcel became smaller since the total number of land parcels was greatly multiplied in each iteration and the neighborhood effect involved much more land parcels within the buffer range.
Table 7. Sensitivity of land parcel size to the model performance.
4.4. Morphological pattern of Toronto urban land use changes
The visualization of simulation results shows that most of the urban land use changes were mainly taking place in downtown area during the study period. Most of the high-rise residential land uses are located in the downtown area, which possesses the highest land price in Toronto and is intensively built. The extent of high-rise residential land parcels was spreading because of higher housing demands in the urban center. The newly converted high-rise residential land parcels are found around the existing ones and scattered alongside main road networks, which is mainly driven by the convenient transportation facilities and high accessibility around this area. Both give evidence that the downtown Toronto has superior local and zonal accessibilities toward most of the land uses and better access to various facilities, motivating tenants to live in downtown and inspiring investors and government to develop more high-rise residential land uses in this area. On the contrary, most of the transitions into low-rise residential land use were simulated outside downtown Toronto, most of which were formed with old communities and rowed by townhouses or semi-detached houses.
The G/IC and open space land uses were simulated closed with residential (both high-rise and row-rise) land parcels since the deployments of public facility have to take the range of geographic service areas into consideration (Donnelly Citation2013). This can be partially supported by the zonal accessibility maps in that high zonal accessibility of G/IC, open space, and residential land uses share a large overlapping area. The transition to mixed land use (commercial and high-rise residential) was mainly simulated to be near to the main road in the downtown area (e.g. Yonge Street of Toronto, ) because of the demand for both commercial and residential land use types in the densely built downtown area. The industrial land use was simulated around the original industrial estates along expressways (404 and 401) and in the southeast lake shore area of Toronto near to the harbor where many traditional factories are located. Both of those industrial estates have superior accessibility for promoting productive elements and reducing transportation costs.
4.5. The integration of accessibility and vector-based land use simulation
As previous studies suggest, the transport system is one of the crucial drivers for urban growth and urban land changes by providing accessibility and economic opportunity to the surrounding lands and social activities (Iacono, Levinson, and El-Geneidy Citation2008; Wee Citation2004). Accessibility is the typical indicator for describing travel behavior in urban area (Luna, J, and Shoshanna Citation2018). Thus, in this study, we introduced the accessibility derived from actual travel time data rather than simplified Euclidean distances to simulate fine-scale urban land use changes driven by transportation facilities. The accessibility at both scales, that is, the zonal accessibility calculated at TAZ scale and the local describing proximity of land parcel to the multilevel road network, was considered in this study and was numerically combined into one through the Cobb–Douglas function. In most previous CA simulation studies (Chen et al. Citation2014; Yao et al. Citation2017), the accessibility described as simplified proximity usually has a relatively lower priority and is only applied for estimating the basic land use suitability. In this study, the coupling mechanism of accessibility and CA simulation considers the accessibility as a coequal component with the land use suitability for the estimation of the final transition probability. The comparison results listed in clearly show the outperformance of this proposed coupling mechanism in the simulation of subtle urban land use changes among different functional types. Note that, apart from the travel time, the information of road width is supposed to be another key variable of the transportation system that contributes to driving the urban land use changes. Incorporation of the road width variable into the A-VCA model is potentially helpful for better simulation of urban land use changes. This hypothesis will be tested in future studies as long as accuracy measurements of road width are available.
The vector-based land use simulation strategy was adopted to establish the A-VCA model and applied for the simulation of urban land use changes in the City of Toronto. Compared with traditional grid-based representation, previous studies suggested that the vector-based strategy was more suitable for fine-scale land use simulations (Abolhasani et al. Citation2016; Dahal and Chow Citation2015; Barreira-González, Gómez-Delgado, and Aguilera-Benavente Citation2015; Chen et al. Citation2014; Lu, Cao, and Zhang Citation2015). When introducing the accessibility to CA simulation, the fine-scale shape of land parcel is more suitable for describing subtle land use changes driven by accessibility (e.g. actual travel cost in the transportation network). The vector format data is capable of capturing the changes of fine-scale land parcels with irregular polygons and avoid the bias caused by regular grid cells (Yao et al. Citation2017; Chen et al. Citation2019; Barreira-González, Gómez-Delgado, and Aguilera-Benavente Citation2015). The application of the proposed A-VCA model in urban land use simulation of the City of Toronto shows satisfied accuracies and good morphological patterns. The superiority of vector-based strategy in such fine-scale simulation was also confirmed in this study () by the comparison of the proposed A-VCA and the popular grid-based FLUS model.
5. Conclusions
This study proposed an accessibility-interacted vector-based land use simulation model, namely, A-VCA model, to investigate the urban land use changes driven by transportation facilities. The accessibility at both local and zonal scales derived from auto-in-vehicle travel time data was considered as a key driver of fine-scale urban land use changes among different urban subtypes. The proposed A-VCA model was applied and tested in the City of Toronto, Canada, to simulate the fine-scale urban land use changes during 2012–2016. The results show that our model is capable of accurately simulating the subtle urban land use changes driven by the accessibility with good morphological features. The satisfactory performance of the A-VCA model was testified by the quantitative assessment with both values of kappa and overall accuracy higher than 0.90 and FoM larger than 0.28. The effectiveness of the accessibility-interactive mechanism was confirmed by the comparison with the original VCA model. Besides, the superiority of the vector-based strategy in the simulation of subtle urban land use change among different functional types has been demonstrated through the comparisons with the two popular grid-based CA models.
However, due to the unavailability of detailed urban functional land use data, we only calibrated and evaluated the proposed model in the same period (2012–2016). In fact, calibrating the model in one period, and then applying the calibrated model for the simulation and evaluating it in another period can better justify the performance of the proposed model. Besides, whether or not the proposed A-VCA model can be generalized and directly applied for other cities has not been tested and still needs further investigations. Nevertheless, the proposed model provides new tools for fine-scale simulation of subtle land use change among different functional types in urban area, which are rather useful for many urban-related studies such as job–housing matching and urban facility layout optimization. Additionally, the results and findings can deepen our understanding of the interaction between land use changes and transportation, and provide knowledge for urban growth management and transportation planning.
Disclosure statement
No potential conflict of interest was reported by the author(s).
Additional information
Funding
Notes on contributors
Xiaocong Xu
Xiaocong Xu received his PhD degree in geographic information science from Sun Yat-Sen University, Guangzhou, China, in 2017. He is currently a research fellow with the School of Geography and Planning, Sun Yat-Sen University, Guangzhou, China. His research interests include applications of remote sensing technique in land cover classification, land cover change monitoring, and land use change simulation.
Dachuan Zhang
Dachuan Zhang received his PhD degree in geographic information science from Sun Yat-Sen University, Guangzhou, China, in 2021. His research interests are urban growth and land use change simulation.
Xiaoping Liu
Xiaoping Liu received his PhD degree in remote sensing and geographic information sciences from Sun Yat-Sen University, Guangzhou, China, in 2008. He is a professor with the School of Geography and Planning, Sun Yat-Sen University. His research interests include image processing, artificial intelligence, and geographical simulation.
Jinpei Ou
Jinpei Ou received his PhD degree in geographic information science from Sun Yat-Sen University, Guangzhou, China, in 2016. He is currently an associate professor with the School of Geography and Planning, Sun Yat-Sen University. His research interests are spatial simulation and optimization, remote sensing processing, and carbon emission.
Xinxin Wu
Xinxin Wu received her MS degree in geographic information science from Sun Yat-Sen University, Guangzhou, China, in June 2020. She is currently a PhD candidate in cartography and geography information system of Sun Yat-Sen University, Guangzhou, China. Her research interests include multi-source spatial data mining and urban morphology understanding.
References
- Abolhasani, S., M. Taleai, M. Karimi, and A. Rezaee Node. 2016. “Simulating Urban Growth under Planning Policies through Parcel-based Cellular Automata (ParCA) Model.” International Journal of Geographical Information Science 30 (11): 2276–2301. doi:10.1080/13658816.2016.1184271.
- Aljoufie, M., M. Zuidgeest, M. Brussel, J. van Vliet, and M. van Maarseveen. 2013. “A Cellular Automata-based Land Use and Transport Interaction Model Applied to Jeddah, Saudi Arabia.” Landscape and Urban Planning 112: 89–99. doi:10.1016/j.landurbplan.2013.01.003.
- Badoe, D.A., and E.J. Miller. 2000. “Transportation Land-use Interaction: Empirical Findings in North America, and Their Implications for Modeling.” Transportation Research Part D 5 (4): 235–263. doi:10.1016/S1361-9209(99)00036-X.
- Barreira-González, P., M. Gómez-Delgado, and F. Aguilera-Benavente. 2015. “From Raster to Vector Cellular Automata Models: A New Approach to Simulate Urban Growth with the Help of Graph Theory.” Computers, Environment and Urban Systems 54: 119–131. doi:10.1016/j.compenvurbsys.2015.07.004.
- Batty, M., Y. Xie, and Z. Sun. 1999. “Modeling Urban Dynamics through GIS-based Cellular Automata.” Computers, Environment and Urban Systems 23 (3): 205–233. doi:10.1016/S0198-9715(99)00015-0.
- Belgiu, M., and L. Drăguţ. 2016. “Random Forest in Remote Sensing: A Review of Applications and Future Directions.” Isprs Journal of Photogrammetry & Remote Sensing 114: 24–31. doi:10.1016/j.isprsjprs.2016.01.011.
- Bertolini, L. 2017. Planning the Mobile Metropolis: Transport for People, Places and the Planet. London, England: Bloomsbury Publishing.
- Chang, J.S. 2006. “Models of the Relationship between Transport and Land Use: A Review.” Transport Reviews 26 (3): 325–350. doi:10.1080/01441640500468432.
- Chen, Y., X. Chen, Z. Liu, and X. Li. 2020. “Understanding the Spatial Organization of Urban Functions Based on Co-location Patterns Mining: A Comparative Analysis for 25 Chinese Cities.” Cities 97: 102563. doi:10.1016/j.cities.2019.102563.
- Chen, Y., X. Li, X. Liu, and B. Ai. 2014. “Modeling Urban Land-use Dynamics in a Fast Developing City Using the Modified Logistic Cellular Automaton with a Patch-based Simulation Strategy.” International Journal of Geographical Information Science 28 (2): 234–255. doi:10.1080/13658816.2013.831868.
- Chen, Y., X. Li, X. Liu, H. Huang, and S. Ma. 2019. “Simulating Urban Growth Boundaries Using a Patch-based Cellular Automaton with Economic and Ecological Constraints.” International Journal of Geographical Information Science 33 (1): 55–80. doi:10.1080/13658816.2018.1514119.
- Chen, Y., X. Liu, X. Li, X. Liu, Y. Yao, G. Hu, X. Xu, and F. Pei. 2017. “Delineating Urban Functional Areas with Building-level Social Media Data: A Dynamic Time Warping (DTW) Distance Based K-medoids Method.” Landscape and Urban Planning 160: 48–60. doi:10.1016/j.landurbplan.2016.12.001.
- Dahal, K.R., and T.E. Chow. 2015. “Characterization of Neighborhood Sensitivity of an Irregular Cellular Automata Model of Urban Growth.” International Journal of Geographical Information Science 29 (3): 475–497. doi:10.1080/13658816.2014.987779.
- Data Management Group. 2013. Transportation Tomorrow Survey 2011: Data Guide. Toronto, Ontario, Canada: Department of Civil Engineering, University of Toronto. http://dmg.utoronto.ca/pdf/tts/2011/dataguide2011.pdf
- Donnelly, F.P. 2013. “The Geographic Distribution of United States Public Libraries: An Analysis of Locations and Service Areas.” Journal of Librarianship & Information Science 46 (2): 110–129. doi:10.1177/0961000612470276.
- Erlander, S., and N. Stewart. 1990. The Gravity Model in Transportation Analysis—Theory and Extensions. Utrecht, The Netherlands: VSP.
- Feng, Y., and X. Tong. 2018. “Dynamic Land Use Change Simulation Using Cellular Automata with Spatially Nonstationary Transition Rules.” GIScience & Remote Sensing 55 (5): 678–698. doi:10.1080/15481603.2018.1426262.
- Glaeser, E.L., M.E. Kahn, and J. Rappaport. 2008. “Why Do the Poor Live in Cities? The Role of Public Transportation.” Journal of Urban Economics 63 (1): 1–24. doi:10.1016/j.jue.2006.12.004.
- González, P.B., M. Gómez-Delgado, and F.-A. Benavente. 2015. “Vector-based Cellular Automata: Exploring New Methods of Urban Growth Simulation with Cadastral Parcels and Graph Theory.” In Proceedings in 14th International Conference on Computers in Urban Planning and Urban Management. Cambridge.
- Hansen, W.G. 1959. “How Accessibility Shapes Land Use.” Journal of the American Institute of Planners 25 (2): 73–76. doi:10.1080/01944365908978307.
- He, Y., B. Ai, Y. Yao, and F. Zhong. 2015. “Deriving Urban Dynamic Evolution Rules from Self-adaptive Cellular Automata with Multi-temporal Remote Sensing Images.” International Journal of Applied Earth Observation and Geoinformation 38: 164–174. doi:10.1016/j.jag.2014.12.014.
- Iacono, M.J., and D.M. Levinson. 2009. “Predicting Land Use Change: How Much Does Transportation Matter.” Transportation Research Record 2119: 130–136. doi:10.3141/2119-16.
- Iacono, M., D. Levinson, and A. El-Geneidy. 2008. “Models of Transportation and Land Use Change: A Guide to the Territory.” Journal of Planning Literature 22 (4): 323–340. doi:10.1177/0885412207314010.
- Kasraian, D., K. Maat, and B. van Wee. 2017. “The Impact of Urban Proximity, Transport Accessibility and Policy on Urban Growth: A Longitudinal Analysis over Five Decades.” Environment & Planning B Urban Analytics & City Science 46 (6): 1000–1017. doi:10.1177/2399808317740355.
- Kelobonye, K., G. McCarney, J.C. Xia, M.S.H. Swapan, F. Mao, and H. Zhou. 2019. “Relative Accessibility Analysis for Key Land Uses: A Spatial Equity Perspective.” Journal of Transport Geography 75: 82–93. doi:10.1016/j.jtrangeo.2019.01.015.
- Li, Z., L. Jiao, B. Zhang, G. Xu, and J. Liu. 2021. “Understanding the Pattern and Mechanism of Spatial Concentration of Urban Land Use, Population and Economic Activities: A Case Study in Wuhan, China.” Geo-spatial Information Science 24 (4): 678–694. doi:10.1080/10095020.2021.1978276.
- Li, X., and A.G.-O. Yeh. 2002. “Neural-network-based Cellular Automata for Simulating Multiple Land Use Changes Using GIS.” International Journal of Geographical Information Science 16 (4): 323–343. doi:10.1080/13658810210137004.
- Liu, X., Y. Huang, X. Xu, X. Li, X. Li, P. Ciais, P. Lin, et al. 2020. “High-spatiotemporal-resolution Mapping of Global Urban Change from 1985 to 2015.” Nature Sustainability 3 (7): 564–570. doi:10.1038/s41893-020-0521-x.
- Liu, X., X. Li, X. Shi, X. Zhang, and Y. Chen. 2010. “Simulating Land-use Dynamics under Planning Policies by Integrating Artificial Immune Systems with Cellular Automata.” International Journal of Geographical Information Science 24 (5): 783–802. doi:10.1080/13658810903270551.
- Liu, X., X. Liang, X. Li, X. Xu, J. Ou, Y. Chen, S. Li, S. Wang, and F. Pei. 2017. “A Future Land Use Simulation Model (FLUS) for Simulating Multiple Land Use Scenarios by Coupling Human and Natural Effects.” Landscape and Urban Planning 168: 94–116. doi:10.1016/j.landurbplan.2017.09.019.
- Liu, S., and X. Zhu. 2004. “Accessibility Analyst: An Integrated GIS Tool for Accessibility Analysis in Urban Transportation Planning.” Environment and Planning. B, Planning & Design 31 (1): 105–124. doi:10.1068/b305.
- Lobo, J., L.M.A. Bettencourt, D. Strumsky, and G.B. West. 2013. “Urban Scaling and the Production Function for Cities.” Plos One 8 (3): e58407. doi:10.1371/journal.pone.005840.
- Lu, Y., M. Cao, and L. Zhang. 2015. “A Vector-based Cellular Automata Model for Simulating Urban Land Use Change.” Chinese Geographical Science 25 (1): 74–84. doi:10.1007/s11769-014-0719-9.
- Lu, Y., S. Laffan, C. Pettit, and M. Cao. 2019. “Land Use Change Simulation and Analysis Using A Vector Cellular Automata (CA) Model: A Case Study of Ipswich City, Queensland, Australia.” Environment and Planning B: Urban Analytics and City Science 47 (9): 1605–1621. doi:10.1177/2399808319830971.
- Luna, X.Y., E.J. Miller, and S. Shoshanna. 2018. “Exploring the Impact of Different Cut-off Times on Isochrone Measurements of Accessibility.” Transportation Research Record 2672 (49): 113–124. doi:10.1177/0361198118783113.
- Moghadam, S.A., M. Karimi, and K. Habibi. 2018. “Simulating Urban Growth in a Megalopolitan Area Using a Patch‐based Cellular Automata.” Transactions in GIS 22 (1): 249–268. doi:10.1111/tgis.12309.
- Mohan Rajan, S.N., and A. Loganathan. 2021. “Modelling Spatial Drivers for LU/LC Change Prediction Using Hybrid Machine Learning Methods in Javadi Hills, Tamil Nadu, India.” Journal of the Indian Society of Remote Sensing 49 (4): 913–934. doi:10.1007/s12524-020-01258-6.
- Montolio, D., and A. Solé Ollé. 2009. “Road Investment and Regional Productivity Growth: The Effects of Vehicle Intensity and Congestion.” Papers in Regional Science 88 (1): 99–118. doi:10.1111/j.1435-5957.2008.00167.x.
- Ortuzar, J., and L. Willusen. 2001. Modeling Transport. 3nd ed. Chichester, Sussex England: John Wiley and Sons.
- Palczewska, A., J. Palczewski, R.M. Robinson, and D. Neagu. 2014. “Interpreting Random Forest Classification Models Using a Feature Contribution Method.” In Integration of Reusable Systems, edited by Thouraya Bouabana-Tebibel and Stuart H. Rubin, 193–218. Cham: Springer.
- Pinto, N., A.P. Antunes, and J. Roca. 2017. “Applicability and Calibration of an Irregular Cellular Automata Model for Land Use Change.” Computers, Environment and Urban Systems 65: 93–102. doi:10.1016/j.compenvurbsys.2017.05.005.
- Pontius, R.G., W. Boersma, J.C. Castella, K. Clarke, T. de Nijs, C. Dietzel, Z. Duan, et al. 2008. “Comparing the Input, Output, and Validation Maps for Several Models of Land Change.” The Annals of Regional Science 42 (1): 11–37. doi:10.1007/s00168-007-0138-2.
- Rad, T.G., and A. Alimohammadi. 2021. “Modeling Relationships between the Network Distance and Travel Time Dynamics for Assessing Equity of Accessibility to Urban Parks.” Geo-spatial Information Science 24 (3): 509–526. doi:10.1080/10095020.2020.1858189.
- Rodrigue, J.P., C. Comtois, and B. Slack. 2016. The Geography of Transport Systems. London, England: Routledge.
- Salvini, P., and E.J. Miller. 2005. “ILUTE: An Operational Prototype of a Comprehensive Microsimulation Model of Urban Systems.” Networks and Spatial Economics 5: 217–234. doi:10.1007/s11067-005-2630-5.
- Santé, I., A.M. García, D. Miranda, and R. Crecente. 2010. “Cellular Automata Models for the Simulation of Real-world Urban Processes: A Review and Analysis.” Landscape and Urban Planning 96 (2): 108–122. doi:10.1016/j.landurbplan.2010.03.001.
- Santías, F.R., C. Cadarso-Suárez, and M.X. Rodríguez-Álvarez. 2011. “Estimating Hospital Production Functions through Flexible Regression Models.” Mathematical and Computer Modelling 54 (7–8): 1760–1764. doi:10.1016/j.mcm.2010.11.087.
- Sim, J., and C.C. Wright. 2005. “The Kappa Statistic in Reliability Studies: Use, Interpretation, and Sample Size Requirements.” Physical Therapy 85 (3): 257–268. doi:10.1093/ptj/85.3.257.
- Soteropoulos, A., M. Berger, and F. Ciari. 2019. “Impacts of Automated Vehicles on Travel Behaviour and Land Use: An International Review of Modelling Studies.” Transport Reviews 39 (1): 29–49. doi:10.1080/01441647.2018.1523253.
- Stevens, D., and S. Dragićević. 2007. “A GIS-based Irregular Cellular Automata Model of Land-use Change.” Environment and Planning. B, Planning & Design 34 (4): 708–724. doi:10.1068/b32098.
- Thapa, R.B., and Y. Murayama. 2011. “Urban Growth Modeling of Kathmandu Metropolitan Region, Nepal.” Computers, Environment and Urban Systems 35 (1): 25–34. doi:10.1016/j.compenvurbsys.2010.07.005.
- Van Vliet, J., A.K. Bregt, and A. Hagen-Zanker. 2011. “Revisiting Kappa to Account for Change in the Accuracy Assessment of Land-use Change Models.” Ecological Modelling 222 (8): 1367–1375. doi:10.1016/j.ecolmodel.2011.01.017.
- Vanegas, C.A., D.G. Aliaga, B. Benes, and P. Waddell. 2009. “Visualization of Simulated Urban Spaces: Inferring Parameterized Generation of Streets, Parcels, and Aerial Imagery.” IEEE Transactions on Visualization and Computer Graphics 15 (3): 424–435. doi:10.1109/TVCG.2008.193.
- Verburg, P.H., P.P. Schot, M.J. Dijst, and A. Veldkamp. 2004. “Land Use Change Modelling: Current Practice and Research Priorities.” GeoJournal 61 (4): 309–324. doi:10.1007/s10708-004-4946-y.
- Wee, G.B.V. 2004. “Accessibility Evaluation of Land-use and Transport Strategies: Review and Research Directions.” Journal of Transport Geography. doi:10.1016/j.jtrangeo.2003.10.005.
- Wegener, M. 2021. “Land-use Transport Interaction Models.” In Handbook of Regional Science, edited by Manfred M. Fischer and Peter Nijkamp, 229–246. Berlin, Germany: Springer.
- Wise, S., A. Crooks, and M. Batty. 2016. “Transportation in Agent-Based Urban Modelling.” International Workshop on Agent Based Modelling of Urban Systems, 129–148. doi:10.1007/978-3-319-51957-9_8.
- Wu, F., and D. Martin. 2002. “Urban Expansion Simulation of Southeast England Using Population Surface Modelling and Cellular Automata.” Environment & Planning A 34 (10): 1855–1876. doi:10.1068/a3520.
- Xu, X.C., Y.Y. Zhang, and Y.M. Chen. 2020. “Projecting China’s Future Water Footprint under the Shared Socio-economic Pathways.” Journal of Environmental Management 260. doi:10.1016/j.jenvman.2020.110102.
- Yao, Y., X. Liu, X. Li, P. Liu, Y. Hong, Y. Zhang, and K. Mai. 2017. “Simulating Urban Land-use Changes at a Large Scale by Integrating Dynamic Land Parcel Subdivision and Vector-based Cellular Automata.” International Journal of Geographical Information Science 31 (12): 2452–2479. doi:10.1080/13658816.2017.1360494.
- Yeh, A.G.O., X. Li, and C. Xia. 2021. “Cellular Automata Modeling for Urban and Regional Planning.” In Urban Informatics, edited by Wenzhong Shi, Michael F. Goodchild, Michael Batty, Mei-Po Kwan, and Anshu Zhang, 865–883. Singapore: Springer Singapore.
- Zhang, D., X. Liu, Z. Lin, X. Zhang, and H. Zhang. 2020. “The Delineation of Urban Growth Boundaries in Complex Ecological Environment Areas by Using Cellular Automata and a Dual-environmental Evaluation.” Journal of Cleaner Production 256: 120361. doi:10.1016/j.jclepro.2020.120361.
- Zhang, T., W. Zhang, and Z. He. 2021. “Measuring Positive Public Transit Accessibility Using Big Transit Data.” Geo-spatial Information Science 24 (4): 722–741. doi:10.1080/10095020.2021.1993754.