
 ?Mathematical formulae have been encoded as MathML and are displayed in this HTML version using MathJax in order to improve their display. Uncheck the box to turn MathJax off. This feature requires Javascript. Click on a formula to zoom.
ABSTRACT
High Spatial and Spectral Resolution (HSSR) remote-sensing images can provide rich spectral bands and detailed ground information, but there is a relative lack of research on this new type of remote-sensing data. Although there are already some HSSR datasets for deep learning model training and testing, the data volume of these datasets is small, resulting in low classification accuracy and weak generalization ability of the trained models. In this paper, an HSSR dataset Luojia-HSSR is constructed based on aerial hyperspectral imagery of southern Shenyang City of Liaoning Province in China. To our knowledge, it is the largest HSSR dataset to date, with 6438 pairs of 256 × 256 sized samples (including 3480 pairs in the training set, 2209 pairs in the test set, and 749 pairs in the validation set), covering area of 161 km2 with spatial resolution 0.75 m, 249 Visible and Near-Infrared (VNIR) spectral bands, and corresponding to 23 classes of field-validated ground coverage. It is an ideal experimental data for spatial-spectral feature extraction. Furthermore, a new deep learning model 3D-HRNet for interpreting HSSR images is proposed. The conv-neck in HRNet is modified to better mine the spatial information of the images. Then, a 3D convolution module with attention mechanism is designed to capture the global-local fine spectral information simultaneously. Subsequently, the 3D convolution is inserted into the HRNet to optimize the performance. The experiments show that the 3D-HRNet model has good interpreting ability for the Luojia-HSSR dataset with the Frequency Weighted Intersection over Union(FWIoU) reaching 80.54%, indicating that the Luojia-HSSR dataset constructed in this paper and the proposed 3D-HRnet model have good applicable prospects for processing HSSR remote sensing images.
1. Introduction
High Spatial and Spectral Resolution (HSSR) remote-sensing images can provide both rich spectral information and detailed spatial information of the ground surface, which support researchers to detect and identify various targets that are difficult to derive from traditional images. Thus, HSSR images are becoming a potential and important information source in the fields of earth surface information extraction, resource, and ecological environment monitoring. However, at present, most high spectral remote sensing systems are airborne and there is only a limited number of hyperspectral satellites in orbit for civil use (Zhong et al. Citation2021). Thus, HSSR images usually only cover a small spatial area, which hinders the related research of accurate information interpretation (Rangnekar et al. Citation2020). Meanwhile, the spatial resolution of multispectral remote sensing images has been increasing, and a large number of datasets have been constructed to train and test deep learning networks, which have significantly improved the feature extraction effectiveness from high spatial resolution remote sensing images(Gong Citation2018; Grekousis, Mountrakis, and Kavouras Citation2015; Rawat and Wang Citation2017; Zhang, Zhang, and Du Citation2016; Scheirer et al. Citation2012; Hu, Gong, and Zhang Citation2018; Gong et al. Citation2021; Heipke and Rottensteiner Citation2020). In general, it is imperative to study how to use deep learning techniques to improve the efficiency and accuracy of HSSR image interpretation (Zhang and Du Citation2012; Zhang and Luo Citation2020; Ghamisi et al. Citation2017; Khan et al. Citation2018; Li et al. Citation2019).
There exist two types of problems with the hyperspectral datasets used in the current deep learning models. One of the issues is that the sample images are often with relatively low spatial resolution, which makes it difficult for fine target recognition. The other issue is although both spectral and spatial resolutions are high, the volume (or size) of the sample data is small. The models trained by these small datasets may reduce the number of parameters and the generalization ability of the models. Specifically, examples of such small HSSR datasets include the Washington DC Mall,Footnote1 Pavia University and Pavia Center,Footnote2 University of Houston (Citation2018), AeroRIT (Rangnekar et al. Citation2020), WHU-Hi (Zhong et al. Citation2020, Citation2018). Notice that the largest one has only 7.6 million pixels.
In this context, we acquired hyperspectral images of the southern Shenyang City of Liaoning Province in China with an airborne spectro-radiometer AMMHS, and constructed a sample dataset Luojia-HSSR with 6438 pairs of 256 × 256 sized samples (including 3480 pairs in the training set, 2209 pairs in the test set, and 749 pairs in the validation set), corresponding to 23 classes of field-validated ground coverage. “Luojia” is the name of a beautiful hill located in the Wuhan University campus, which is often known as the alias of the university. The dataset has 249 Visible and Near-Infrared (VNIR) spectral bands with a spatial resolution of 0.75 m. The dataset covers an area of 161 km2 with about 249 million pixels. To the best of our knowledge, this is the largest HSSR dataset so far. Furthermore, to take full advantage of the rich spectral and detailed spatialinformation of Luojia-HSSR, we proposed a new deep learning model 3D-HRNets. It extended the HRNet to its 3D version, in order to inherit the advantages of HRNet in processing high spatial resolution data, and simultaneously representing the hyperspectral information by 3D convolution.
The main innovations of this paper involve two aspects. From the dataset point of view, an HSSR dataset Luojia-HSSR was produced. To the best of our knowledge, it is the largest open-source hyperspectral remote sensing dataset, and it is an ideal experimental data for spatial-spectral feature extraction. On the other hand, from the methodology point of view, firstly we found that the spatial information is as important as spectral signals for the HSSR image interpretation. In this regard, we adopted HRNet as the backbone and modified the conv-neck in the HRNet for the spatial information mining of the images. Secondly, in order to explore the spectral information of HSSR images, we designed a 3D convolution module with attention mechanism, which is capable of capturing the global-local fine spectral information simultaneously. Next, in the experiments, we found that I we could achieve the optimal accuracy and computational cost by inserting 3D convolution into the first stage of the HRNet architecture.
2. Related work
This section reviews and analyzes the existing hyperspectral test datasets and hyperspectral deep learning networks.
2.1. Existing hyperspectral test datasets
We analyzed the existing open-access hyperspectral image datasets and compared them with our constructed Luojia-HSSR dataset (). It can be seen that the size of Luojia-HSSR dataset is significantly larger than the existing ones, and the number of categories is also more than others. It can be said that Luojia-HSSR is an important complement to hyperspectral remote sensing dataset as well as the relevant research on deep learning.
Table 1. Open-access hyperspectral image datasets.
2.2. Current hyperspectral network
In addition to the hyperspectral datasets, deep learning models are another key factor for the intelligent interpretation of hyperspectral remote sensing images. Convolutional Neural Networks (CNN) is one of the representative models for deep learning of remote sensing data (Goodfellow, Bengio, and Courville Citation2016; Ma et al. Citation2019; Ding, Zhang, and Bruzzone Citation2020; Hamida et al. Citation2016), and is also widely used for hyperspectral image interpretation (Ghamisi et al. Citation2017; Khan et al. Citation2018; Li et al. Citation2019). This section summarizes the current main stream convolutional neural network models for hyperspectral data interpretation.
The number of CNN filters is proportional to the data channels. Therefore, the number of filters has to be increased for hyperspectral images with more bands, leading to an increase in computational cost. For this reason, researchers often reduce the number of dimensions of high-spectral images to apply the convolutional networks, which however, may lead to loss of spectral information. To solve this problem aroused by the spectral dimension reduction, researchers attempted various methods, such as integrating 2D convolution with 1D convolution and introducing attention mechanisms. For example, Hamida et al. (Citation2016) proposed a CNN that takes into account the given pixel space and spectral neighborhood to complete the spectral and spatial feature classification in an alternating manner. Specifically, by using a 3D patch as input, the first layer adopted a c × 1 × 1 convolution kernel to reduce the spectral dimension, and then a 1 × m × m convolution kernel was used to reduce the spatial dimension, where c and m mean channel and size. Finally, two fully connected layers were utilized to complete the classification. Luo et al. (Citation2018) proposed a 2D convolution-based HSI-CNN model, where spectral space features from a 1D target pixel and its neighborhood were extracted, with these extracted features as input to obtain several 1D feature maps by convolution operations. Subsequently, the 1D feature maps were superimposed into a 2D matrix, as the input to a standard CNN. In addition, most of the existing hyperspectral data interpretation frameworks adopted a patch-based approach, i.e. the images were divided into a series of small overlapping blocks for local learning, which may cause high computational cost. Zheng et al. (Citation2020) addressed this problem by proposing a fast patch-free global sampling learning model FPGA, and introduced a spectral attention-based mechanism to extract spectral features before fusing them with spatial features.
To extract hyperspectral image features more directly, researchers designed some 3D convolutional neural networks. For example, Chen et al. (Citation2016b) proposed a 3D CNN-based regularized deep learning model to extract spectral and spatial features. He, Li, and Chen (Citation2017) proposed a multi-scale 3D convolutional neural network model M3D-DCNN, consisting of 10 convolutional layers, 1 fully connected layer, with a total network depth of 5, to learn multi-scale spatial and spectral features in an end-to-end manner. Roy et al. (Citation2020) proposed an attention-based 3D CNN model A2S2-ResNet, which introduced an adaptive spectral-spatial kernel attention module to identify spectral and spatial features. Zou et al. (Citation2020) proposed the SS3FCN model, which used a patch-free approach to take the original hyperspectral image patches as input. This processing improved the utilization of sparsely labeled images and mitigated the impact on model performance caused by the insufficient sample size. However, most of the convolutions currently used for processing spectral information used small spectral receptive field, which can capture local detail information but are insufficient for dealing with the global spectral features.
3. LuoJia-HSSR dataset construction
We constructed an HSSR dataset Luojia-HSSR based on hyperspectral images of the southern Shenyang City of Liaoning Province in China.
3.1. Study area and data sources
The study area is shown in , with a total area of 161 km2, between 122°28′ – 123°06′ E and 41°12′ – 41°47′ N in the southern temperate sub-humid zone. The highest elevation is 23.5 m and the lowest elevation is 5.5 m.
Figure 1. Study area.
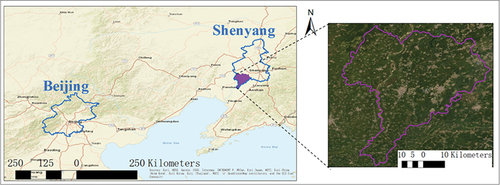
We acquired hyperspectral image data of the study area as the data source to produce the test dataset, with the land-cover data of the region as the reference or label.
(1) Hyperspectral image
With the airborne spectrometer AMMHS produced by Shanghai Institute of Technical Physics, Chinese Academy of Sciences, we acquired the VNIR hyperspectral image in September 2020. After the geometric and radiation correction, we obtained the images and the main information is described as follows:
Coordinate system and projection: WGS_1984_UTM_Zone_51 N.
Geometric accuracy: 1.5–3.0 m.
Spatial resolution of the image: 0.75 m.
Image coverage area: 161 km2.
Image spectral resolution: ≤ 5 nm.
Band information: the total number of bands 249, half-peak width of 4.5, wavelength 391.4597 to 984.0651 nm.
(2) Land-cover data
The land-cover label is derived from the product of dynamic land-cover monitoring program completed in 2020 by the Ministry of Natural Resources of China. The product was delineated manually based on remote sensing images with 0.8–2.0 m spatial resolution according to China’s national standards (Ministry of Natural Resources of People’s Republic of China Citation2021). The minimum polygon outlined was 20 × 20 m2, and the quality control was also carried out according to the national standards (State Administration for Market Regulations and National Standardization Administration of China Citation2020).
3.2. Luojia-HSSR dataset production
We generated the Luojia-HSSR dataset with 6438 pairs of samples covering 161 km2 (approximately 249 million pixels), including 749 pairs for validation, 3480 pairs for training, and 2209 pairs for test. The size of each sample is 256 × 256 pixels. Each pair of samples corresponds to its land-cover label. The details of the Luojia-HSSR dataset are shown in and examples are shown in .
Figure 2. Examples of samples in Luojia-HSSR (a)Urban (b)Sub-urban (c) Countryside (d) Water and road.
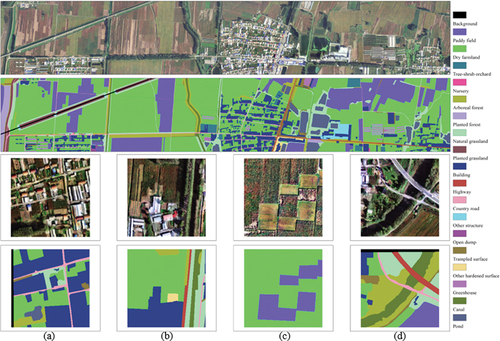
Table 2. Category and size of samples in the Luojia-HSSR dataset.
The steps to produce the dataset are summarized as follows.
(1) Source image cropping: The hyperspectral images of the study area were cropped into 224 blocks that do not overlap with each other.
(2) Land-cover polygon extraction: The cropped hyperspectral images were overlapped with the corresponding land-cover reference data, involving 48 land cover categories in our study area. Two steps were processed for matching the images and the labels: including rough matching based on the GCS-WGS-1984 coordinate, and the fine matching by manual adjustment, were conducted for matching the hyperspectral images and the land-cover polygons. The level of misalignment between the images and the labels was 2 — 3 pixels.
(3) Data set partitioning: The data was cropped into a set of blocks with the size of 1024 × 1024 pixels, which were then divided into training, validation, and test sets. To ensure that each dataset contains a reasonable proportion of land-cover classes, we adopted an iterative stratification method for multi-label data classification (Szymański and Kajdanowicz Citation2017; Szymanski and Kajdanowicz Citation2019). This method considered the second-order relationship between labels so that a more balanced sample distribution can be obtained.
(4) Overlap sampling: The 1024 × 1024 samples were further cropped into the patches with the size of 256 × 256 pixels at an interval of 128 pixels. The patches where invalid values (background) account for more than 80% were deleted.
(5) Sample category adjustment: The sample size varies greatly between categories in this dataset due to the uneven spatial distribution of land cover. For instance, paddy field accounts for 45.7% of the study area, while roads only account for 2%, which may cause bias in model training (Khoshgoftaar, Hulse, and Napolitano Citation2010; Chen et al. Citation2016a; Xu et al. Citation2019). Therefore, we deleted these categories with a small sample size or combined them with other similar categories, resulting in a total of 23 land cover categories.
(6) Adjustment of sample size: To ensure a reasonable ratio and distribution for different land cover classes, we randomly reduced the number of the large-size samples in the training set, including paddy fields, dry farmland, arboreal forest, natural grassland, and building. In contrast, the small-size categories (such as tree-shrub orchard, shrubwood, and open dump) were aggregated by flipping, to ensure a balanced sample size distribution.
3.3. Strengths of Luojia-HSSR
Luojia-HSSR will benefit the society from the following aspects:
(1) Data size and landscape diversity: All the existing sample sets in were collected in small areas within one city. Whereas Luojia-HSSR was collected in an area covering 161 km2, which is hundreds of times larger than the existing ones and covers towns, villages, farmland, forest, etc., with a variety of landscapes.
(2) Classification system: Luojia-HSSR has more categories (24 land cover classes) than the existing datasets, which can provide better algorithm tests and validation.
(3) Luojia-HSSR has both high spatial resolution and high spectral resolution, which is an appropriate experimental data for fine spatial-spectral feature mining of remote sensing images.
4. 3D-HRNet
3D CNN is widely used for hyperspectral image processing because of its advantages in processing multidimensional data, while HRNet has obvious advantages in high spatial resolution image processing (Wang et al. Citation2020). To make full use of the HSSR information of Luojia-HSSR, a new framework 3D-HRNet is proposed in this paper.
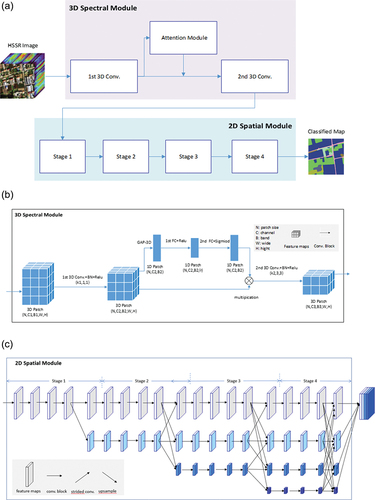
shows the 3D-HRNet framework, where ) is the overall structure of the 3D-HRNet, consisting of a spectral module and a spatial module. The spectral module is designed to extract the hyperspectral information ()). It has two 3D convolutions with one attention module between them. The spatial module is used to capture the spatial information with 4 stages of 2D multi-scale convolution layers ()).
Figure 3. 3D-HRNet framework (a) Overall structure (b) Spectral module (c) Spatial module.
4.1. The spectral module of 3D-HRNet
The spectral module should: (1) make full use of the rich spectral information of the HSSR imagery; and (2) conduct adaptive extraction of information in the important or relevant bands. For this purpose, we designed the spectral module of the proposed 3D-HRNet, consisting of two large 3D convolution kernels and an attention module (). The details of the spectral module are described as follows:
(1) Extracting both global and local spectral features by combining large and small 3D convolution kernels
Both global and local spectral features need to be extracted from the hyperspectral data in order to exploit the rich spectral information of the HSSR imagery. But the traditional spatial 3D convolution structure based on stacked small kernels is not appropriate for global spectral information representation. Peng et al. (Citation2017) found that although stacked small filters can reduce the computational complexity, however, when classification and localization tasks are performed simultaneously (e.g. pixel-by-pixel prediction for the semantic segmentation), a large kernel (with an effective receptive field) always works better than the stacked small filter. Considering this, in this study, we combined a large convolutional kernel and a small convolutional kernel to extract spectral information, in order to minimize the effect of spatial dimension reduction and retain sufficient spatial details.
Specifically, the first 3D convolution has a larger convolutional kernel k1 to capture the global spectral information while a 1 × 1 spatial convolution is used to retain the original information. The second 3D convolution has a smaller convolutional kernel k2 to capture the local spectral information, while a 3 × 3 spatial convolution is taken to capture the spatial features. Both 3D convolutions are normalized by batch normalization, and the Relu activation function was employed to increase the nonlinearity of the model.
The parameters of the initial 3D patch can be written as (N, C1, B1, W, H), where N represents the Patch Size, C is the initial number of channels, B is the initial number of bands, W and H represent the spatial width and height of the patch, respectively. In the spectral module, we keep the high resolution of the spatial domain unchanged to ensure that the rich spatial details can be input into the spatial module. After the first and second 3D convolution, the number of channels and bands of Patch has been changed, and the parameters become (N, C2, B2, W, H) and (N, C3, B3, W, H), respectively. In the experiments (Section 5), we will discuss the effect of parameter settings.
(2) Adaptive spectral feature extraction with attention mechanism
The rich spectral bands of hyperspectral data can greatly increase the interpreting workload. Therefore, it seems necessary to filter out unimportant information and improve the processing efficiency by focusing on the significant or interested bands. Hu, Shen, Sun (Citation2018) achieved better results by using attention mechanism to deal with channel relations. Similarly, Zheng et al. (Citation2020) used band weighting to improve the accuracy of the model. In this study, we designed an attention module between the two 3D convolutions. Via the attention module, the weight for each band was calculated, and the adaptive band selection was implemented according to the weights. Notice that the attention module only processes the spectral information.
Specifically, we firstly reduce the spatial dimension by 3D global average pooled (GAP-3D) to the output feature map of the first 3D convolution, resulting in a 1D spectral feature map whose parameters are (N, C2, B2). Then the band weighting is conducted by two fully connected layers FC1 and FC2. The activate function Sigmoid is used to control the weight to the range of [0, 1] in FC2. In this way, the parameters of the 1D spectral feature map become (N, C2, B2/r) after FC1, where r is the parameter used to balance the model capability and computation workload. Finally, the band weights learned are multiplied with the original spatial information, and the results are fed into the second 3D convolution.
4.2 Spatial module of 3D-HRNet
The spatial module of 3D-HRNet is based on the HRNet model that was proposed by Wang et al. (Citation2020) for dealing with the location-sensitive problem in computer vision. It achieved excellent results in the recognition of small targets and semantic segmentation of high spatial resolution images.
) is the structure of the spatial module of 3D-HRNet. It consists of three stages: (1)) starting from high-resolution convolutional streams, (2)) gradually adding high-resolution convolutional streams to low-resolution convolutional streams, and (3)) connecting multi-resolution convolutional streams in parallel to achieve multi-resolution fusion by exchanging information between the parallel streams.
5. Results and discussion
To analyze the effectiveness of the 3D-HRNet and Luojia-HSSR dataset proposed in this paper, we compared 3D-HRnet with a number of state-of-the-art models in the hyperspectral image and multispectral image processing. The experiments used 3480 pairs ofthe training set and 2209 pairs ofthe test set of the Luojia-HSSR. The hyperspectral models used all the 249 hyperspectral bands while the multispectral models only processed 3 RGB bands. The average of cross-entropy loss function was used, and the parameters were set as patch size 8, learning rate 3e-3, momentum 0.90, and weight decay 5e-4. Convergence was reached after 114 epochs of training with the SGD method on two Nvidia Tesla v100 GPUs on the PyTorch library. The Frequency Weighted Intersection over Union (FWIoU) was employed to evaluate the performance of models, it is an extensive version of Mean Intersection over Union (MIoU) and is used to combat class imbalance. It is more reasonable to use this matric on our dataset, for the class has a dominate sample size needs to be weighed compared to other classes.
Where N represents the number of land use/land cover class which equals to 23 in our experiment; i represents the real classes; j represents the predicted class; Sij represents the number of false positives.
5.1. Results
We selected six models to compare with our proposed 3D-HRNet, including the 3D hyperspectral model 3D CNN (Chen et al. Citation2016b), A2S2-ResNet (Roy et al. Citation2020), SS3FCN (Zou et al. Citation2020), the 2D hyperspectral model HSI-CNN (Luo et al. Citation2018), FPGA (Zheng et al. Citation2020), the multispectral model HRNet (Wang et al. Citation2020). All the seven models were tested on the Loujia-HSSR dataset.
To ensure a fair comparison between different network models, in the experiments, the prediction methods were unified by designing a unified prediction end, i.e. to replace the fully connected layer in the last layer of all patch-based methods with a 1 × 1 convolution. In this way, the effect of encoder feature extraction of each method can be fairly compared. The results of the experiment are shown in . It can be clearly seen that the FWIoU of 3D-HRNet reaches 0.805, significantly higher than other models in the comparison.
Table 3. Performance of different models tested with Luojia-HSSR.
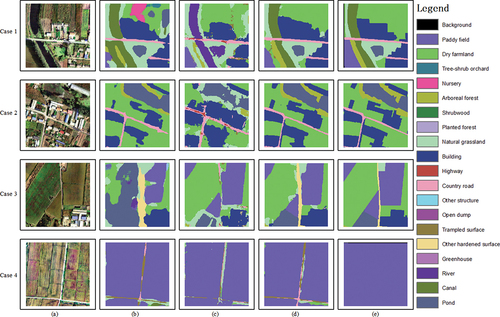
In , the classification maps generated by different models were visually compared. It can be seen that FPGA did not provide satisfactory results in spatial domain. Specifically, the generated polygons are fragmented and the edges are not clear enough, indicating its insufficient ability in representing spatial information. The performance of HRNet is better in terms of spatial morphology and position accuracy of polygons, which shows its capability to capture finer spatial details. However, HRNet produced a large number of misclassifications owing to its inability in exploiting spectral information. For example, in case 3, the large dry farmland on the left in was wrongly recognized as a pond by HRNet. In contrast, the proposed 3D-HRNet can effectively extract both spatial and spectral characteristics, and its classification results are closest to the ground truth. In case (4), the road between the paddy fields was not marked in the reference since its size is smaller than the minimum mapping unit defined in the land-cover monitoring program by the Ministry of Natural Resources of China, but it was identified by the three models.
Figure 4. Visual inspection of different network models tested with Luojia-HSSR (a) Image (b) HRNet (c) FPGA (d) 3D-HRNet (e) Ground truth.
5.2. Effect of size of training set
We conducted further experiments to investigate the effect of training data size on accuracy of the models, including HRNet, FPGA, and 3D-HRNet. The training sample set is divided into 5 levels according to the sample data size, and the results are shown in .
Figure 5. The effect of sample data size on model accuracy.
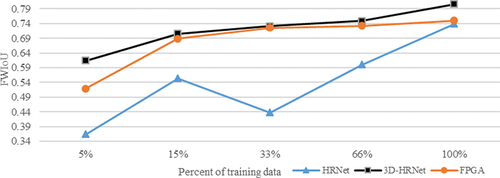
From , it can be seen that:
(1) 3D-HRNet can provide significantly higher classification accuracy compared to other models. Especially in the case of small samples, the accuracy achieved with only 15% of the training dataset is comparable to that with 100% of the training dataset, which indicates that the 3D-HRNet model can achieve a satisfactory accuracy with limited samples.
(2) As sample size increases, the HRNet model using only three bands (RGB) perform converge to the 2D hyperspectral model FPGA. This phenomenon conveys the information that the feature extraction capability of the 2D hyperspectral model is insufficient for representing the Luojia-HSSR dataset.
5.3. Effect of parameter volume
We also compared the performance of the three models of HRNet, FPGA and 3D-HRNet with different parameter sizes. We firstly set the parametric volume of each model to make them comparable. For HRNet, we considered HRNet-18, HRNet-30, HRNet-40 and HRNet-48, where the suffixes such as “-18” represent the number of channels of convolutional layers. Similarly, the 3D-HRNet model is also named 3D-HRNet-18, 3D-HRNet-30 and 3D-HRNet-48, respectively, according to the number of convolutional channels. For FPGAs, we adjusted the number of parameters from two aspects. One is to increase the channel to make the network “wide”, and the model is named FPGA-Wide-11 m. The other is to add more layers to construct a deeper network, and the model is named FPGA-Deep-11 m. The suffixes “-11 m” means the number of parameters is 11 million.
The classification accuracy of each model with different parameter volumes is compared in and . These experimental results show that the accuracy of 3D-HRNet is significantly better than that of HRNet and FPGA with the same volume of parameters.
Figure 6. Effect of parameter volume on model accuracy.
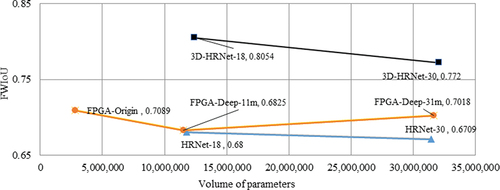
Table 4. Effect of parameter number of the training set on model accuracy.
5.4. 3D-HRNet ablation experiment
In this section, we designed 11 groups of experiments to analyze the parameter sensitivity of 3D-HRNet by adjusting the spatial and spectral variables. Five groups were performed with original HRNet to analyze the effect of introducing 3D convolution to the spectral domain. The results are shown in , in which the models were named based on the rule “model type – number of spatial dimensions – number of spectral dimensions – status of using 3D-convolution”. For example, “3D-HRNet-256-249-1st 2 L-AT” means the model is 3D-HRNet, the input of the spatial module is 256 × 256 pixels, the input of the initial spectral module is 249 bands, the first 2 layers of the spectral module used 3D convolution, and the attention mechanism was used. For the 6th to 10th groups, 3D-HRNet was considered, where 3D CNNs with dimensions (126, 1, 1) and (8, 3, 3) were used in the spectral module, and only the spatial modules were adjusted according to the status of 3D convolution.
Table 5. Effect of input dimension and convolution structure on accuracy.
The experimental results showed that group 8 of experiment achieved the best results with accuracy of 0.805. The details of each group are analyzed as follows:
(1) The 1st and 2nd groups used the original HRNet with spatial dimensions 64 and 256 as inputs of the spatial module, respectively, and spectral dimension was 3 (RGB) bands, without using 3D CNN. The FWIoUs were 0.6800 and 0.7606, respectively. It can be found that for 2D HRNet, the classification accuracy can be effectively improved by merely increasing the spatial input dimension (from 64 to 256). Since the spatial resolution of Luojia-HSSR is very high, the less dimension reduction signifies that more details can be retained to obtain higher accuracy.
(2) Group 3 still used the original HRNet. Compared with group 1, the spatial dimension of the input was wet to 64, but the spectral dimension was increased to 249. In this case, we obtained an FWIoU of 0.5707, which was lower than group 1. This experiment indicates that for 2D HRNet, only introducing more spectral information cannot effectively improve the classification accuracy.
(3) Group 4 also adopted the original HRNet with the same spatial and spectral dimensions as group 1. But here, we replaced all the convolutional layers in the spatial and spectral modules by a 3D CNN with dimension (3, 3, 3). In this case, we obtained FWIoU of 0.6974, which had a 1.7% improvement over group 1. This result reflects that for 2D HRNet, the classification accuracy can also be improved by introducing 3D convolution in the case of equivalent spatial and spectral dimensions.
(4) In the case of group 5, FWIoU 0.7128 was obtained (1.5% better than group 4) by increasing the spectral dimension of group 4. It showed that 3D convolution can effectively learn spectral information, and increasing the spectral dimension can improve the classification accuracy. However, the computational burden (Batch Size/GPU) was doubled.
(5) We started to test the proposed 3D-HRNet model from the group 6. The parameters of this group were kept the same as those of group 5, i.e. the spatial dimension of the output of the spectral module was 64, and the spectral dimension was set as 249. The 2D spatial module was adopted, after completing the 3D convolution of the spectral module. The FWIoU was 0.7511, slightly higher than group 5, but at the same time, the computational burden was reduced by half. It indicated that the computational burden can be effectively reduced by the 3D-HRNet proposed in this paper.
(6) For group 7, we increased the spatial module input dimension to 256 (compared to group 6). The FWIoU was improved by 2.63%. This result showed that the 3D-HRNet model performed better in processing HSSR data by simultaneously exploiting the rich spectral and detailed spatial information.
(7) Group 8 further added an attention module between the two 3D CNN of the spectral module, compared to group 7. The accuracy was further improved to 0.8054, indicating that the introduction of the attention mechanism in the spectral module of the 3D-HRNet model can raise the classification accuracy.
(8) Groups 9 and 10 were designed to test the effect of the depth of the 3D convolution of the spatial module on the accuracy. In group 9, all six convolutions of stage 1 in the spatial module were replaced by 3D convolutions of dimension (3, 3, 3), compared to group 8. It was found that the computational burden was greatly increased while the accuracy decreased by 23%. In group 10, we reduced the spatial input dimension from 256 in group 9 to 128 and found the accuracy was 0.7625, and the computational pressure was reduced to normal. These two groups of experiments demonstrated that we should find a balance between the input dimension of the spatial module and the depth of convolution.
(9) In order to compare the difference between the stacked small kernels and the large kernels in 3D-HRNet, in group 11, we replaced the two three-dimensional convolutions of the spectral module used in group 8 by a series structure with 4 layers of small convolutions. The accuracy was 3.05% lower than that of group 8. This phenomenon indicated that using large spectral kernel convolutions was beneficial for extracting the global spectral features and hence improving the accuracy.
Overall, the experiments show that increasing the spatial dimension in the 2D network can effectively improve the classification accuracy. Next, by comparing the 2D and 3D networks, it is shown that introducing 3D convolution can further boost the accuracy when the same spatial and spectral information is considered. Further experiments demonstrate that by adopting large kernel convolution and attention module, not only the accuracy can be further improved, but also the computational burden can be reduced.
5.5. Experiments on other datasets
To test the robustness of 3D-HRNet, we selected 2 open-access hyperspectral image datasets, University of Houston (Citation2018) and AeroRIT (Rangnekar et al. Citation2020), for additional experiments. We divided the datasets into training set and test set, and the patch size is 128 × 128 pixels owing to the small size of the test images. In this way, Univ. of Houston was divided into 98 training sets and 112 test sets, and the AeroRIT was composed of 449 training sets and 470 test sets. The result in shows that 3D-HRNet is also better than HRnet and FPGA in the two additional datasets, which indicates the reliability of the proposed 3D-HRNet.
Table 6. Accuracy compared with additional hyperspectral test datasets.
6. Conclusion
In this paper, we produced the HSSR remote sensing dataset, Luojia-HSSR, for interpretation of hyperspectral remote sensing data. To the best of our knowledge, Luojia-HSSR is the largest hyperspectral test dataset. Moreover, we proposed a new network 3D-HRnet by combining the advantages of 3D convolution and HRNet, for processing this new type of HSSR remote sensing data, by simultaneously exploiting its rich spectral and spatial information. The experiments showed that the proposed 3D-HRnet achieved promising classification ability for the Luojia-HSSR dataset, and obtained significantly higher accuracy compared to other state of the art neural networks. The results of this paper laid a good foundation for further research and provided cogent support for the interpretation of HSSR imagery.
Disclosure statement
No potential conflict of interest was reported by the author(s).
Data availability statement (DAS)
The data that support the findings of this study are available at https://github.com/yuexu9441/Luojia-HSSR-Dataset from the corresponding author [X. Huang] and author [X.Y. Hu] ([email protected]), upon reasonable request.
Additional information
Funding
Notes on contributors
Yue Xu
Yue Xu is a PhD candidate at Wuhan University. His research interests include deep learning, interpretation of remote sensing images, geospatial information modeling.
Xin Huang
Jianya Gong is a Professor at Wuhan University, and also an academician of Chinese Academy of Science. His research interests include photogrammetry, remote sensing, geo-spatial data modeling, and geographical information system.
Jiayi Li is an IEEE senior member and an Associate Professor of Wuhan University. Her research interests include hyperspectral imagery, sparse representation, computation vision and pattern recognition, and remote sensing images.
Xiangyun Hu
Xin Huang is a Luojia Distinguished Professor at Wuhan University, Wuhan, China. His research interests include remote sensing image processing methods and applications.
Xiangyun Hu is a Luojia Distinguished Professor at Wuhan University, Wuhan, China. His research interests include methods and algorisms of remote sensing image interpretation.
Qiang Li
Qiang Li is a senior engineer at Shenyang Surveying and Mapping Institute Co., Ltd.
Min Peng
Min Peng is an engineer in Shenyang Surveying and Mapping Institute Co., Ltd.
Notes
References
- Chen, F., J. Chen, H. Wu, D.Y. Hou, W.W. Zhang, X.G. Zhou, and L.J. Chen. 2016a. “A Landscape Shape Index-Based Sampling Approach for Land Cover Accuracy Assessment.” Science China Earth Sciences 59 (12): 2263–2274. doi:10.1007/s11430-015-5280-5.
- Chen, Y.S., H.L. Jiang, C.Y. Li, X.P. Jia, and P. Ghamisi. 2016b. “Deep Feature Extraction and Classification of Hyperspectral Images Based on Convolutional Neural Networks.” IEEE Transactions on Geoscience and Remote Sensing 54 (10): 6232–6251. doi:10.1109/TGRS.2016.2584107.
- Ding, L., J. Zhang, and L. Bruzzone. 2020. “Semantic Segmentation of Large-Size VHR Remote Sensing Images Using a Two-Stage Multiscale Training Architecture.” IEEE Transactions on Geoscience and Remote Sensing 58 (8): 5367–5376. doi:10.1109/TGRS.2020.2964675.
- Ghamisi, P., N. Yokoya, J. Li, W.Z. Liao, S.C. Liu, J. Plaza, B. Rasti, and A. Plaza. 2017. “Advances in Hyperspectral Image and Signal Processing: A Comprehensive Overview of the State of the Art.” IEEE Geoscience and Remote Sensing Magazine 5 (4): 37–78. doi:10.1109/MGRS.2017.2762087.
- Gong, J.Y. 2018. “Chances and Challenges for Development of Surveying and Remote Sensing in the Age of Artificial Intelligence.” Geomatics and Information Science of Wuhan University 43 (12): 1788–1796. doi: 10.13203/j.whugis20180082.
- Gong, J.Y., Y. Xu, X.Y. HU, L.C. Jiang, and M. Zhang. 2021. “Status Analysis and Research of Sample Database for Intelligent Interpretation of Remote Sensing Image.” Acta Geodaetica et Cartographica Sinica 50 (8): 1013. doi: 10.11947/j.AGCS.2021.20210085.
- Goodfellow, I., Y. Bengio, and A. Courville. 2016. Deep Learning. Cambridge, MA: MIT press.
- Grekousis, G., G. Mountrakis, and M. Kavouras. 2015. “An Overview of 21 Global and 43 Regional Land-Cover Mapping Products.” International Journal of Remote Sensing 36 (21): 5309–5335. doi:10.1080/01431161.2015.1093195.
- Hamida, A.B., A. Benoit, P. Lambert, and C. Ben-Amar. 2016. “Deep Learning Approach for Remote Sensing Image Analysis.” In Big Data from Space (Bids’16), 133. Luxembourg: Publications Office of the European Union.
- He, M.Y., B. Li, and H.H. Chen. 2017. “Multi-Scale 3D Deep Convolutional Neural Network for Hyperspectral Image Classification.” Paper presented at 2017 IEEE International Conference on Image Processing (ICIP), Beijing, September 17-20 3904–3908. doi: 10.1109/ICIP.2017.8297014.
- Heipke, C., and F. Rottensteiner. 2020. “Deep Learning for Geometric and Semantic Tasks in Photogrammetry and Remote Sensing.” Geo-Spatial Information Science 23 (1): 10–19. doi:10.1080/10095020.2020.1718003.
- Hu, J., L. Shen, and G. Sun. 2018. “Squeeze-and-Excitation Networks.” Proceedings of the IEEE Conference on Computer Vision and Pattern Recognition, Salt Lake City, June 18-22. 7132–7141.
- Hu, X.Y., X.Y. Gong, and M. Zhang. 2018. “A Variational Approach for Automatic Man-Made Object Detection from Remote Sensing Images.” Acta Geodaetica et Cartographica Sinica 47 (6): 780. doi:10.11947/j.AGCS.2018.20170642.
- Khan, M.J., H.S. Khan, A. Yousaf, K. Khurshid, and A. Abbas. 2018. “Modern Trends in Hyperspectral Image Analysis: A Review.” IEEE Access 6: 14118–14129. doi:10.1109/ACCESS.2018.2812999.
- Khoshgoftaar, T.M., J. Hulse, and A. Napolitano. 2010. “Supervised Neural Network Modeling: An Empirical Investigation into Learning from Imbalanced Data with Labeling Errors.” IEEE Transactions on Neural Networks 21 (5): 813–830. doi:10.1109/TNN.2010.2042730.
- Li, S.T., W.W. Song, L.Y. Fang, Y.S. Chen, P. Ghamisi, and J.A. Benediktsson. 2019. “Deep Learning for Hyperspectral Image Classification: An Overview.” IEEE Transactions on Geoscience and Remote Sensing 57 (9): 6690–6709. doi:10.1109/TGRS.2019.2907932.
- Luo, Y.N., J. Zou, C.F. Yao, X.S. Zhao, T. Li, and G. Bai. 2018. “HSI-CNN: A Novel Convolution Neural Network for Hyperspectral Image.” Paper presented at 2018 International Conference on Audio, Language and Image Processing (ICALIP), Shanghai, July 16 464–469. doi:10.1109/ICALIP.2018.8455251.
- Ma, L., Y. Liu, X.L. Zhang, Y.X. Ye, G.F. Yin, and B.A. Johnson. 2019. “Deep Learning in Remote Sensing Applications: A Meta-Analysis and Review.” ISPRS Journal of Photogrammetry and Remote Sensing 152: 166–177. doi:10.1016/j.isprsjprs.2019.04.015.
- Ministry of Natural Resources of People’s Republic of China. 2021. “Content and Index of Fundamental Geographic Conditions Monitoring (CH/T 9029-2021).”
- Peng, C., X.Y. Zhang, G. Yu, G.M. Luo, and J. Sun. 2017. “Large Kernel Matters–Improve Semantic Segmentation by Global Convolutional Network.” Proceedings of the IEEE Conference on Computer Vision and Pattern Recognition, Honolulu, July 21-26. 1743-1751. doi: 10.1109/CVPR.2017.189.
- Rangnekar, A., N. Mokashi, E.J. Ientilucci, C. Kanan, and M.J. Hoffman. 2020. “Aerorit: A New Scene for Hyperspectral Image Analysis.” IEEE Transactions on Geoscience and Remote Sensing 58 (11): 8116–8124. doi:10.1109/TGRS.2020.2987199.
- Rawat, W., and Z.H. Wang. 2017. “Deep Convolutional Neural Networks for Image Classification: A Comprehensive Review.” Neural Computation 29 (9): 2352–2449. doi:10.1162/neco_a_00990.
- Roy, S.K., S. Manna, T.C. Song, and L. Bruzzone. 2020. “Attention-Based Adaptive Spectral-Spatial Kernel Resnet for Hyperspectral Image Classification.” IEEE Transactions on Geoscience and Remote Sensing 59 (9): 7831–7843. doi:10.1109/TGRS.2020.3043267.
- Scheirer, W.J., A.R. Rocha, A. Sapkota, and T.E. Boult. 2012. “Toward Open Set Recognition.” IEEE Transactions on Pattern Analysis and Machine Intelligence 35 (7): 1757–1772. doi:10.1109/TPAMI.2012.256.
- State Administration for Market Regulations and National Standardization Administration of China. 2020. “Specifications for Quality Inspection and Acceptance of Geographic Conditions Monitoring Achievements (GB/T 39613-2020).”
- Szymanski, P., and T. Kajdanowicz. 2019. “Scikit-Multilearn: A Scikit-Based Python Environment for Performing Multi-Label Classification.” The Journal of Machine Learning Research 20 (1): 209–230.
- Szymański, P., and T. Kajdanowicz. 2017. “A Network Perspective on Stratification of Multi-Label Data.” Proceedings of Machine Learning Research 74: 22–35. doi:10.48550/arXiv.1704.08756.
- University of Houston. 2018. “2018 IEEE GRSS Data Fusion Challenge – Fusion of Multispectral LiDAR and Hyperspectral Data.” https://hyperspectral.ee.uh.edu/?page_id=1075.
- Wang, J.D., K. Sun, T.H. Cheng, B.R. Jiang, C.R. Deng, Y. Zhao, D. Liu, Y.D. Mu, M.K. Tan, and X.G. Wang. 2020. “Deep High-Resolution Representation Learning for Visual Recognition.” IEEE Transactions on Pattern Analysis and Machine Intelligence 43 (10): 3349–3364. doi:10.1109/TPAMI.2020.2983686.
- Xu, Y., X.Y. Hu, Y.J. Wei, Y. Yang, and D.H. Wang. 2019. “A Machine Learning Dataset for Large-Scope High Resolution Remote Sensing Image Interpretation considering Landscape Spatial Heterogeneity.” International Archives of the Photogrammetry, Remote Sensing and Spatial Information Sciences XLII-2/W13: 731–736. doi:10.5194/isprs-archives-XLII-2-W13-731-2019.
- Zhang, L.P., and B. Du. 2012. “Recent Advances in Hyperspectral Image Processing.” Geo-Spatial Information Science 15 (3): 143–156. doi:10.1080/10095020.2012.719684.
- Zhang, L.P., L.F. Zhang, and B. Du. 2016. “Deep Learning for Remote Sensing Data: A Technical Tutorial on the State of the Art.” IEEE Geoscience and Remote Sensing Magazine 4 (2): 22–40. doi:10.1109/MGRS.2016.2540798.
- Zhang, L.P., and F.L. Luo. 2020. “Review on Graph Learning for Dimensionality Reduction of Hyperspectral Image.” Geo-Spatial Information Science 23 (1): 98–106. doi:10.1080/10095020.2020.1720529.
- Zheng, Z., Y.F. Zhong, A.L. Ma, and L.P. Zhang. 2020. “FPGA: Fast Patch-Free Global Learning Framework for Fully End-to-End Hyperspectral Image Classification.” IEEE Transactions on Geoscience and Remote Sensing 58 (8): 5612–5626. doi:10.1109/TGRS.2020.2967821.
- Zhong, Y.F., X.Y. Wang, Y. Xu, S.Y. Wang, T.Y. Jia, X. Hu, J. Zhao, L.F. Wei, and L.P. Zhang. 2018. “Mini-UAV-Borne Hyperspectral Remote Sensing: From Observation and Processing to Applications.” IEEE Geoscience and Remote Sensing Magazine 6 (4): 46–62. doi:10.1109/MGRS.2018.2867592.
- Zhong, Y.F., X. Hu, C. Luo, X.Y. Wang, J. Zhao, and L.P. Zhang. 2020. “WHU-Hi: UAV-Borne Hyperspdectral with High Spatial Resolution (H2) Benchmark Datasets and Classifier for Precise Crop Identification Based on Deep Convolutional Neural Network with CRF.” Remote Sensing of Environment 250: 112012. doi:10.1016/j.rse.2020.112012.
- Zhong, Y.F., X.Y. Wang, S.Y. Wang, and L.P. Zhang. 2021. “Advances in Spaceborne Hyperspectral Remote Sensing in China.” Geo-Spatial Information Science 24 (1): 95–120. doi:10.1080/10095020.2020.1860653.
- Zou, L., X.L. Zhu, C.F. Wu, Y. Liu, and L. Qu. 2020. “Spectral–Spatial Exploration for Hyperspectral Image Classification via the Fusion of Fully Convolutional Networks.” IEEE Journal of Selected Topics in Applied Earth Observations and Remote Sensing 13: 659–674. doi:10.1109/JSTARS.2020.2968179.