
 ?Mathematical formulae have been encoded as MathML and are displayed in this HTML version using MathJax in order to improve their display. Uncheck the box to turn MathJax off. This feature requires Javascript. Click on a formula to zoom.
ABSTRACT
As an ambient atmospheric pollutant, fine particulate matter (PM2.5) has posed significant adverse impacts on public health around the world. To attenuate the population exposure risk to PM2.5 pollution, greenspace has been considered as a promising approach. Little is known, however, about the attenuating impacts of greenspace landscapes on PM2.5 exposure risks at various locations, scales, and exposure levels. This study employed hotspot analysis, weighted barycenter, and time-series clustering to investigate the spatiotemporal dynamics of PM2.5 exposure across Wuhan. In addition, the multi-scale geographically weighted regression (MGWR) was used to determine the relationships between greenspace landscape patterns and yearly PM2.5 exposure over four years (2000, 2005, 2010, and 2015). Results revealed that, between 2000 and 2016, the variations in PM2.5 exposure hotspot coverages within Wuhan showed an inverse U-shape trend. The K-DTW clustering differentiated the study area into seven spatial clusters with homogeneous temporal dynamics. In general, there were three stages of fluctuations in PM2.5 exposure in Wuhan: 2000–2005, 2006–2011, and 2012–2016. MGWR also disclosed associations between PM2.5 exposure and greenspace landscape parameters (AI, ED, SI, and PLAND). PLAND of green spaces can mitigate PM2.5 exposure at a broader scale (the average bandwidth was 1391), while AI, ED, and SI are generally associated with PM2.5 exposure reduction on local scales. In Wuhan, we also confirmed such relationships between four landscape metrics with varying levels of exposure risks. The results indicate that the attenuation effectiveness toward PM2.5 exposure risk by greenspace landscapes is not only site- and scale-dependent but also affected by exposure risk levels. The findings of this study can contribute to greenspace planning and management for mitigating PM2.5-attributable adverse health impacts.
1. Introduction
Ambient air pollution has been considered as the primary concern for public health all over the world. According to the World Health Organization (WHO), 91% of residents worldwide are exposed to levels of atmospheric pollutants exceeding the WHO air quality guidelines (de Sherbinin et al. Citation2014; World Health Organization Citation2004, Citation2016). Among all types of pollutants, PM2.5 (fine particulate matter with aerodynamic dimensions of 2.5 m or less) has posed the most serious threat to public health around the world, particularly in China (Kan, Chen, and Tong Citation2012; World Health Organization Citation2016; Zhang et al. Citation2019b). Human exposure to PM2.5 has been linked to a variety of negative health outcomes, including lung cancer (Guo et al. Citation2019a), cardiovascular and cerebrovascular diseases (Chuang et al. Citation2005; Kloog et al. Citation2011), missed abortion (Zhang et al. Citation2019a), and even premature death (Cohen et al. Citation2017; Liu et al. Citation2019a). Since China is the world’s most populous country, PM2.5 pollution has already posed a great concern to public health in China (particularly in highly populated areas). For instance, in 2010, nearly 942 million people in China were exposed to PM2.5 pollution exceeding the WHO Interim Target-1 (35 μ/m3) (Lim et al. Citation2012).
Attenuating the risks of PM2.5 exposure is crucial for all countries across the globe, especially for China. Fossil fuel-driven socioeconomic expansion in China has inevitably promoted ambient PM2.5 pollution (Chen et al. Citation2018; Fan et al. Citation2020a, Citation2020b; Yang et al. Citation2018a). To address the increasingly severe atmospheric pollution and related public health risks, the State Council of China enacted the Air Pollution Prevention and Control Action Plan (Action Plan) and the bulk of stringent air quality control measures in 2013, primarily aimed at restricting industrial emissions and coal fuel consumption (Chen et al. Citation2013; Geng et al. Citation2019; Yang and Zhao Citation2022; Zhang et al. Citation2019a). It has been investigated that such stringent measures in 2013–2017 could benefit improved air quality and associated public health developments. While the ultimate approach for PM2.5 pollution mitigation is argued to eliminate the source emissions, other proposals, such as nature-based solutions to attenuate PM2.5 exposures, are equally necessary for developing societies, particularly for China (Chen et al. Citation2016; Fan et al. Citation2017).
Optimizing greenspace landscape planning and management has been considered as one of the most advisable nature-based solutions to urban environmental issues, e.g. air pollution removal and urban heat island (UHI) mitigation (Chen et al. Citation2016, Citation2019; He and Zhu Citation2018; Li et al. Citation2022; Wu et al. Citation2018). As “natural filters”, greenspace are capable of purifying the air by filtering deposition, reducing re-suspension, and absorbing gaseous precursors of PM2.5 (Nowak et al. Citation2013). In addition, greenspace has the ability to alternate the microclimatic conditions, which can subsequently affect the deposition and dispersion of atmospheric particulate matter (Jeanjean et al. Citation2017; Wu et al. Citation2018). For the above reasons, greenspace has been proven effective in reducing PM2.5 pollution and hence improving public health around the world (Fan and Liu Citation2018; Jeanjean et al. Citation2017; Jin et al. Citation2014; Nowak et al. Citation2013).
In addition to quantifying the PM2.5 attenuation capacity of greenspace, it is also important to examine how such capacities of greenspace landscapes vary with locality, scale, and exposure level. The effectiveness of PM2.5 pollution mitigation by greenspace has been proven as site-, time-, and scale-dependent utilizing both in-site PM2.5 measurement and satellite-derived PM2.5 products, which are intermediated by meteorological forcing, socioeconomic activities, and surface elements (Chen et al. Citation2016; Escobedo and Nowak Citation2009; Wu et al. Citation2018). In Chinese cities, greenspaces with multiple compositions and configurations have been substantiated to be able to remove PM2.5 with varying effectiveness at various seasons, locations, and scales (Chen et al. Citation2016; Wu et al. Citation2018). On the one hand, whether the association between greenspace landscapes and PM2.5 exposure risks is correspondingly site-, exposure level-, and scale-dependent remains to be examined. The adoption of spatially sparse in-site PM2.5 monitoring, on the other hand, reduces the potency of massive contemporary studies examining PM2.5 exposure-greenspace correlations for supporting urban greenspace optimization (Jeanjean et al. Citation2017; Jin et al. Citation2014).
Fortunately, in this new era of earth-observation (EO), the overwhelming flood of EO-derived grid-based PM2.5 and population products allows us to investigate PM2.5 exposure-greenspace associations at spatially continuous perspectives and finer resolution (Guo et al. Citation2020a, Citation2020b; Huang and Wang Citation2020; Li et al. Citation2013; Ma et al. Citation2016; Wu et al. Citation2015a; Yang et al. Citation2020a). In this study, with a geographic focus on Wuhan, the megacity of Central China, a comprehensive investigation of the spatiotemporal dynamics of PM2.5 exposure patterns across Wuhan in 2000–2016 has been conducted using an annual ground-level PM2.5 dataset and gridded LandScan™ population. Furthermore, the associations between PM2.5 exposure and greenspace landscape patterns have been established in four critical years (2000, 2005, 2010, and 2015). Specifically, this study intended to answer the following questions:
How did the patterns of human exposure to PM2.5 vary across Wuhan in the period of 2000–2016?
Is the link between PM2.5 exposure and greenspace in Wuhan site-, exposure level-, and scale-dependent or not?
How did the greenspace landscapes in Wuhan affect the spatiotemporal patterns of PM2.5 exposure?
2. Study area and materials
2.1. The study area
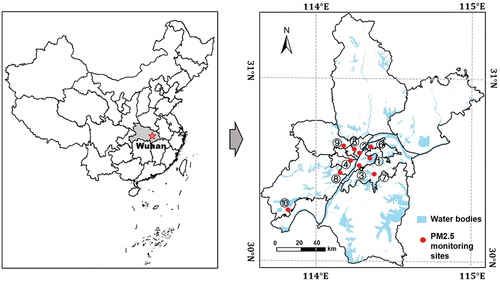
Wuhan, a megacity located in central China, has been selected as the study case. Located in the middle and lower reaches of the Yangtze River, Wuhan has a humid subtropical monsoon climate with abundant rainfall, sunshine, and four distinctive seasons. In the past decades, remarkable socioeconomic and landscape urbanization has been witnessed in Wuhan (Zhan, Yue, and Xiao Citation2018). By the end of 2019, more than 11 billion people permanently lived in Wuhan with a Gross Domestic Product (GDP) of 1.62 trillion China Yuan, according to the report by the Wuhan Municipal People’s Government (WMPG) (WMPG Citation2020). As the industrial and economic center of central China, Wuhan suffers from severe fine particle pollution along with its remarkable socioeconomic development (Guo et al. Citation2019b; Xu et al. Citation2017). There are currently 10 PM2.5 monitoring sites () operated by the China National Environmental Monitoring Center (CNMEC) across Wuhan. These 10 monitoring sites are listed in Table S.1.
Figure 1. The study area and the spatial distribution of the 10 air quality monitoring sites (①-⑩) within Wuhan.
2.2. PM2.5 concentration
The sparsely distributed ground-level monitoring stations cannot fully capture the spatial variability of PM2.5 concentrations, thus posing difficulty in the spatially explicit delineation of PM2.5 exposure risks (Lin et al. Citation2016; Song et al. Citation2019; van Donkelaar et al. Citation2016). Hence, an annual ground-level PM2.5 concentration dataset downloaded from the Socioeconomic Data and Application Center (SEDAC) was adopted in this study (van Donkelaar et al. Citation2016, Citation2018). Currently, users can access the gridded annual PM2.5 concentration from 1998 to 2016 at the resolution (approximately
in China). This study utilized a re-projected subset of the global dataset covering Wuhan at
resolution in 2000–2016. The validation accuracy of satellite-derived PM2.5 concentration data can be checked in the Supplementary Materials (Figure S.1).
2.3. Population distribution
The Oak Ridge National Laboratory (ORNL) LandScan™ population distribution product has been used as the demographic input in the PM2.5 population exposure estimation. The population distribution is globally provided at approximately resolution in the LandScan™ product. In this study, we used a subset that covered Wuhan from 2000 to 2016. It is noteworthy that the study period is 2000–2016, which is collectively determined by the availability of PM2.5 data (from 1998 to 2016) and population distribution (from 2000 to 2018).
2.4. Landcover
Thanks to the overwhelming stream of EO data, numerous LC products based on open-source EO data have been extensively produced nowadays. Among the numerous land cover/land use (LU/LC) products, the annual 30 m LC map of China produced by Yang and Huang (Citation2021) is one of the most robust and accurate annual land cover products in China (CLCD). Manually validated by 2000 samples derived from Google Earth, the overall accuracy of the urban greenspace mapping of this product is approximately 91.36%. It is noteworthy that greenspace are combined from multiple LC categories. These categories are forest, shrub, grassland, and wetland. The cropland, a typical artificial ecosystem, has not been recognized as greenspace in this study for its complex and interactive role in the emission and absorption of PM2.5 and related precursor pollutants (Lu et al. Citation2018; Wu et al. Citation2015b).g
3. Methodology
3.1. PM2.5 population exposure estimation
Population weighted PM2.5 concentration (PW_PM2.5) has been used to quantify PM2.5 population exposure risks across Wuhan at resolution. In each
grid, the higher population-weighted PM2.5 concentration indicates that residents are faced with higher PM2.5 exposure risks and vice versa (Lin et al. Citation2016; Song et al. Citation2019). The population-weighted PM2.5 concentration can be calculated as:
where is a grid in the study area,
is the amount of the grid in the study area.
and
are population and PM2.5 concentration in the
grid. The calculation of population-weighted PM2.5 concentration has been conducted on MATLAB 2018b software platform.
3.2. PM2.5 exposure weighted barycenter
To better delineate the evolution of PM2.5 exposure spatial patterns, the PM2.5 exposure weighted barycenter has been introduced in this study. Considering population-weighted PM2.5 concentrations, the PM2.5 exposure weighted barycenter is capable of revealing the spatiotemporal dynamics of PM2.5 exposure patterns (Yang et al. Citation2019a). The coordinates of PM2.5 exposure weighted barycenter are calculated as follows:
where and
share the same definitions as EquationEquation (1)
(1)
(1) , and (
,
) is the coordinate of
grid, and (
,
) is the coordinate of PM2.5 exposure weighted barycenter.
3.3. Hotspot identification
The statistically significant PM2.5 exposure hotspots from 2000 to 2016 were identified using Getis-Ord Gi* in this study. To identify a specific geographical element as a hotspot, Getis-Ord Gi* requires that such an element not only demonstrates high value itself but also to be surrounded by agglomerated high-value elements (Ord and Getis Citation1995). The z-value in Getis-Ord Gi* is a measure of spatial agglomeration. The statistical significance of a hotspot is determined by its z-value. A z-value close to or equal to zero suggests that certain elements have no spatial agglomeration. The calculation of Getis-Ord Gi* can be checked in the references (Ord and Getis Citation1995). Getis-Ord Gi* is implemented in the spatial econometric software GeoDa version 1.14.0.
3.4. Time-series clustering
Although various research have attempted to investigate the temporal dynamics of PM2.5 at scales ranging from global to regional, the spatial variations of PM2.5 patterns have rarely been fully disclosed (Hu et al. Citation2013; Peng et al. Citation2016). Time-series clustering could be a viable approach to capture the temporal dynamics of PM2.5 and locate the specific regions with homogeneous time-varying patterns across Wuhan from 2000 to 2016 (Hu et al. Citation2013; Liu et al. Citation2018; Peng et al. Citation2016). In this study, K-Means clustering coupling DTW (K-DTW) has been utilized to capture and spatialize the temporal dynamics of PM2.5 exposure in Wuhan. K-Means has been acknowledged as the most efficient and robust tool for exploring the temporal dynamics of environmental challenges as a raw data-based time-series clustering method (Aghabozorgi, Shirkhorshidi, and Wah Citation2015; Liu et al. Citation2019b; Warren Liao Citation2005). However, Euclidean distance in K-Means clustering performs poorly when processing time-series with small sample size and inconsistent phase (Aghabozorgi, Shirkhorshidi, and Wah Citation2015; Warren Liao Citation2005). As the extension of Euclidean distance, Dynamic Time Warping (DTW) has been proposed as an extension of Euclidean distance to uncover temporal commonalities concealed behind phase variation using a dynamic planning technique (Aghabozorgi, Shirkhorshidi, and Wah Citation2015; Liu et al. Citation2018; Warren Liao Citation2005). The mathematical calculation of K-Means is well documented (Aghabozorgi, Shirkhorshidi, and Wah Citation2015; Liu et al. Citation2019b, Citation2018; Warren Liao Citation2005), so it will not be repeated here. The definition of DTW is as:
where and
are two specific time-series,
is the local temporal distance,
is the weighted function of DTW. In this study, the K-DTW time-series clustering algorithm has been implemented on MATLAB 2018b software platform.
3.5. Landscape metrics
Landscape metrics have been recognized as feasible and effective in quantifying LU/LC landscape patterns, i.e. composition and configuration (McGarigal Citation1995). In this study, 10 metrics reflecting the aggregation, density, edge, shape, and coverage of greenspace landscape patterns have been selected. The detailed information about these landscape metrics is reported in Table S.2. All the selected landscape metrics are calculated at resolution using Fragstats 4.2 software.
3.6. Multi-scale geographically weighted regression
The multi-scale geographically weighted regression (MGWR) was used to model the relationships between greenspace landscapes and PM2.5 exposure. Before the creation of MGWR, the geographically weighted regression (GWR) has been widely used in modeling various geographical issues, e.g. house prices, air quality, and land surface temperature (Chen et al. Citation2018; Fotheringham, Brunsdon, and Charlton Citation2003; Liu et al. Citation2019c). In GWR, all geographical processes are assumed to operate at the same scale (i.e. the same bandwidth). Such an assumption in GWR has now been argued to be probably inappropriate under certain scenarios. There is no single “correct” scale where it can model and simulate all the unique geographic and environmental problems (McMaster and Sheppard Citation2004). By relaxing the assumption that processes operate at one spatial scale, MGWR has been verified as a more powerful model than GWR (Fotheringham, Yang, and Kang Citation2017; Fotheringham, Yue, and Li Citation2019). In this study, MGWR was used to examine the multi-scale and spatial non-stationary associations between PM2.5 exposure and greenspace landscape patterns across Wuhan. MGWR can be mathematically represented as:
where is the coordinate of the location,
,
and
are dependent and independent variables, and
is the residual. Furthermore,
is the bandwidth of intercept,
is the bandwidth of
th independent variable. In this study, we selected the bi-square kernel function in MGWR.
where is the spatial weight of the specific observation at location
with neighboring observation located at
for
th independent variable,
is the distance between
and
. In this study, the MGWR model was implemented on the MGWR Version 2.0.1 software.
4. Results and discussion
4.1. Spatiotemporal patterns of PM2.5 exposure across Wuhan from 2000 to 2016
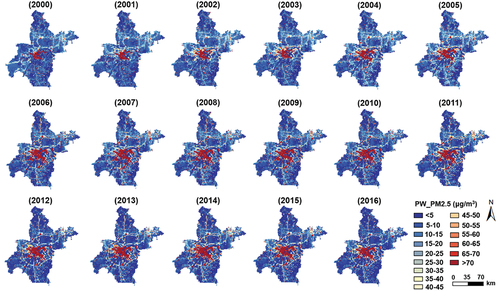
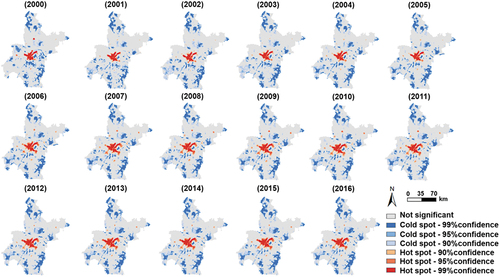
As shown in , from 2000 to 2016, the areas where residents have been exposed to severe PM2.5 pollution (more than twice the WHO guidelines (35 μg/m3)) have been expanding. People who suffered from such long-term PM2.5 exposure would face an additional risk of premature death up to 15% (Cohen et al. Citation2017; World Health Organization Citation2004, Citation2016). Previous studies have revealed that from 2010 to 2014, the substantial increase in PM2.5 exposure risks was linked to pollutant emissions and built-up area expansion during the period (Xu et al. Citation2016; Zhang et al. Citation2018).
Figure 2. Spatial patterns of annual PM2.5 exposure (PW_PM2.5) across Wuhan from 2000 to 2016.
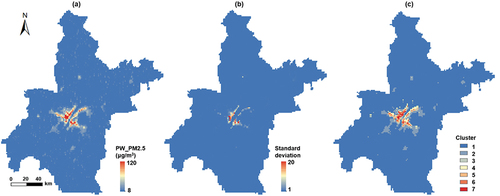
K-Means coupling DTW (K-DTW) was used to spatially differentiate the study area into clusters with homogeneous temporal dynamics of PM2.5 exposure from 2000 to 2006. The most appropriate category number of PM2.5 exposure time-series of K-DTW clustering was determined using the explained variance (Figure S.2). Seven clusters (explained variance = 0.9019) have been proposed as the ideal number of K-DTW clusters based on the explained variance. shows the K-DTW time-series clustering results (c).
Figure 3. The time-series clustering results by K-DTW was shown in . Spatial distribution of (a) inter-annual average, (b) standard deviation, and (c) time-series clustering result of PM2.5 exposure patterns in Wuhan in 2000–2016.
shows the temporal variations of PM2.5 exposure patterns of seven time-series clusters, which show exceptional diversity and strong non-linearity (p0.001). The first time-series cluster, which mostly consisted of natural landscapes, showed an inverted U-shape trend that peaked in period of 2006–2008. In the second cluster, PM2.5 exposure risks reached an all-time high in 2007 and 2014 and stayed in a moderate high level from 2008 to 2016. Such temporal variation is in line with the renewal and development of urban landscapes in the corresponding regions (Zhan, Yue, and Xiao Citation2018). Specifically, significant built-up land expansions in Wujiashan, Zhuankou, and the Donghu Gaoxin sub-district covered by the second cluster were witnessed in 2005–2010 (Xu et al. Citation2016). Clusters 3, 6, and 7 demonstrated similar PM2.5 exposure risk temporal dynamics, which may be divided into three stages: 2000–2005, 2006–2011, and 2012–2016. Since 2006, such clusters primarily covered downtown areas that had not experienced substantial landscape renewal. Exogenous PM2.5 transmission (Xu et al. Citation2017) and population rearrangement (average LandScan population in Cluster 3, 6, and 7 from 2012 to 2014 were 2,232,562, 2,478,049, and 2,853,522) within corresponding regions (Han et al. Citation2018). Clusters 4 and 5 experienced significant high-level of PM2.5 exposure in period of 2004–2006 (41.97 μg/m3 of cluster 4 and 60.89 μg/m3 of cluster 5 on average), which is consistent with built-up land expansion and intensification in the corresponding regions (Zhan, Yue, and Xiao Citation2018).
presents the detailed information of primary surface attributes covered by the seven time-series clusters. shows that the time-series clusters of PM2.5 exposure patterns across Wuhan, as sorted according to the average population-weighted PM2.5 concentration. The general temporal variations of PM2.5 exposure over the land surface property were covered by each time-series cluster. The stages of landscape urbanization were not revealed in the corresponding time-series clusters, contrary to our earlier studies on land surface temperature (LST) in Wuhan (Liu et al. Citation2019b). Such inconsistency can be attributed to the speculation that, ambient air pollution, compared with LST, is a product of more fickle and complex surface-society-atmosphere interactions. Although surface element changes have been identified as one of the external forcings of PM2.5 pollution, urban landscape transformations alone are insufficient to explain the spatiotemporal dynamics of PM2.5 pollution patterns (Chen et al. Citation2016; Yang et al. Citation2018b).
Figure 4. The average temporal variations of PM2.5 exposure risks in seven clusters and averaged across Wuhan from 2000 to 2016.
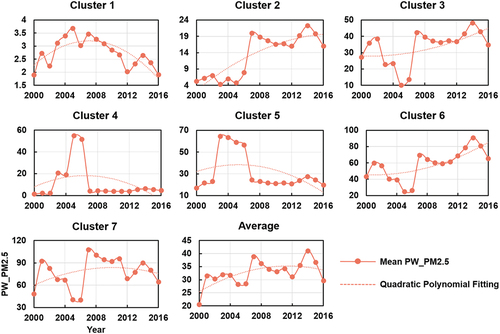
Table 1. The primary surface properties of seven time-series clusters.
The weighted barycenters () and hotspots () of PM2.5 exposure were also used to present a better understanding of the spatial evolution of PM2.5 exposures in Wuhan. Generalized from time-series clustering, PM2.5 exposure weighted barycenters, and PM2.5 exposure hotspots, the spatiotemporal evolution of PM2.5 exposure patterns in Wuhan can be distinguished into three periods.
Figure 5. Spatial distribution of PM2.5 exposure weighted barycenter in Wuhan from 2000 to 2016.
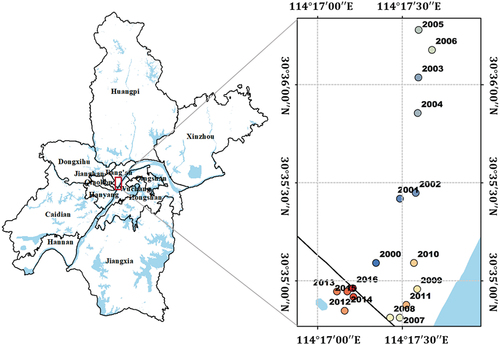
Figure 6. Spatial distributions of PM2.5 exposure hotspots in Wuhan from 2000 to 2016.
Average PM2.5 exposure risks in Wuhan increased (from 20.62 μg/m3 to 31.71 μg/m3) during the first period (2000–2005). PM2.5 exposure hotspots in Wuhan were mostly clustered in the downtown areas (Hanyang, Jianghan, Jiang’an, and Wuchang District). Specifically, over this time period, the PM2.5 exposure weighted barycenters shifted annually about 730.86 m north by east (Table S.3), indicating that residents in northern Wuhan were exposed to rising levels of exposure risks.
The second time period was from 2006 to 2011. PM2.5 exposure risks increased significantly from 2006 to 2007 (28.31 μg/m3 to 38.87 μg/m3), then dropped by 4.65 μg/m3 from 2007 to 2011, particularly in time-series clusters 3, 6, and 7. From a spatial perspective, the urban outskirts (e.g. the Donghu Gaoxin zone in the Hongshan District in ) and downtown suburban districts have seen a great expansion of PM2.5 exposure hotspots (including Caidian, Huangpi, Xinzhou, and Jiangxia Districts). During the second stage, it is evident that the weighted barycenters have shifted back to the south (particularly in 2006–2007).
The third time period is from 2012 to 2016. The spatial patterns of PM2.5 exposure stayed almost unchanged in the third period, with slight shrinkage since 2014. PM2.5 exposure barycenters revealed a significant but ruleless aggregating pattern (), which aligned with the evolution of spatial patterns of hotspots (Table S.4).
Furthermore, PM2.5 coldspots (confidence undefined
) in Wuhan are primarily found over mountainous forests and large-scale waterbodies, such as the Yangzte River, Tangxun Lake, Liangzi Lake, and Mulan Mountain. PM2.5 exposure coldspots in Wuhan increased from 2475 km2 to 2800 km2 between 2000 and 2016. From 2000 to 2016, the expansion of coldspots suggested that environmental improvement strategies were effective in reducing PM2.5 exposure in part of areas in Wuhan. PM2.5 exposure coldspots expanded around the Wuhu lake at the junction of the Huangpi District and the Xinzhou District, as illustrated in . Regions around Wuhu Lake are the origins and will be the future core area of the Yangtze River New City, according to Wuhan Urban Master Planning (2017–2035). In addition, the Wuhan Comprehensive Ecological Framework has designated Wuhu Lake and its surroundings as the Green Wedge (http://www.wpdi.cn/project-1-ix00A0;11,309htm). The WMPG is carrying out industrial transformation and ecological environment restoration around Wuhu Lake as a demonstration for Wuhan to promote ecological economic development. The explorations of ecological economic growth around Wuhu Lake have paid off, according to the aforementioned findings.
4.2. Associations between PM2.5 exposure and green spaces landscapes
MGWR was used in this research to examine the associations between PM2.5 exposure and green space landscapes throughout four years (i.e. 2000, 2005, 2010, and 2015). On the one hand, collecting greenspace maps every year from 2000 to 2016 is arduous and unnecessary. The calibration and validation of MGWR, on the other hand, is time-consuming. As a result, the associations established on four representative years in three stages were believed to be sufficient to explore PM2.5 exposure attenuation by green spaces across years, sites, and pollution levels.
Following the guidelines in our previous study, Random Forest (RF) regression was adopted to select the optimal green space landscape metrics from nominated metrics (including PLAND, ED, TE, TCA, PD, SI, PARA, CONTIG, AI, and SHDI) in four years (Yang et al. Citation2019b). The optimal metrics were successively determined in this study when the increased mean square error (%IncMSE) almost remained unchanged and the out-of-bag (OOB) error no longer decreased. The variable screening comes to an end in the sixth iteration, as shown in Table S5, and PLAND, ED, LSI, and AI were chosen as the best landscape metric combination. Multicollinearity and cross-correlation were removed with the combination of PLAND (VIF = 1.73), ED (VIF = 1.42), SI (VIF = 1.15), and AI (VIF = 1.68), as measured by the variation inflation factor (VIF). It is noteworthy that the optimal variable sets in this study were collectively affected by the study region, period, and scale of metrics. Thus, the optimal landscape metrics in other sites and times may not keep the same.
In each year, the association between PM2.5 exposure and green space landscape metrics was established as follows:
Ordinary Least Square (OLS) regression and GWR were also implemented for comparison, and the regression performance was summarized in Table S.6. The performance of regressions was evaluated by R-square (R2), Akaike Information Criterion correction (AICc), and Sum of Squared Residuals (SSR) (Fotheringham, Yang, and Kang Citation2017; Liu et al. Citation2019c). MGWR’s superior performance to GWR and OLS (Table S.6,) revealed that MGWR’s multi-scale assumption facilitated the examination of associations between green spaces and PM2.5 exposure.
In general, the decrease in AICc and SSR from OLS to GWR and MGWR indicated that model fitting had improved. From 2000 to 2015, R2 increased in OLS (0.41 to 0.48), GWR (0.66 to 0.79), and MGWR (0.75 to 0.87) correspondingly, demonstrating that PM2.5 exposure attenuation was better explained by greenspace landscapes. According to Section 4.3, the year of 2005 witnessed the highest level of population exposure to PM2.5 pollution in Wuhan among all four years. In 2005, however, the associations between PM2.5 exposure and greenspace landscapes were weaker than the other three years. That is to say, greenspace landscapes were found to be less effective in decreasing risks of PM2.5 exposure when such risks were themselves relatively higher. Furthermore, in Wuhan, population exposure and its spatiotemporal dynamics were not entirely explained by greenspace landscape improvements (R2 = 0.78 on average), showing that greenspace landscape improvements can be a feasible but not exclusive solution for PM2.5 exposure reduction.
shows that the multi-scale effects in the associations between PM2.5 exposure risks and greenspace landscapes were underlined by the considerable difference between the optimal bandwidths discovered by GWR and MGWR. Almost all landscape metrics (except PLAND) operated at a local scale, according to GWR and MGWR’s results, implying the significance of spatial heterogeneity in associations between PM2.5 exposure and greenspace landscape metrics. GWR and MGWR’s optimal bandwidths in 2005 were narrower than in 2000, 2010, and 2015. Such results revealed that exposure attenuation by greenspace landscapes operated at narrower scales under higher exposure risks. In general, the operational scale of PLAND remained the broadest, followed by AI, ED, and SI.
Table 2. Optimal bandwidths of GWR and MGWR from 2000 to 2015.
The spatial heterogeneity of the association between PM2.5 exposure and greenspace landscapes found above was further highlighted in the spatial distribution of local R2 of MGWR (). Over the junction of Wuchang and Hongshan Districts, as well as the central areas of Huangpi, Jiangxia, and Hanan Districts, strong associations between PM2.5 exposure and green spaces were demonstrated in 2000. In 2005, the association between PM2.5 exposure and green areas was very weak across Wuhan, with the exception of Jiangxia District’s downtown. Furthermore, the spatial patterns of local R2 in 2010 and 2015 were very similar. In regions around Wuhan Iron and Steel Cooperation in Qingshan District, Changfeng sub-district in Qiaokou District, and sub-centers of Huangpi, Xinzhou, and Jiangxia District, green spaces had a greater impact on PM2.5 exposure. The regression coefficients of landscape metrics in 2000–2015 were visually represented in .
Figure 7. Spatial distribution of local determination coefficient (Local R2) modeled by MGWR in the four years.
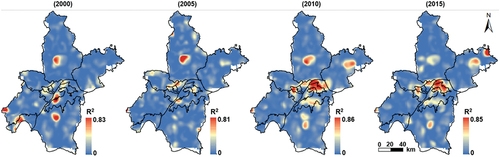
Figure 8. Regression coefficients of Aggregation Index (AI) from 2000 to 2015.
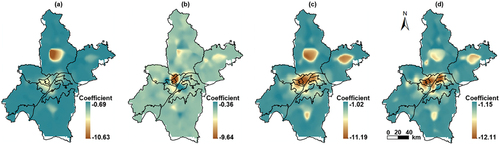
Figure 9. Regression coefficients of Edge Density (ED) from 2000 to 2015.
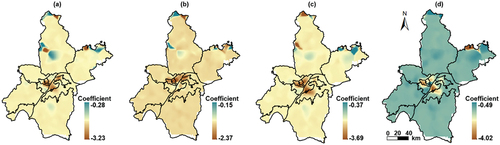
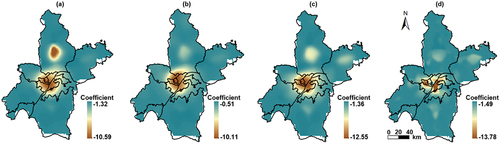
Figure 10. Regression coefficients of Shape Index (SI) from 2000 to 2015.
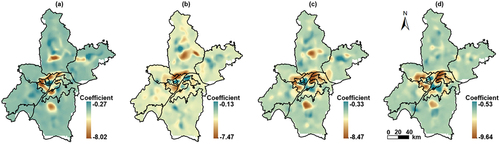
Figure 11. Regression coefficients of percentage cover of green spaces landscapes (PLAND) from 2000 to 2015.
From 2000 (7.32) to 2005 (6.18), the absolute value of the average AI coefficient declined by 1.14, subsequently increasing to 8.41 and 8.70 in 2010 and 2015. PM2.5 attenuation by agglomerated greenspace weakened in 2000–2005, then strengthened in 2010–2015, according to such variations in the absolute value of the average coefficient. Furthermore, between 2000 and 2015, the standard deviation of the regression coefficient increased (from 0.77 to 1.21), showing that spatial heterogeneity in PM2.5-greenspace associations was more significant in 2010 and 2015 than in 2000 and 2005. Within downtown Wuhan, AI had impacts on PM2.5 exposure in increasingly wider regions from 2000 to 2015. Furthermore, AI of green space landscapes generally had significant impacts on PM2.5 exposure around downtowns of suburban districts (e.g. Huangpi, Xinzhou, and Jiangxia District).
The lower absolute value of the average regression coefficient indicates that ED had weaker effective impacts on PM2.5 exposure in comparison to AI. In terms of geographic patterns, the spatial patterns of ED coefficients remained relatively stable from 2000 to 2015, as evidenced by standard deviations of ED coefficients (0.61 of 2000, 0.59 of 2005, 0.60 of 2010, and 0.58 of 2015). Greenspace ED and PM2.5 exposure were shown to be more closely associated in the Zhongnan region of Wuchang, the Honggangcheng region of Qingshan, and the Jianghan, Jiang’an, and Qiakou Districts.
The spatial patterns of regression coefficient of SI demonstrated significant spatial heterogeneity across Wuhan (standard deviation ≥0.96), and the average regression coefficients of SI represented similar variations to those of AI, i.e. weakened from 2000 to 2005 and strengthened in 2010–2015. The average coefficient of SI increased from −6.32 to −5.71 in 2000–2005 and subsequently decreased by 1.59 in 2010–2015. High SI regression coefficients, unlike AI and ED, were not concentrated near PM2.5 exposure hotspots in downtown Wuhan. On the contrary, the strong associations between SI and PM2.5 exposure risks were mainly witnessed in the peripheral regions of PM2.5 exposure hotspots, e.g. regions near the Jinyi Lake in Dongxihu District and the Yanxi Lake in Qingshan District.
The spatial patterns of the PLAND coefficient were quite smoothing in 2000–2015 (average standard deviation = 0.39), showing that PLAND’s PM2.5 mitigation effect functioned at broader spatial scales than AI, ED, and SI, as shown in . The PLAND coefficient was found to be higher in the downtown regions of Jianghan, Jiang’an, Qiaokou, Hanyang, and Wuchang District. Between 2000 and 2015, the absolute values of the mean regression coefficients for all four green space landscape metrics increased. Specifically, the absolute values of their average regression coefficients were the lowest in 2005, indicating that the mitigation ability of greenspace landscapes on PM2.5 exposure was suppressed when the risk of PM2.5 exposure was high.
4.3. Implications for greenspace landscape planning
Based on the multi-scale, temporal varying, and spatial non-stationary associations between PM2.5 exposure risks and greenspace landscapes investigated in Section 4.2, this study has several implications for greenspace development across Wuhan as follows:
The strong associations between PLAND of green spaces and PM2.5 exposure imply that the increase in greenspace landscape proportion can significantly attenuate PM2.5 exposure risks. Additionally, the larger bandwidths of PLAND indicate that the attenuation effectiveness of improving the percent cover of green spaces was relatively consistent across the study area. Overall, increasing the coverage of green spaces across Wuhan is the most direct and practical approach to proactive precautions for PM2.5 exposure.
It is highly recommended for urban planners to create ecological corridors to bridge distinct greenspace patches. This study revealed that there were strong spatial relationships between AI of greenspace and PM2.5 exposure risks around the key PM2.5 population exposure hotspots, according to the MGWR regression results (). As a result, greenspace patches that are spatially aggregated near primary PM2.5 exposure hotspots, such as urban functional centers and settlements, can help release people from severe PM2.5 exposure risks.
Greenspace landscapes with excessive edge density could only provide limited effect in attenuating PM2.5 exposure. The results of MGWR indicate that although the local attenuation effect of PM2.5 by ED of greenspace was witnessed to a certain extent around PM2.5 exposure hotspots, the attenuation effect by ED was not strong, and the scope of influence was quite limited. Thus, in greenspace planning and implementation, it is not recommended to attenuate exposure risks through improving the edge complexity of greenspace landscapes.
PM2.5 exposure risks can be reduced by increasing the diversity of greenspace configurations on the outskirts of exposure hotspots in downtown regions. Higher SI of greenspace can mitigate PM2.5 exposure risks in the periphery of PM2.5 exposure hotspots in downtown Wuhan at local scales, according to MGWR’s spatial patterns of SI regression coefficient, while improving the shape richness of green spaces within hotspots has limited benefit for PM2.5 exposure risk reduction.
Despite the significant spatial heterogeneity of mitigation effects by greenspace on PM2.5 exposure, the local authorities are still strongly recommended to plan and construct greenspace (e.g. gardens, Alee-trees, and other green infrastructure) as many sites as possible within central downtown. Although the economics and synergistic ecological effects (e.g. urban heat island mitigation (Ouyang et al. Citation2020; Yang et al. Citation2020b, Citation2017; Yu et al. Citation2017)) of this approach are unclear, it has been widely demonstrated to significantly reduce anthropogenic air pollution within cities (Nowak et al. Citation2013).
4.4. Limitations
There are several limitations in this study that can be further discussed. Firstly, the spatiotemporal dynamics of PM2.5 exposure in 2000–2016 have been investigated annually at resolution. However, in the context of heterogeneous urban landscapes, the
may not be the most ideal spatial resolution for the exploration of spatiotemporal dynamics and underlying driving mechanisms of PM2.5 exposure risks. Up to now,
PM2.5 estimations are still too coarse to perfectly depict the spatial patterns of PM2.5 exposure patterns and the underlying interactions with urban landscapes (Zhang et al. Citation2018). The resolution improvement of PM2.5 estimation can open the door for new insights into detailed PM2.5 spatial variations in heterogeneous urban landscapes (Hu et al. Citation2013; Zhang et al. Citation2018). Secondly, the annual interval prevented this study from capturing more detailed temporal variations of PM2.5 exposure risks, e.g. daily, monthly, and seasonal variations. The adverse impacts of PM2.5 pollution on human health are not only attributed to long-term exposure but also resulted from severe short-term PM2.5 exposure (Liu et al. Citation2019a). Thus, the implications for greenspace landscape improvement based on long-term PM2.5 exposure variations investigated in this study may not necessarily have the same attenuating effects on short-term PM2.5 exposure risks (Escobedo and Nowak Citation2009; Jeanjean, Monks, and Leigh Citation2016). Furthermore, the spatiotemporal dynamics and exposure attenuation by greenspace investigated in this study may not be applicable to other atmospheric pollutants. Nowadays, more atmospheric pollutant datasets (e.g. black carbon, PM10, NOx, SOx, and O3) are accessible, suggesting that more efforts can be made to study the health impacts of other pollutants in future studies.
5. Conclusions
Without a doubt, understanding the spatiotemporal dynamics of PM2.5 exposure risks and how attenuating effects of green spaces vary with places, times, scales, and exposure risk levels is crucial in combating increasingly intense and frequent atmospheric pollution in urban environments. In this study, MGWR was performed to examine the spatiotemporal dynamics of PM2.5 population exposure and underlying associations between green space landscape patterns in Wuhan, one of the megacities in central China troubled by PM2.5 pollution. The specific findings can be summarized as follows:
The expansion and intensification of hotspots were mostly observed across core downtown and suburban district downtowns when analyzing in combination with K-DTW clustering, exposure hotspots, and exposure weighted barycenter. The spatiotemporal variations of PM2.5 exposure across Wuhan may be divided into three periods based on the geographic evolution of exposure patterns and temporal dynamics: 2000–2005, 2006–2011, and 2012–2016. PM2.5 exposure-greenspace landscape associations were site-, exposure level-, and scale-dependent, according to the modeling results of MGWR. PLAND was associated with PM2.5 exposure risk at a broader spatial scale than AI, ED, and SI. In 2005, when the risk of PM2.5 exposure was at its peak, greenspace metrics have a suppressed mitigating effect on PM2.5 exposure. In addition, in this year, the impacts of all four landscape indices were performed on a relatively narrower spatial scale than the other three years.
This study contributes to the growing body of literature concerning atmospheric environment improvement through green spaces. It can facilitate the collaboration between urban air quality studies and urban green space landscape planning, designing, and management. Although the associations between PM2.5 exposure and green space landscapes were established in four representative years only, one should not devalue the significance of green spaces in attenuating long-term PM2.5 exposures. Future studies are called to examine the interactions between PM2.5 exposure and green spaces in cities under various meteorological and socioeconomic conditions. Additionally, future studies can further dedicate to exploring the most cost-effective and environmentally sound greenspace-based solutions to PM2.5 pollution, considering vegetation species combination and neighboring urban functional conditions.
Supplemental Material
Download MS Word (338.1 KB)Disclosure statement
No potential conflict of interest was reported by the author(s).
Data availability statement
The annual ground-level PM2.5 concentration dataset can be accessed from the Socioeconomic Data and Application Center (https://beta.sedac.ciesin.columbia.edu/data/set/sdei-global-annual-gwr-pm2-5-modis-misr-seawifs-aod). The LandscanTM population distribution data is provided by Oak Ridge National Laboratory (https://landscan.ornl.gov/). Annual land cover products in China (CLCD) are freely available at http://doi.org/10.5281/zenodo.4417810.
Supplementary material
Supplemental data for this article can be accessed online at https://doi.org/10.1080/10095020.2022.2085187.
Additional information
Funding
Notes on contributors
Qingming Zhan
Qingming Zhan is currently a professor with School of Urban Design, Wuhan University. Prof. Zhan received his Ph.D. degree in geo-information science from Wageningen University - ITC, the Netherlands, in 2003. His research interests include digital and smart cities, planning support systems, object-based analysis of remote sensing images, etc.
Chen Yang
Chen Yang is a Ph.D. candidate in College of Urban and Environmental Sciences, Peking University. He received his master’s degree from School of Urban Design, Wuhan University in 2020. His research interests include urban system sciences, remote sensing, climate change, and urban sustainability
Huimin Liu
Huimin Liu is an associate research fellow of School of Urban Design, Wuhan University. Her research interests include urban sustainability, environmental patterns and dynamics, health cities, climate change, and remote sensing.
References
- Aghabozorgi, S., A.S. Shirkhorshidi, and T.Y. Wah. 2015. “Time-Series Clustering – A Decade Review.” Information Systems 53: 16–38. doi:10.1016/j.is.2015.04.007.
- Chen, Z., J.N. Wang, G.X. Ma, and Y.S. Zhang. 2013. “China Tackles the Health Effects of Air Pollution.” Lancet 382 (9909): 1959–1960. doi:10.1016/S0140-6736(13)62064-4.
- Chen, J., L. Zhu, P. Fan, L. Tian, and R. Lafortezza. 2016. “Do Green Spaces Affect the Spatiotemporal Changes of PM2.5 in Nanjing?” Ecological Processes 5: 7. doi:10.1186/s13717-016-0052-6.
- Chen, J., C. Zhou, S. Wang, and J. Hu. 2018. “Identifying the Socioeconomic Determinants of Population Exposure to Particulate Matter (PM2.5) in China Using Geographically Weighted Regression Modeling.” Environmental Pollution 241: 494–503. doi:10.1016/j.envpol.2018.05.083.
- Chen, M., F. Dai, B. Yang, and S.W. Zhu. 2019. “Effects of Neighborhood Green Space on PM2.5 Mitigation: Evidence from Five Megacities in China.” Building and Environment 156: 33–45. doi:10.1016/j.buildenv.2019.03.007.
- Chuang, K.J., C.C. Chan, N.T. Chen, T.C. Su, and L.Y. Lin. 2005. “Effects of Particle Size Fractions on Reducing Heart Rate Variability in Cardiac and Hypertensive Patients.” Environmental Health Perspectives 113 (12): 1693–1697. doi:10.1289/ehp.8145.
- Cohen, A.J., M. Brauer, R. Burnett, H.R. Anderson, J. Frostad, K. Estep, K. Balakrishnan, et al. 2017. ”Estimates and 25-Year Trends of the Global Burden of Disease Attributable to Ambient Air Pollution: An Analysis of Data from the Global Burden of Diseases Study 2015.” Lancet 389 (10082): 1907–1918. DOI:10.1016/S0140-6736(17)30505-6.
- de Sherbinin, A., M.A. Levy, E. Zell, S. Weber, and M. Jaiteh. 2014. “Using Satellite Data to Develop Environmental Indicators.” Environmental Research Letters 9 (8): 084013. doi:10.1088/1748-9326/9/8/084013.
- Escobedo, F.J., and D.J. Nowak. 2009. “Spatial Heterogeneity and Air Pollution Removal by an Urban Forest.” Landscape and Urban Planning 90 (3–4): 102–110. doi:10.1016/j.landurbplan.2008.10.021.
- Fan, P., Z. Ouyang, C. Basnou, J. Pino, H. Park, and J. Chen. 2017. “Nature-Based Solutions for Urban Landscapes Under Post-Industrialization and Globalization: Barcelona versus Shanghai.” Environmental Research 156: 272–283. doi:10.1016/j.envres.2017.03.043.
- Fan, F., and R. Liu. 2018. “Exploration of Spatial and Temporal Characteristics of PM2.5 Concentration in Guangzhou, China Using Wavelet Analysis and Modified Land Use Regression Model.” Geo-Spatial Information Science 21 (4): 311–321. doi:10.1080/10095020.2018.1523341.
- Fan, Z., Q. Zhan, C. Yang, H. Liu, and M. Bilal. 2020a. “Estimating PM2.5 Concentrations Using Spatially Local Xgboost Based on Full-Covered SARA AOD at the Urban Scale.” Remote Sensing 12 (20): 423. doi:10.3390/rs12203368.
- Fan, Z., Q. Zhan, C. Yang, H. Liu, and M. Zhan. 2020b. “How Did Distribution Patterns of Particulate Matter Air Pollution (PM2.5 and PM10) Change in China During the COVID-19 Outbreak: A Spatiotemporal Investigation at Chinese City-Level.” International Journal of Environmental Research and Public Health 17 (17): 2334. doi:10.3390/ijerph17176274.
- Fotheringham, A.S., C. Brunsdon, and M. Charlton. 2003. Geographically Weighted Regression: The Analysis of Spatially Varying Relationships. Hoboken, NJ, USA: John Wiley & Sons.
- Fotheringham, A.S., W.B. Yang, and W. Kang. 2017. “Multiscale Geographically Weighted Regression (MGWR).” Annals of the American Association of Geographers 107 (6): 1247–1265. doi:10.1080/24694452.2017.1352480.
- Fotheringham, A.S., H. Yue, and Z.Q. Li. 2019. “Examining the Influences of Air Quality in China’s Cities Using Multi-Scale Geographically Weighted Regression.” Transactions in GIS 23 (6): 1444–1464. doi:10.1111/tgis.12580.
- Geng, G.N., Q.Y. Xiao, Y.X. Zheng, D. Tong, Y.X. Zhang, X.Y. Zhang, Q. Zhang, K.B. He, and Y. Liu. 2019. “Impact of China’s Air Pollution Prevention and Control Action Plan on PM2.5 Chemical Composition Over Eastern China.” Science China-Earth Sciences 62 (12): 1872–1884. doi:10.1007/s11430-018-9353-x.
- Guo, H., Z. Chang, J. Wu, and W. Li. 2019a. “Air Pollution and Lung Cancer Incidence in China: Who Are Faced with a Greater Effect?” Environmental International 132: 105077. doi:10.1016/j.envint.2019.105077.
- Guo, L., J. Luo, M. Yuan, Y. Huang, H. Shen, and T. Li. 2019b. “The Influence of Urban Planning Factors on PM2.5 Pollution Exposure and Implications: A Case Study in China Based on Remote Sensing, LBS, and GIS Data.” The Science of the Total Environment 659: 1585–1596. doi:10.1016/j.scitotenv.2018.12.448.
- Guo, H., W. Li, F. Yao, J. Wu, X. Zhou, Y. Yue, and A.G.O. Yeh. 2020a. “Who Are More Exposed to PM2.5 Pollution: A Mobile Phone Data Approach.” Environmental International 143: 105821. doi:10.1016/j.envint.2020.105821.
- Guo, H., Q. Zhan, H.C. Ho, F. Yao, X. Zhou, J. Wu, and W. Li. 2020b. “Coupling Mobile Phone Data with Machine Learning: How Misclassification Errors in Ambient PM2.5 Exposure Estimates Are Produced?” The Science of the Total Environment 745: 141034. doi:10.1016/j.scitotenv.2020.141034.
- Han, L., W. Zhou, W. Li, and Y. Qian. 2018. “Urbanization Strategy and Environmental Changes: An Insight with Relationship Between Population Change and Fine Particulate Pollution.” The Science of the Total Environment 642: 789–799. doi:10.1016/j.scitotenv.2018.06.094.
- He, B., and J. Zhu. 2018. “Constructing Community Gardens? Residents’ Attitude and Behaviour Towards Edible Landscapes in Emerging Urban Communities of China.” Urban Forestry & Urban Greening 34: 154–165. doi:10.1016/j.ufug.2018.06.015.
- Hu, M., L. Jia, J. Wang, and Y. Pan. 2013. “Spatial and Temporal Characteristics of Particulate Matter in Beijing, China Using the Empirical Mode Decomposition Method.” The Science of the Total Environment 458-460: 70–80. doi:10.1016/j.scitotenv.2013.04.005.
- Huang, B., and J. Wang. 2020. “Big Spatial Data for Urban and Environmental Sustainability.” Geo-Spatial Information Science 23 (2): 125–140. doi:10.1080/10095020.2020.1754138.
- Jeanjean, A.P.R., P.S. Monks, and R.J. Leigh. 2016. “Modelling the Effectiveness of Urban Trees and Grass on PM2.5 Reduction via Dispersion and Deposition at a City Scale.” Atmospheric Environment 147: 1–10. doi:10.1016/j.atmosenv.2016.09.033.
- Jeanjean, A.P.R., R. Buccolieri, J. Eddy, P.S. Monks, and R.J. Leigh. 2017. “Air Quality Affected by Trees in Real Street Canyons: The Case of Marylebone Neighbourhood in Central London.” Urban Forestry & Urban Greening 22: 41–53. doi:10.1016/j.ufug.2017.01.009.
- Jin, S.J., J.K. Guo, S. Wheeler, L.Y. Kan, and S.Q. Che. 2014. “Evaluation of Impacts of Trees on PM2.5 Dispersion in Urban Streets.” Atmospheric Environment 99: 277–287. doi:10.1016/j.atmosenv.2014.10.002.
- Kan, H., R. Chen, and S. Tong. 2012. “Ambient Air Pollution, Climate Change, and Population Health in China.” Environmental International 42: 10–19. doi:10.1016/j.envint.2011.03.003.
- Kloog, I., P. Koutrakis, B.A. Coull, H.J. Lee, and J. Schwartz. 2011. “Assessing Temporally and Spatially Resolved PM2.5 Exposures for Epidemiological Studies Using Satellite Aerosol Optical Depth Measurements.” Atmospheric Environment 45 (35): 6267–6275. doi:10.1016/j.atmosenv.2011.08.066.
- Li, D., J. Shan, Z. Shao, X. Zhou, and Y. Yao. 2013. “Geomatics for Smart Cities – Concept, Key Techniques, and Applications.” Geo-Spatial Information Science 16 (1): 13–24. doi:10.1080/10095020.2013.772803.
- Li, B., Y. Liu, H. Xing, Y. Meng, G. Yang, X. Liu, and Y. Zhao. 2022. “Integrating Urban Morphology and Land Surface Temperature Characteristics for Urban Functional Area Classification.” Geo-Spatial Information Science 1–16. doi:10.1080/10095020.2021.2021786.
- Lim, S.S., T. Vos, A.D. Flaxman, G. Danaei, K. Shibuya, H. Adair-Rohani, M. Amann, et al. 2012. ”A Comparative Risk Assessment of Burden of Disease and Injury Attributable to 67 Risk Factors and Risk Factor Clusters in 21 Regions, 1990-2010: A Systematic Analysis for the Global Burden of Disease Study 2010.” Lancet 380 (9859): 2224–2260. DOI:10.1016/S0140-6736(12)61766-8.
- Lin, C.Q., Y. Li, A.K.H. Lau, X.J. Deng, T.K.T. Tse, J.C.H. Fung, C.C. Li, et al. 2016. ”Estimation of Long-Term Population Exposure to PM2.5 for Dense Urban Areas Using 1-Km MODIS Data”. Remote Sensing of Environment 179: 13–22. 10.1016/j.rse.2016.03.023.
- Liu, H.M., Q.M. Zhan, C. Yang, and J. Wang. 2018. “Characterizing the Spatio-Temporal Pattern of Land Surface Temperature Through Time Series Clustering: Based on the Latent Pattern and Morphology.” Remote Sensing 10 (4). doi:10.3390/rs10040654.
- Liu, C., R. Chen, F. Sera, A.M. Vicedo-Cabrera, Y. Guo, S. Tong, M. Coelho, et al. 2019a. ”Ambient Particulate Air Pollution and Daily Mortality in 652 Cities.” New England Journal of Medecine 381 (8): 705–715. DOI:10.1056/NEJMoa1817364.
- Liu, H., Q. Zhan, C. Yang, and J. Wang. 2019b. “The Multi-Timescale Temporal Patterns and Dynamics of Land Surface Temperature Using Ensemble Empirical Mode Decomposition.” The Science of the Total Environment 652: 243–255. doi:10.1016/j.scitotenv.2018.10.252.
- Liu, H.M., Q.M. Zhan, S.H. Gao, and C. Yang. 2019c. “Seasonal Variation of the Spatially Non-Stationary Association Between Land Surface Temperature and Urban Landscape.” Remote Sensing 11 (9). doi:10.3390/rs11091016.
- Lu, D.B., W.L. Mao, D.Y. Yang, J.N. Zhao, and J.H. Xu. 2018. “Effects of Land Use and Landscape Pattern on PM2.5 in Yangtze River Delta, China.” Atmospheric Pollution Research 9 (4): 705–713. doi:10.1016/j.apr.2018.01.012.
- Ma, Z., X. Hu, A.M. Sayer, R. Levy, Q. Zhang, Y. Xue, S. Tong, et al. 2016. ”Satellite-Based Spatiotemporal Trends in PM2.5 Concentrations: China, 2004-2013.” Environmental Health Perspectives 124 (2): 184–192. DOI:10.1289/ehp.1409481.
- McGarigal, K. 1995. “FRAGSTATS: Spatial Pattern Analysis Program for Quantifying Landscape Structure.” US Department of Agriculture, Forest Service, General technical report PNW (USA).
- McMaster, R.B., and E. Sheppard. 2004. “Introduction: Scale and Geographic Inquiry.” In Scale and Geographic Inquiry, edited by E. Sheppard, and R.B. McMaster, 1–22. Blackwell Publishing, Malden, MA.
- Nowak, D.J., S. Hirabayashi, A. Bodine, and R. Hoehn. 2013. “Modeled PM2.5 Removal by Trees in Ten U.S. Cities and Associated Health Effects.” Environmental Pollution 178: 395–402. doi:10.1016/j.envpol.2013.03.050.
- Ord, J.K., and A. Getis. 1995. “Local Spatial Autocorrelation Statistics – Distributional Issues and an Application.” Geographical Analysis 27 (4): 286–306. doi:10.1111/j.1538-4632.1995.tb00912.x.
- Ouyang, W., T.E. Morakinyo, C. Ren, and E. Ng. 2020. “The Cooling Efficiency of Variable Greenery Coverage Ratios in Different Urban Densities: A Study in a Subtropical Climate.” Building and Environment 174: 106772. doi:10.1016/j.buildenv.2020.106772.
- Peng, J., S. Chen, H. Lü, Y. Liu, and J. Wu. 2016. “Spatiotemporal Patterns of Remotely Sensed PM 2.5 Concentration in China from 1999 to 2011.” Remote Sensing of Environment 174: 109–121. doi:10.1016/j.rse.2015.12.008.
- Song, Y., B. Huang, Q. He, B. Chen, J. Wei, and R. Mahmood. 2019. “Dynamic Assessment of PM2.5 Exposure and Health Risk Using Remote Sensing and Geo-Spatial Big Data.” Environmental Pollution 253: 288–296. doi:10.1016/j.envpol.2019.06.057.
- van Donkelaar, A., R.V. Martin, M. Brauer, N.C. Hsu, R.A. Kahn, R.C. Levy, A. Lyapustin, A.M. Sayer, and D.M. Winker. 2016. “Global Estimates of Fine Particulate Matter Using a Combined Geophysical-Statistical Method with Information from Satellites, Models, and Monitors.” Environmental Science & Technology 50 (7): 3762–3772. doi:10.1021/acs.est.5b05833.
- van Donkelaar, A., R.V. Martin, M. Brauer, N.C. Hsu, R.A. Kahn, R.C. Levy, A. Lyapustin, A.M. Sayer, and D.M. Winker. 2018. “Global Annual PM2.5 Grids from MODIS, MISR and SeaWifs Aerosol Optical Depth (AOD) with GWR, 1998-2016.” Palisades, NY: NASA Socioeconomic Data and Applications Center (SEDAC).
- Warren Liao, T. 2005. “Clustering of Time Series Data—A Survey.” Pattern Recognition 38 (11): 1857–1874. doi:10.1016/j.patcog.2005.01.025.
- WMPG. 2020. http://www.wuhan.gov.cn/ztzl/2019ngb/mbrwzxqk/sfzggw/202004/t20200414_998401.shtml
- World Health Organization. 2004. “Outdoor Air Pollution: Assessing the Environmental Burden of Disease at National and Local Levels.”
- World Health Organization. 2016. “Ambient Air Pollution: A Global Assessment of Exposure and Burden of Disease.”
- Wu, J., J. Li, J. Peng, W. Li, G. Xu, and C. Dong. 2015a. “Applying Land Use Regression Model to Estimate Spatial Variation of PM2.5 in Beijing, China.” Environmental Science and Pollution Research 22 (9): 7045–7061. doi:10.1007/s11356-014-3893-5.
- Wu, J., W. Xie, W. Li, and J. Li. 2015b. “Effects of Urban Landscape Pattern on PM2.5 Pollution – A Beijing Case Study.” PLoS One 10 (11): e0142449. doi:10.1371/journal.pone.0142449.
- Wu, H.T., C. Yang, J. Chen, S. Yang, T. Lu, and X.T. Lin. 2018. “Effects of Green Space Landscape Patterns on Particulate Matter in Zhejiang Province, China.” Atmospheric Pollution Research 9 (5): 923–933. doi:10.1016/j.apr.2018.03.004.
- Xu, G., L.M. Jiao, S.L. Zhao, M. Yuan, X.M. Li, Y.Y. Han, B. Zhang, and T. Dong. 2016. “Examining the Impacts of Land Use on Air Quality from a Spatio-Temporal Perspective in Wuhan, China.” Atmosphere 7 (5): 62. doi:10.3390/atmos7050062.
- Xu, G., L. Jiao, B. Zhang, S. Zhao, M. Yuan, Y. Gu, J. Liu, and X. Tang. 2017. “Spatial and Temporal Variability of the PM2.5/PM10 Ratio in Wuhan, Central China.” Aerosol and Air Quality Research 17 (3): 741–751. doi:10.4209/aaqr.2016.09.0406.
- Yang, J., J. Sun, Q.S. Ge, and X.M. Li. 2017. “Assessing the Impacts of Urbanization-Associated Green Space on Urban Land Surface Temperature: A Case Study of Dalian, China.” Urban Forestry & Urban Greening 22: 1–10. doi:10.1016/j.ufug.2017.01.002.
- Yang, C., Q.M. Zhan, J. Zhang, H.M. Liu, and Z.Y. Fan. 2018a. “Quantifying the Relationship Between Natural and Socioeconomic Factors and with Fine Particulate Matter (Pm2.5) Pollution by Integrating Remote Sensing and Geospatial Big Data.” 2018 Isprs Workshop on Remote Sensing and Synergic Analysis on Atmospheric Environment 42-3(W5): 77–82. doi:10.5194/isprs-archives-XLII-3-W5-77-2018.
- Yang, D., X. Wang, J. Xu, C. Xu, D. Lu, C. Ye, Z. Wang, and L. Bai. 2018b. “Quantifying the Influence of Natural and Socioeconomic Factors and Their Interactive Impact on PM2.5 Pollution in China.” Environmental Pollution 241: 475–483. doi:10.1016/j.envpol.2018.05.043.
- Yang, C., Q. Zhan, S. Gao, and H. Liu. 2019a. “How Do the Multi-Temporal Centroid Trajectories of Urban Heat Island Correspond to Impervious Surface Changes: A Case Study in Wuhan, China.” International Journal of Environmental Research and Public Health 16 (20): 3865. doi:10.3390/ijerph16203865.
- Yang, C., Q.M. Zhan, Y.Z. Lv, and H.M. Liu. 2019b. “Downscaling Land Surface Temperature Using Multiscale Geographically Weighted Regression Over Heterogeneous Landscapes in Wuhan, China.” IEEE Journal of Selected Topics in Applied Earth Observations and Remote Sensing 12 (12): 5213–5222. doi:10.1109/Jstars.2019.2955551.
- Yang, C., Q. Zhan, Y. Xiao, and H. Liu. 2020a. “Identifying the Driving Factors of Population Exposure to Fine Particulate Matter (Pm2.5) in Wuhan, China.” ISPRS Annals of the Photogrammetry, Remote Sensing and Spatial Information Sciences, V-3-2020, 355–361, doi:10.5194/isprs-annals-V-3-2020-355-2020
- Yang, C., Q.M. Zhan, S.H. Gao, and H.M. Liu. 2020b. “Characterizing the Spatial and Temporal Variation of the Land Surface Temperature Hotspots in Wuhan from a Local Scale.” Geo-Spatial Information Science 23 (4): 327–340. doi:10.1080/10095020.2020.1834882.
- Yang, J., and X. Huang. 2021. 30 M Annual Land Cover and Its Dynamics in China from 1985 to 2019 (Version 1.0.0). Edited by J. Yang, and X. Huang. Zenodo: Zenodo.
- Yang, C., and S. Zhao. 2022. “Urban Vertical Profiles of Three Most Urbanized Chinese Cities and the Spatial Coupling with Horizontal Urban Expansion.” Land Use Policy 113. doi:10.1016/j.landusepol.2021.105919.
- Yu, Z., X. Guo, G. Jørgensen, and H. Vejre. 2017. “How Can Urban Green Spaces Be Planned for Climate Adaptation in Subtropical Cities?” Ecological Indicators 82: 152–162. doi:10.1016/j.ecolind.2017.07.002.
- Zhan, Q., Y. Yue, and Y. Xiao. 2018. “Evolution of Built-Up Area Expansion and Verification of Planning Implementation in Wuhan, City.” Planning Review 42 (2018): 63–71. doi:10.11819/cpr20180310a.
- Zhang, T.H., Z.M. Zhu, W. Gong, Z.R. Zhu, K. Sun, L.C. Wang, Y.S. Huang, et al. 2018. “Estimation of Ultrahigh Resolution PM2.5 Concentrations in Urban Areas Using 160 M Gaofen-1 AOD Retrievals.” Remote Sensing of Environment 216: 91–104. doi:10.1016/j.rse.2018.06.030.
- Zhang, L.Q., W.W. Liu, K. Hou, J.T. Lin, C.H. Zhou, X.H. Tong, Z.Y. Wang, et al. 2019a. “Air Pollution-Induced Missed Abortion Risk for Pregnancies.” Nature Sustainability 2 (11): 1011–1017. doi:10.1038/s41893-019-0387-y.
- Zhang, Q., Y. Zheng, D. Tong, M. Shao, S. Wang, Y. Zhang, X. Xu, et al. 2019b. “Drivers of Improved PM2.5 Air Quality in China from 2013 to 2017.” Proceedings of the National Academy of Sciences 116 (49): 24463–24469. doi:10.1073/pnas.1907956116.