
 ?Mathematical formulae have been encoded as MathML and are displayed in this HTML version using MathJax in order to improve their display. Uncheck the box to turn MathJax off. This feature requires Javascript. Click on a formula to zoom.
ABSTRACT
The public sector’s possibilities of using geospatial technologies are vast and can improve public management. In the Brazilian Federal Government, the use of geospatial technologies is unknown, nor is it known the main applications and public and private actors involved. This research proposes to analyze the geospatial technologies market in the Federal Government between the years 2011 and 2019 through public data of contracts. Through the individual analysis of 600 contracts, we concluded that R$ 804,747,626.99 were negotiated during the period. The contracts mainly involved Remote Sensing and Aerophotogrammetry (50%) and Geographic Information Systems (33%) solutions, applied primarily in the thematic areas of Oil & Gas (39%), Infrastructure (19%), and Environment & Natural Resources (10%). Fototerra was the leading company, providing R$ 155,553,107.03 in products and services. The foremost acquiring institution was the Ministry of Mines and Energy, contracting R$ 410 million, of which Petrobras acquired R$ 311 million. This paper showed how different federal institutions use Geography’s technological bases to fulfill their missions, improve social well-being, and contribute to a more developed, less unequal, and fairer country.
1. Introduction
There are several definitions for geospatial technologies. The lack of standardized terminology means that its understandings vary from country to country or even within a single country (Genovese et al. Citation2009). In this research, we assume geospatial technologies as resources for collecting, processing, analyzing, and delivering information with geographic reference. They are composed of hardware and software solutions and professional services that constitute decision-making tools.
This industry applies high technology to global operations, based on digital cartography and surveying, geographic information systems, remote sensing, and global positioning by satellites (Gewin Citation2004; Souza, Roberto, and Crósta Citation2003; Rosa Citation2005; Favrin Citation2009). The United States of America (U.S.) and Europe are huge consumers, with the U.S. leading the global market. Eastern Europe, the Middle East, Latin America, and Asia are emerging markets (Xu and Liu Citation2011). In a country with a continental dimension, such as Brazil, with a remarkable lack of adequate decision-making information, geospatial technologies have enormous potential for the public sector (Câmara et al. Citation2000; Georgiadou and Stoter Citation2010; Georgiadou and Reckien Citation2018; Hansen and Schrøder Citation2019; Liu and Liu Citation2015). According to Coote, Feldman, and McLaren (Citation2010), the public sector represents more than half of Business to Business (B2B) contracts in geospatial technologies in the United Kingdom. In China and most developing countries, such as Brazil, the Federal Government is the largest consumer of these technologies (Zhang, Du, and Qiao Citation2015). They support several public policies based on geographic location, considering the most diverse federal institutions.
In government, geospatial technologies are used both in routine functions and in strategic activities, such as public health, environmental management, public security, urban and rural planning, territorial control, military strategy, emergency management, and prevention of natural disasters, among others (Genovese et al. Citation2009). Studies also claim that its use significantly reduces corruption (Akingbade et al. Citation2012) and increases public transparency and geoinformation management capacity (Scheidegger, Carneiro, and Araujo Citation2013; Câmara and Fonseca Citation2007; Hansen and Schrøder Citation2019).
We know the Brazilian Federal Government is a user and producer of geospatial technologies. Projects such as the development of CBERS (Sino-Brazilian Earth Resources Satellite) and Amazonia-1 remote sensing satellites (Fonseca et al. Citation2014), the Amazon Deforestation Monitoring Project by satellite (Prodes Citation2013), the Cartography of the Amazon mapping project (Vieira Citation2015), the development of Geographical Information Systems SPRING and Terralib (Câmara et al. Citation2008), and the regulation of rural properties georeferencing prove this statement (Rosalen Citation2014; Roitman et al. Citation2018). These demands and the lack of formal knowledge of the market can result in a mismatch between government demand and supply in the country since using geospatial products requires trained people, both on the buyer side and the supplier side (Parker Citation1991; Rose Citation1990). Reducing this knowledge gap could also bring new data and arguments to revert the current worldwide scenario of low geomatics student intake (Aina et al. Citation2014; Abd-Elrahman et al. Citation2019).
Our research goal is to understand the market for geospatial technologies in the Brazilian Federal Government and explain its dynamics from the years 2011 to 2019, analyzing the expenditures by Ministries of the federal administration, identifying the significant projects, and leading suppliers and acquirers. So, this objective seeks to: i) Define the size of the market (in Brazilian Reais – R$) and explain its dynamics over the years; ii) Provide evidence of the commercial relationship established between the government and companies; iii) Decompose the market into subdivisions using a decomposition indicator and understand its behavior during the time and iv) Analyze competition between companies and a possible market concentration.
Due to the high importance and short bibliography, the lack of information and knowledge about the Brazilian geospatial market is evident. Research like this can benefit the Federal Administration, companies, universities, and society. Understanding the market can make services and products offered at lower prices, with higher quality, and cause a more significant impact on Brazilian society, generating jobs and improving the population’s quality of life.
2. Literature review
The use of geospatial technologies by governments and private companies has been studied through different methods and in various locations worldwide. Scientific publications or market reports about this theme were developed in Taiwan, China (Canada Citation2011), United Kingdom (Coote, Feldman, and McLaren Citation2010; Frontier Citation2020), Russia (Gromyko et al. Citation2015); India (Gupta Citation2000; Murthi Citation2018; Murth and Rao Citation2017), Egypt (Khalifa and Abdel-Halim Citation2013), United States (MacPherson and Hartung Citation2001; Cowen Citation2009; National Geospatial Advisory Committee Citation2015), South Africa and Poland (Harvey et al. Citation2012), Nigeria (Akingbade et al. Citation2012), China (Zhong and Liu Citation2008; Zhang, Du, and Qiao Citation2015), Uganda (Nasirumbi Citation2006; Kurwakumire Citation2014; Makumbi Citation2010) Canada (MacPherson and Hartung Citation2001), Namibia (Noongo Citation2007) and Indonesia (Karsidi Citation2012). Other studies go beyond national borders, considering the continents of Africa (Schwabe Citation2007), Europe (Probert and Wolfkamp Citation2003), or even the whole world as UN-GGIM (Citation2015). We found a single and brief paper written by Pimentel (Citation2020) that provides some high-level analysis about of Brazil’s federal geoinformation governance. These works represent a set of scientific articles and institutional reports that expose a series of data on geospatial technologies, discussing the size of the market, importance in the national scenario, weaknesses, and strengths.
These works differ from each other on several points. Xu and Liu (Citation2011), UN-GGIM (Citation2015), Coote, Feldman, and McLaren (Citation2010), Pimentel (Citation2020), Karsidi (Citation2012), Georgiadou and Reckien (Citation2018), Georgiadou and Stoter (Citation2010), Georgiadou et al. (Citation2009), Georgiadou, Rodriguez-Pabon, and Lance (Citation2006) and Frontier (Citation2020) bring views on governance and public policies involving geospatial technologies, discussing government proposals and their implementations. For this, they used secondary data, surveys, or confidential data from the government itself. These are studies of institutional diagnosis, with little depth on the private sector’s participation, emphasizing the State’s role in establishing guidelines for the governance of geoinformation and geospatial technologies. These works also discuss the implementation of national Spatial Data Infrastructures (SDI) and evaluate their proposals, and the status of these initiatives.
Other studies stand out for deepening geospatial technologies considering their utilization by both the government and the private sector. With these characteristics, we can cite Canada (Citation2011), Wu and Li (Citation2016), Probert and Wolfkamp (Citation2003), Zhang, Du, and Qiao (Citation2015), and MacPherson and Hartung (Citation2001).
Also, the methods used are wide-ranging. Wu and Li (Citation2016) used companies’ financial reports to perform their analyzes. National Geospatial Advisory Committee (Citation2015), Gupta (Citation2000), Xu and Liu (Citation2011), Coote, Feldman, and McLaren (Citation2010), and Harvey et al. (Citation2012) used public or confidential government data in their studies, while Murthi (Citation2018), Murthi and Rao (Citation2017), Gromyko et al. (Citation2015) and Karsidi (Citation2012) used only the review of scientific and government documents. Another identified method is the application of surveys with public and private entities, as demonstrated by Probert and Wolfkamp (Citation2003), Noongo (Citation2007), Khalifa and Abdel-Halim (Citation2013), Zhong and Liu (Citation2008), and MacPherson and Hartung (Citation2001). Brazil, however, still lacks studies like these, and it is unknown who the leading players in the geospatial technology industry are, their actual size, structure, and relevance to the country. The importance of geospatial technologies for society and public administration is well known (Georgiadou and Stoter Citation2010; Georgiadou and Reckien Citation2018; Hansen and Schrøder Citation2019; Liu and Liu Citation2015). However, measuring its influence in the Brazilian Federal Government can enable a deeper understanding of its relevance to society.
As seen in the scientific literature that discusses similar topics in other countries, there are gaps in knowledge about the theme. There is a fragmentation of information in several studies that analyze the market, public policies, applications, or trends of use by governments, not the relationship between these components. It is clear that we still need to address the use of geospatial technologies comprehensively over time. The relationship between companies and governments is also not explored quantitatively, just as it is necessary to use methodologies that consider primary government open data. Also, except for the brief article by Pimentel (Citation2020), there is no research on this theme in Brazil.
3. Material and methods
In general, the methodology consists in collecting public data about contracts signed between private companies and federal government institutions (Martins and de Souza Véspoli Citation2013; Harrison and Sayogo Citation2014; Zuiderwijk and Janssen Citation2014; Oliveira et al. Citation2016), establishing market decomposition indicators (Zhong, and Liu Citation2008), calculating the Herfindahl–Hirschman Index (Herfindahl Citation1959), and analyzing the results considering the private companies, public institutions, and thematic areas. shows the methodological procedures applied in this paper.
Figure 1. Methodological workflow.
3.1. Data source
The data source was the Federal Government’s Transparency Portal (Brasil Citation2012; Martins and de Souza Véspoli Citation2013; Harrison and Sayogo Citation2014; Zuiderwijk and Janssen Citation2014; Oliveira et al. Citation2016), launched in 2004. It is an initiative of the CGU – Office of the Comptroller General, and its objective is to disclose Federal spending, bidding, and budget transfers. Although classified data are not available for consultation, such as intelligence or national security agencies’ expenses, there is a large amount of information available, updated monthly since 2011. According to Nazário, Silva, and Rover (Citation2012) and Tenente Ahmar and Almeida (Citation2017), the Portal, despite presenting some difficulties in its use, is a reliable and accessible source of information. We opted to analyze annual data between 2011 and 2019 due to data before 2011 is unavailable on the Transparency Portal.
3.2. Definition of target institutions
private companies: We considered many companies in the geospatial business with wide notoriety in the Brazilian market. After initial searches on the Transparency Portal, we discarded some since, even with known relevance in the market in general, they had less than R$ 50 thousand (about US$ 10 thousand) negotiated with the Federal Government during the period. We defined this cutoff threshold arbitrarily, considering companies with businesses smaller than this value without significance for analysis. Thus, this screening resulted in the selection of 31 companies (Appendix A).
Federal Ministries: We considered only the top administrative level institutions (State Ministries, Ministry-level offices, and the Presidency of the Republic), reaching a total of 17 (Appendix B). They respond directly to the President of the Republic, supporting the exercise of the Executive Power. They have technical, financial, and administrative autonomy to carry out actions in their designated area.
3.3. The market decomposition indicator, based on Zhong and Liu (Citation2008)
Zhong and Liu (Citation2008) studied the size of the geospatial technology market in China by collecting primary and secondary data obtained from the government, companies, the internet, and in loco. As Zhong and Liu (Citation2008) work presents some similarities with this paper, we adapted their methodology to the reality of Brazilian government public data. Methodologically, Zhong and Liu (Citation2008) proposed a market decomposition indicator, considering the following indicators i) Cartographic survey (geodesy and surveying, photogrammetry and mapping services), ii) GIS commercialization, iii) remote sensing, iv) GNSS – Global Navigation Satellite System, v) thematic mapping, and vi) others. Each of these indicators was divided into other sub-indicators, allowing a more detailed analysis of the parts that make up the total market. This work is a methodological reference, as it consolidated data from several sources and described the market through quantitative and qualitative analyzes. We proposed a new structure for Zhong and Liu (Citation2008) indicators, adapting them to the Brazilian reality. So, we collected the scope of contracts between the public and federal sectors and grouped them according to the geospatial technology acquired to compose the market decomposition indicator. The market decomposition indicator (MDI) shows which industry sectors are the most relevant for the Federal Government (EquationEquation (1)(1)
(1) ):
Where each indicator represents the contracted monetary amount of products and services, in Brazilian Reais (R$) for:
GIS: Geographic Information Systems;
Rsa: Remote Sensing and Aerophotogrammetry;
Map: Mapping and Digital Cartography;
Geo: Geodesy and Surveying;
Tts: Training and Technical Support.
The composition of the GIS indicator is given by EquationEquation (2)(2)
(2) :
Where:
Lic: GIS licensing;
Dev: GIS Development;
Dat: Geospatial Data.
The composition of the Rsa indicator is given by EquationEquation (3)(3)
(3) :
Where:
Dsp: Solutions for data and signal processing;
Rse: Orbital remote sensing products and services;
Aer: Aerophotogrammetry products and services.
The composition of the Map indicator is given by EquationEquation (4)(4)
(4) :
Where:
The: Thematic mapping services;
Sys: Systematic mapping services.
The composition of the Geo indicator is given by 5:
Where:
Srv: Surveying services and equipment;
Gdy: Geodesy services and equipment.
Finally, we represented the indicator “Training and Technical Support” by a single item called “Tts”. These two elements are merged because most contracts’ scope refers to them together, making it impossible to disassociate through the available data.
3.4. Herfindahl–Hirschman index
We calculated the HHI – Herfindahl-Hirschman Index (Herfindahl Citation1959), which is an indicator of companies’ size relative to their industry and an indicator of the degree of competition between them, permitting us to analyze, for example, cartels or monopolies. HHI is the most used index by government antitrust authorities. Oliveira (Citation2014) and Rocha (Citation2010) state that Denmark, Norway, and the United States governments recommend HHI. Indicators of this nature are antitrust instruments that can be applied in specific industries, such as the geospatial industry. HHI ranges from 0 to1: a value increase indicates a decrease in competition and an increase in market concentration, while its reduction suggests the opposite. EquationEquation (6)(6)
(6) describes the index:
Where:
qi is the market quota q of the company i
N is the number of companies
According to Herfindahl (Citation1959):
H below 0.01 indicates a high level of competition;
H between 0.01 and 0.15 indicates a non-concentration;
H between 0.16 and 0.25 indicates a moderate concentration;
H above 0.25 indicates a high concentration.
3.5. Definition of thematic areas used as analysis proxy
We classified the data collected according to the Market Decomposition Indicator adapted from Zhong and Liu (Citation2008) and according to the thematic area of application. The following thematic areas served as a reference for the analysis of the results ().
Table 1. Thematic areas.
We considered the absolute values declared in contracts to analyze temporal data behavior and adjusted them by the IPCA (Extended National Consumer Price Index) (Martinez, and Cerqueira Citation2013), the official Brazilian inflation index. The Compound Annual Growth Rate (CAGR) was used to measure the variation of the contracted values over a period, calculated as shown by EquationEquation (7)(7)
(7) . We used CAGR to indicate yearly growth.
Where:
CAGR: Compound Annual Growth Rate;
: value contracted (R$) in the final year of the series;
: amount contracted (R$) in the initial year of the series;
Y: Total years considered.
4. Results
4.1. The Private sector: market share and portfolio
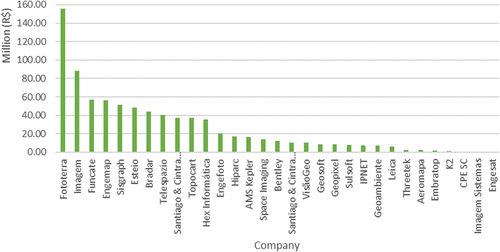
Through the individual analysis of 600 contracts, we found that the Federal Government contracted R$ 804,747,626.99 (about US$ 140 million) during the analysis period (M = R$ 1,341,246.04; SD = R$ 5,902,967.34; Min. = R$ 274.00; Max. = R$ 112,991,465.57). Fototerra leads the ranking, presenting almost twice the sales of Imagem, a company in the second position (). Funcate, Engemap, and Sisgraph present values close to R$ 50 million. At the end of the list, Engesat negotiated R$ 71,850.01, divided into three contracts.
Figure 2. Total sales by the company (R$).
shows the ten most significant contracts signed in the period. Seven contracts were for Rsa - Remote Sensing and Aerophotogrammetry, two for Map - Mapping and Digital Cartography, and one for GIS - Geographic Information Systems, applied in the thematic areas of Oil & Gas, Infrastructure, Space Technology Development, Environment & Natural Resources and, Territorial Management & Monitoring. MME, MI, MCTI, and MMA were the purchasing institutions and, Fototerra, Esteio, Funcate, Engemap, Topocart, Bradar, Santiago & Cintra Consultoria, Hex Informática, and Telespazio were the sellers
Table 2. Top ten contracts signed from 2011 to 2019.
Remote Sensing and Aerophotogrammetry (Rsa) products represented 50% of the total (R$ 399 million) contracted by the Brazilian Federal Government, of which R$ 253 million were exclusively related to Aerophotogrammetry (Aer) (). The commercial use of remote sensing products has had an abundant growth of players in its production chain. In addition to the companies that generate the data, several companies specialized in interpreting and classifying images, and others are responsible only for their commercialization.
Figure 3. Market decomposition indicator.
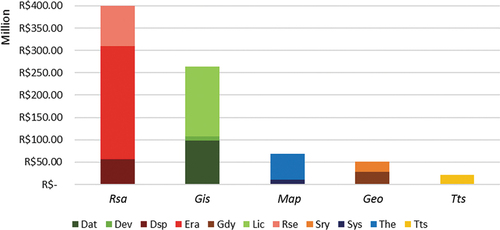
Concerning the Rse - Remote Sensing sub-indicator, the total contracted was close to R$ 90 million. The contracts mainly provide high/medium spatial resolution images and SAR – Synthetic Aperture Radar products. Both through data licensing (i.e. TIF Files) or via web service or Application Programming Interface (API).
Rsa contracts’ average value was R$ 5.7 million, reinforcing the high costs involved in these solutions and indicating that the Federal Government used third-party products to implement public policies, mainly aero photogrammetry, but also invested in the development of national space technology. We also observed contracts for Unmanned Aerial Vehicles (Drones and UAVs) acquisition by Petrobras toFootnote1 reduce costs of acquiring “traditional” aerial or orbital imagery. Finally, the sub-indicator “Dsp – Solutions for data and signal processing” corresponded to R$ 56.6 million, influenced by the CBERS and AMAZONIA-1 satellites projects.
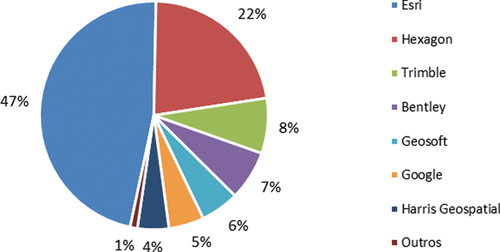
With 33% of the total contracted, GIS was the second most present indicator. The sub-indicator Lic represented R$ 156 million (), induced by the following software: Esri ArcGIS, ENVI, ERDAS, Google Maps API, Google Earth Pro, Geomedia, Geosoft Target, Trimble Quantm e Here Maps.
Esri dominates the Geographic Information Systems market in the Brazilian Federal Government (Lic sub-indicator), holding 47% of the total contracted volume (). Also, with significant participation, Hexagon dominates 22% of the market, having their software sold both by Sisgraph (Hexagon Brasil) and Santiago & Cintra Consultoria. Trimble is in third position, with 8% of the market share, strongly supported by the sale of Quantm software and others for geodetic data processing.
Figure 4. GIS market share.
The “Dat – Geospatial data” sub-indicator corresponded to R$ 99 million. The scope of these contracts covers labor outsourcing for geoprocessing activities, field data collection, and geospatial database modeling. Finally, “Dev – GIS Development” services represented R$ 9.4 million, with FUNCATE and K2 Sistemas as the leading suppliers.
The Tts, Geo, and Map indicators corresponded to 17% (R$ 140 million) of the total, with the sub-indicator “The – Thematic Mapping services” representing R$ 57.4 million (). Two contracts stand out: i) contract #36/2013 between Bradar and CPRM – Geological Survey of Brazil (Ministry of Mines and Energy), where the scope is “to provide specialized technical services for remote sensing data collected by synthetic opening interferometric radar operating in the x and p bands, including geomorphometric mathematical models for risk mapping”, valued in R$ 29,605,265.00, to execute thematic mapping of areas susceptible to landslides in several Brazilian municipalities, ii) contract #1470/2011 between Funcate and INPE (Ministry of Science, Technology, and Innovation), to “provide development services to support the Amazon Deforestation Monitoring Program By Satellites” at the cost of R$ 15,753,676.27, resulting in thematic mappings for monitoring and controlling Amazon deforestation.
“Geo – Geodesy and Surveying” contracts totaled R$ 50.8 million, highlighting contracts # 89,982/2015 and # 89,584/2015 signed between Fototerra and Petrobras, respectively for the execution of “technical services for geodetic survey” and “surveying services for monitoring the geodetic position of offshore oil platforms”, with values of R$ 9,492,555.00 and R$ 6,865,160.00.
The company Sisgraph was responsible for the ten highest value negotiations involving “Tts – Training and Technical Support”, all of them supplied to Petrobras, totaling R$ 18.3 million. The remaining R$ 2.8 million comprises 60 contracts signed between different companies and federal entities.
About the companies’ portfolios obtained from the Market Decomposition Indicator, there is a very diverse scenario. Companies such as Imagem, K2, Sulsoft, and Ipnet provide only GIS, and Leica, Embratop, and CPE provide services and equipment for surveying and geodesy. Other companies, such as Funcate, Hiparc, and VisãoGeo, have a more diverse portfolio. Therefore, we can affirm that companies tend to specialize in the sale of GIS, surveying, and geodesy. Companies that provide mapping or remote sensing imagery tend to have a broader portfolio, even selling GIS and other items (). Companies such as Imagem, Leica, and Sulsoft are distributors of software or hardware manufactured by foreign companies. Thus, they put corporate efforts toward selling these products that they distribute, resulting in a less diversified portfolio. shows the detailed data for each company and the distribution of its sales by market indicator.
Table 3. Market decomposition indicator by the company (R$).
4.2. Federal Government: geospatial technology demand and application
Of the 17 federal institutions listed, the Ministry of Citizenship (MC), the Ministry of Women, Family, and Human Rights (MMFDH), and the Ministry of Foreign Affairs (MRE) did not purchase anything.
MME and subordinate institutions are the primary buyers of geospatial technologies (). Three hundred eighty-five (385) contracts were signed, totaling R$ 410,352,719.80, representing 51% of the total negotiated. Of these, Petrobras acquired R$ 311,946,654.10 through 309 contracts, representing 38.7% of the total contracted by the Federal Government in the period. Other related institutions also bought geospatial technologies, such as ANEEL – Electricity Regulatory Agency (R$ 14.6 million), ANP – Petroleum, Natural Gas and Biofuels National Agency (R$ 2.5 million), ANM – National Mining Agency (R$ 503 thousand), CPRM – Geological Survey of Brazil (R$ 46.4 million), EPE – Energy Research Office (R$ 1.6 million), and Electric Power Federal Companies (R$ 16.8 million), such as Eletrobrás e Furnas.
Figure 5. Total acquisition by Federal institution (R$).
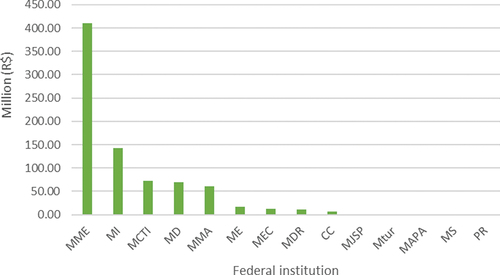
Ministry of Infrastructure (MI) was the second federal entity with the highest financial volume traded, having 25 contracts signed and R$ 142,755,657.51 spent. The DNIT – National Department of Transport Infrastructure was the largest buyer, reaching R$ 122 million. Many of these expenditures are related to aerophotogrammetry and topographic surveys, digital terrain models, and contour lines generation to support road infrastructure projects. Besides INFRAERO – Airport Infrastructure Company (R$ 958 thousand), EPL – Logistics & Planning Company (R$ 12 million), VALEC – Engineering, Construction, and Railroads S/A (R$ 3.7 million), and Docks Company of Pará (R$ 40 thousand) also contracted geospatial technologies.
MCTI invested mainly in the development of satellites (CBERS 3, CBERS 4, AMAZONIA-1, and AMAZONIA-1B), satellite monitoring of Amazon deforestation (Finer et al. Citation2018; Vurdubakis and Rajão Citation2020), and the development of the TerraLib GIS library. INPE carried these expenditures out mainly because it is responsible for regularly mapping deforestation and forest degradation in Amazon (Prodes Citation2013; Assis et al. Citation2020). These data are among the primary sources of information for decision-making regarding public policies for Amazon deforestation control. ANATEL – National Agency of Telecommunications (R$ 4.5 million), INB – Brazil Nuclear Industries (R$ 584 thousand), CEMADEN – National Center for Monitoring and Early Warnings of Natural Disasters (R$ 3.5 million), and the ON – National Observatory (R$ 251 thousand) also contracted geospatial technologies.
The Ministry of Defense (MD) contracted the systematic cartographic mapping of Amapá State, the generation of digital terrain models of the aerodromes surrounding areas, and the supplying of orbital radar (SAR) imagery for monitoring the Amazon, and the provisioning of software licenses for digital image processing. Army, Aeronautics, and Navy Commands carried out these acquisitions through various institutions such as CENSIPAM – Operations and Management Center of the Amazonian Protection System, 2nd Geoinformation Center, Department of Airspace Control, 3rd Survey Division, Navy Research Institute, and 8th Construction Engineer Battalion. Another recurrent contract’s scope is the use of geospatial technologies for military airspace control.
The Ministry of the Environment (MMA) contracted R$ 60.3 million, of which R$ 28,950,580.43 was to supply multispectral imagery from Rapideye satellites, provided by Santiago & Cintra Consultoria to support the Rural-Environmental Registry (CAR) (Rosalen Citation2014; Roitman et al. Citation2018; dos Santos et al. Citation2021). Other two significant contracts were signed between IBAMA – Brazilian Institute of Environment and Renewable Natural Resources and Hex Informática, for R$ 21,278,569.26 and R$ 9,268,456.64. Both contracts’ scope was to provide qualified labor for geospatial data production through geoprocessing and to support IBAMA’s geospatial technology infrastructure. SFB – Brazilian Forest Service (R$ 612 thousand) and ICMBio – Chico Mendes Institute for Biodiversity Conservation (R$ 226 thousand) also contracted geospatial technologies.
The remaining nine institutions signed 117 contracts, totaling R$ 49,062,731.27, corresponding to 6% of the total negotiated between 2011 and 2019. In this group, it is possible to highlight the contract signed between the Federal University of Lavras (UFLA) and Santiago & Cintra Consultoria in the amount of R$ 6,581,482.13. The scope was “hiring a qualified company to provide specialized technical services for thematic mapping to be used to support the Rural Environmental Registry information system (SICAR)”. Contracts #01/2016, signed between MDR and Hiparc (R$ 4,999,997.00), and #85/2017 signed between ME and Space Imaging (R$ 3,324,711.00) stipulated the supply of satellite imagery to support regional development policies and the national census operations. The companies Imagem and IPNET were contracted to supply GIS licenses. Imagem provided R$ 3,010,785.04 of ArcGIS licenses, training, and technical support for the MDR (contract 29/2013), and IPNET sold R$ 2,998,105.00 of Google Maps API – Premium licenses Plan for SERPRO – Federal Data Processing Service.
shows the distribution of contracts by market indicators. Federal Institutions have different contract scope from 2011 to 2019, involving all market indicators. The presence of GIS contracts is notorious in all of them, except in the MJSP. Nine ministries hired Rsa solutions, reinforcing that these two indicators are the drivers of geospatial technologies in the Federal Government.
Table 4. Market decomposition indicator by the federal institution (R$).
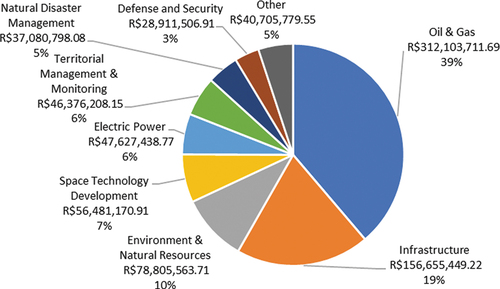
39% of the contracts were related to Oil & Gas, conducted by Petrobras, MME, and ANP. 19% were spent on infrastructure. These two thematic areas concentrated 58% of contracts between 2011 and 2019. Following, we listed expenditures on Environment & Natural Resources (10%), Space Technology Development (7%), Electric Power (6%), Territorial Management & Monitoring (6%), Natural Disaster Management (5%) and Defense & Security (3%). Contracts related to these thematic areas total 37%. Urban & Regional Development, Agriculture & Land Regularization, Economic & Geographic Research, Education and Cultural Heritage Management contracted the remaining 5% ().
Figure 6. Contracted amount (R$) by thematic area.
4.3. Time series analysis
Through the Compound Annual Growth Rate (CAGR) analysis, we identified a clear growth trend between 2011 and 2014, with a CAGR of 38% or 30% with inflation-adjusted amounts. There was a strong market retraction in the 2015–2019 time window, with a CAGR of −21% or −7%, after inflation adjustment. In 2014, the Federal Government contracted R$ 157.2 million in geospatial technologies, suffering a sharp drop to R$ 59.1 million in 2015. Over the entire nine-year period, the CAGR retraction was −3% or −16%, adjusted for inflation, with R$ 59.3 million negotiated in 2011 and R$ 47.9 million in 2019 ().
Figure 7. Total amount contracted (R$) by Federal Institutions and Petrobras and the number of contracts per year between 2011 and 2019.
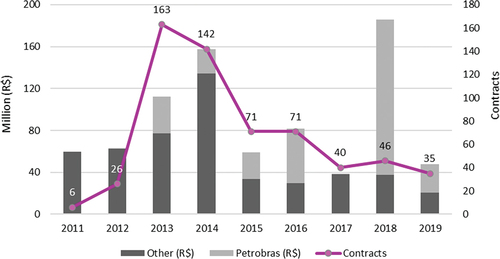
The year 2018 stands out with a contracted value of R$ 200 million, the highest in the series. However, this year, R$ 112.9 million refers to only one contract between Petrobras and Fototerra (number # 4,600,574,515), which has the highest value of all. Considering that, in 2018, Federal Government signed only 46 contracts (M = R$ 1.3 million and SD = R$ 5.9 million), we assumed this contract as an outlier, and this data should be analyzed with this caveat. The evolution of contract quantity and the amount contracted are related, except in 2018, due to this outlier contract ().
Petrobras has a strong representation in federal public purchases (Ribeiro and Furtado Citation2014; Ribeiro and Inácio Citation2019). shows Petrobras’ participation in annual purchases of geospatial technology from the Federal Government, comprising more than 50% of investments in 2016, 2018, and 2019. There is also a reduction between 2016 and 2017, dropping from R$ 52,3 million to R$ 630 thousand. However, the volume traded between 2016 and 2019 decreased from R$ 52.3 million to R$ 27.4.
When we analyze the time evolution of market indicators (), there are different behaviors. The Geo indicator peaked in 2015 and presented lower values in 2016, 2017, 2018, and 2019. Similar behavior can be found in the Tts and Map indicators, with remarkable growth until the middle of the decade and subsequently suffering a sharp decline. The Rsa indicator has two peaks, one in 2014, which followed the market’s growth trend, and then another in 2018, due to Fototerra’s outlier contract with Petrobras. The Gis indicator is steady, with ups and downs over the years, but without extreme behavior.
Figure 8. Market decomposition indicator – time series. (a) Map, (b) Geo, (c) GIS, (d) Rsa and (e) Tts.
Considering the total contracted between 2011 and 2019, HHI presented a value of 0.082, which indicates a non-concentrated market. However, this behavior has varied over time. In 2011 (HHI = 0.748), the market had a high concentration, increasing competition until 2013, when the HHI reached 0.132. In 2011, only Funcate, Imagem, Geosoft, and AMS Kepler signed contracts with the Federal Government. From 2013 to 2015, the market remained competitive, and in 2016 it returned to concentration, indicating that few companies were able to develop business in the face of a less favorable market during the political-economical crisis faced by Brazil in mid-2010 (Amorim Neto Citation2016; Mancebo Citation2017; Nunes and Melo Citation2017; Holland Citation2019). In 2018 and 2019, the market returns to a highly concentrated level with HHI at 0.411 and 0.300 ().
Figure 9. Market concentration: Herfindahl–Hirschman Index.
5. Discussion
5.1. Geospatial technologies
The Federal Government’s market for geospatial technologies involves different products, services, projects, public policies, technologies, applications, and actors. We bring here a unified discussion between these themes and the data collected. In this section, we emphasize the Rsa and GIS indicators, which correspond to 82% of the products and services negotiated in the period.
The activity of cartographic information production is foreseen in the Brazilian Federal Constitution as a fundamental activity for the State, whether for planning, military defense, or promoting social development. However, it is not only official cartographic production that moves the Brazilian marketplace. Over the years, the market has been strongly influenced by the mid-2010 political and economic crisis (Amorim Neto Citation2016; Mancebo Citation2017; Nunes and Melo Citation2017; Holland Citation2019), impacting its growth trend. Even so, hundreds of millions of reais were negotiated, and national relevant projects were supported by geospatial technologies, going beyond traditional official cartography.
Our results indicate that 50% of the contracted volume referred to Remote Sensing and Aerophotogrammetry (Rsa). The space programs conducted by MCTI, more specifically by AEB – Brazilian Space Agency and INPE, demanded constant collaboration with the private sector for their development. The CBERS program results from a Brazil and China partnership, involving INPE and the Chinese Academy of Space Technology (CAST), signed in 1988. The agreement aims to produce two advanced remote sensing satellites to map the two countries’ territories. The project’s strategic objectives were to enable Brazil to gain technological autonomy and strengthen its international partnership with China (Fonseca et al. Citation2014; Matos Citation2016).
In addition to the satellites’ mechanical components, INPE purchased software, such as the MS3 system, responsible for processing CBERS and Landsat imagery, thus delivering higher quality products to users. The national industry had significant participation in constructing the CBERS, and more than a dozen Brazilian companies in the aerospace sector contributed to the project (Matos Citation2016). In addition to supplying the subsystems under its concern, Brazil also provided equipment for some subsystems under China’s responsibility (Wood and Weigel Citation2012; Liporace Citation2013; Fonseca et al. Citation2014; Matos Citation2016). The leading geospatial suppliers that supported these space programs were Funcate and AMS Kepler.
According to Matos (Citation2016), the CBERS program, which received investments above US$ 300 million, was developed on a principle of “shared responsibilities” (30% Brazil and 70% China), to implement a complete world-class remote sensing system. According to AEB (Matos Citation2016), the CBERS satellites brought significant advances in space applications in Brazil, with more than 15 thousand registered users representing about 1,500 institutions. According to the AEB, these products are used to control deforestation and wildfires in the Amazon, and monitor water resources, agricultural areas, urban growth, and land occupation, among other applications. The Amazonia-1 platform is the first remote sensing satellite built entirely in Brazil, focusing on monitoring deforestation, especially in the Amazon region (Silva, Muraoka, and Garcia Citation2014; Moutinho Citation2021).
Birk et al. (Citation2003) evidenced this trend of expenditure concentration on remote sensing by the United States Government, and we observed this in Brazil through our results. Orbital remote sensing requires high investments in technology development and operation or hiring specialized national and international vendors. The aerophotogrammetry sector has the highest values precisely because it needs aircraft with embedded sensors, which demand high costs for operating licenses, highly specialized labor (e.g. aircraft pilots), and material resources (e.g. aeronautical fuel). It also incurs costs of moving aircraft to the imaging site and paying field teams that collect geodetic control points.
On the other hand, high spatial or temporal resolution satellite images are acquired from private companies, as seen in our results. Medium spatial resolution images are consumed from international space programs, such as Landsat or Sentinel, making Brazil internationally dependent for monitoring its territory yet.
Identifying and understanding the main drivers of change in the Earth observation market (including technological, human, cultural, and legal factors) is essential for companies and the federal government to position themselves strategically in the medium and long term. Coppa, Woodgate, and Mohamed-Ghouse (Citation2018) state that there were around 597 Earth observation satellites in orbit in 2017, with an expectation that this number would double by 2026 considering only Planet Labs, Digital Globe (now Maxar), Spire, and Blacksky. Small satellites (small-sats/cube-sats) have become popular due to the low acquisition costs and the high temporal resolution they offer. In Brazil, the Planet Labs CubeSats have gained notoriety in several industries. Its first contract with the Federal Government took place in 2018 (contract #15/2018), signed between SFB and the company Santiago & Cintra Consultoria, the official Brazilian distributor, with a value of R$ 357,885.04.
Cloud computing is transforming the way remote sensing data is stored, distributed, and analyzed, as raw images can be accessed over the web, without the need to obtain the original files (Chen et al. Citation2018; Yan et al. Citation2018; Amani et al. Citation2020; Sagan et al. Citation2020). It makes data dissemination easier, especially for non-specialists in remote sensing, and reduces the need for specific hardware and software for digital image processing. Also, the sale of images in raw files has not been sufficient to meet the market demands. Different products have been launched, such as ready-to-use thematic mapping and API to embed satellite images in other enterprise systems and not necessarily in a GIS (O’Sullivan, Wise, and Mathieu Citation2018; Warren et al. Citation2016; Tamiminia et al. Citation2020). For example, we observed this trend for contract #85/2017 (Space Imaging and IBGE), with the scope of providing “[…] license to access an online imagery of Quickbird, Worldview 1, 2 and 3 and Geoeye satellites”, in the amount of R$ 3,324,711.00. Contract #15/2018, to supply Planet Labs imagery to the SFB – Brazilian Forest Service, also provided web access to “[…] weekly alerts for selective logging signals ”.
Federal institutions produce geoinformation about different themes, such as agriculture, infrastructure, regional planning, environment conservation, etc. Then, this information is made available on several platforms allowing end-user to access and use it in a GIS (Kwakkel et al. Citation2014). In such a way, the ministries have developed platforms that have the same logic: to present data from a geospatial database through a Web GIS (Pimentel Citation2020; Oliveira et al. Citation2016; Hansen and Schrøder Citation2019). Thus, there is a tendency to search for business solutions based on information technology, focused on subsidizing decision making, instead of acquiring only the raw data. This paradigm shift is challenging for the industry that should present a portfolio focused on solving business problems instead of only providing raw data.
Considering the Lic indicator, Esri dominates the global market, with its products resold in Brazil exclusively by Imagem. This technology consists of a software platform that can be deployed on local computers (desktop), on the web, on servers, and mobile devices, allowing field data collection, statistical analysis, digital mapping, GIS Web development, and big data processing. According to Chatterjee et al. (Citation2016), Esri holds 43% of the global GIS market share and 70.1% of the GIS market in federal governments. Our results showed that Esri controls 47% of the Brazilian Federal market, surpassing other proprietary or free software.
Esri is a manufacturer that delivers reliable software and is recognized by academia and the professional market. About 25% of its revenue is reinvested in Research and Development (Chatterjee et al. Citation2016), designing new products and improving existing ones. By continuously evolving the ArcGIS platform, Esri has taken GIS across the borders of experts in cartography and geography, massively disseminating its spatial analysis capabilities to other markets. On the other hand, even with contracts for TerraLib (TerraView and SPRING) development and others based on open-source software, the low contracted amount for this type of service and high market share from Esri shows that the Federal Government has prioritized the purchase of ready-to-use software rather than investing in the development and customization of free software. The use of open-source GIS had been widely encouraged in the last two decades but has lost relevance in the public sector recently (Tiboni Citation2014; Câmara, and Fonseca Citation2007; Shaw Citation2011).
Dresner and Ericson (Citation2018) state that exists a worldwide trend for the governments to choose “on-premises” software licenses instead of SaaS (Software-as-a-Service) or cloud-based solutions. However, the use of APIs and Cloud Computing by the public sector has grown (Pereira et al. Citation2017; Branco, Bianchi, and Sá-Soares Citation2019; Parente et al. Citation2019; Boyd et al. Citation2020; Carvalho, Cruz Motta, and Araújo Citation2021; Costa, Ha, and Lee Citation2021). Besides Esri, which sells API and SaaS solutions, other software manufacturers also stand out in the market. Google Maps API is one of the most recognized and negotiated by the Brazilian Federal Government. Through API, the manufacturers can expose in a logical and structured way parts of their software so that developers can use them in other enterprise systems. Many applications that provide spatial data, such as service locations, navigation applications with real-time traffic, etc., are developed using this API. The Federal Government made acquisitions of these technologies, with Google being responsible for 5% of the market share. It is a smaller volume than traditional licensing but suggests a trend for the medium term (Tamiminia et al. Citation2020; Costa, Ha, and Lee Citation2021).
5.2. Public policies and geospatial technologies applications
5.2.1. Oil & Gas
39% of the federal acquisition aimed to provide geospatial technology for Oil & Gas activities and, the state-owned company Petrobras was responsible for 99.2% of this amount. The company acquired products and services referring to all market indicators, with solid demand for Rsa and GIS. Therefore, the company’s financial health is related to the national GDP (Ribeiro and Furtado Citation2014), the federal procurement process number, and purchases of geospatial technologies by the Federal Government.
In recent history, the price of international oil peaked in 2014 and then fell by almost 70%, primarily driven by the shale oil boom in the United States. In Brazil, the ratio between federal government spending on purchases of goods and services and GDP reached an average of 6.8% between 2006 and 2017 (Ribeiro and Inácio Citation2019), with Petrobras being responsible for 4.1%. In this sense, it is evident the high representation of Petrobras in the federal procurement market. However, in mid-2010, there was a significant drop in the oil company’s expenses. Such acquisitions, which represented 5.2% of GDP in 2012, fell to 2.6% in 2017 (Ribeiro and Inácio Citation2019). It is possible to relate this drop to some problems faced by the oil company, such as i) the successive net losses (mainly, but not only, due to the damming down of domestic fuel prices by the federal government, at levels below foreign market), ii) the shock in the price of oil in the second half of 2014, iii) the company’s high degree of indebtedness and, iv) and the corruption scandals in which the company was involved (Abreu et al. Citation2018; Maragno and Borba Citation2019; Lima-de-Oliveira Citation2020).
Petrobras is the primary federal acquirer of goods and services, which makes its economic instability affect the entire market. Ribeiro and Inácio (Citation2019) also detected a drop in the government purchases/GDP ratio, from 7.2% to 4.9%, between 2006 and 2017. Most of this decline coincides with the reduction in Petrobras purchases between 2016 and 2019. Therefore, we identified this trend in our results as well.
5.2.2. Infrastructure
Approximately 19% of the contracts referred to federal infrastructure initiatives. The core responsible policies for the expenses were the national road network expansion and maintenance, railway and airport construction, and telecommunications network regulation improvement.
DNIT (Ministry of Infrastructure) was the leading consumer of geospatial technologies. This institution consumed R$ 100.5 million in Rsa products and services focused on highway projects through aerophotogrammetry, collecting aerial images, and producing digital terrain and surface models. In this case, three contracts with average values in the range of R$ 33 million were responsible for the presented expenditure.
DNIT has a continuous production of data and information, which are of interest to its employees and the entire Brazilian society, and international investors. The DNIT databases are highly heterogeneous, comprising financial data, logistics studies, and engineering projects. All this data needs to be accessible and easy to use by the different stakeholders (Pereira, Caetano, and Fazan Citation2017; Costa et al. Citation2019). Our results show that DNIT also made acquisitions of software licenses (Lic) and data (Dat) to meet this need.
5.2.3. Environment and natural resources
As environmental management is a shared responsibility among almost all ministries, public actions depend on the participation of several institutions, both in formulating public policies and execution. Geoinformation and environmental policy are known linked, and most of the information used during decision-making is geospatial (Vullings, Bulens, and Walvoort Citation2014; dos Santos et al. Citation2021; Yakubailik Citation2016; Scott and Rajabifard Citation2017).
Natural resources and environment management, aiming at economic, environmental, and social sustainability, has been imperative over the last few years in Brazil. Our results show that Ministries of the Environment (IBAMA, ICMBIO and SFB) and Mines and Energy (CPRM and DNPM) were the main drivers of these expenditures.
Our results made it possible to notice that the Rural-Environmental Registry (CAR) motivated purchases of satellite images and services and thematic mapping, aiming to provide technical support for farmers and state and federal technicians. CAR is the compulsory and self-declaratory registry for rural properties, and landowners must provide georeferenced demarcation of their property’s boundaries and legally protected areas of native vegetation (Roitman et al. Citation2018; Rajão et al. Citation2020; dos Santos et al. Citation2021).
The Ministry of the Environment acquired satellite imagery from Santiago & Cintra and made it available through the Rural Environmental Registry information system (SICAR). It is archive imagery, from the years 2011, 2012, and 2014, from the RapidEye satellite, with 5 meters of spatial resolution, which can be accessed through the IBAMA’s Geocatalog or, even by download.
Another notable finding is that, under MMA management, only ICMBIO acquired GIS licenses (Lic). In return, IBAMA signed two contracts with Hex Informatica, with a total value of R $ 30.5 million for specialized labor supply. This information may indicate that IBAMA has chosen to invest in outsourced labor to develop its GIS instead of seeking ready-to-use market solutions.
CPRM and ANM lead the application of geospatial technologies for natural resource and environmental management outside the MMA structure. The mission of CPRM, which is a public company, is to generate and disseminate geoscientific knowledge and ANM, as a regulatory agency, aims to regulate, guarantee and supervise the exploration of mineral water, fossils, mining, and mining research. These two institutions purchased only GIS licenses (Lic), mainly ArcGIS, for general spatial analysis and Geosoft products, for geological modeling.
5.3. Time series analysis
The results of this work show a reduction in spending on geospatial technologies over the years. This decrease reflects what Mancebo (Citation2017), Amorim Neto (Citation2016), and Ribeiro and Inácio (Citation2019) reported when they analyzed the mid-2010 political and economic crisis and observed a retraction in federal purchases during and after the crisis.
The crisis faced by Brazil in mid-2010 brought several negative consequences for the country, including reducing public spending (Mancebo Citation2017). Throughout the President of the Republic Dilma Rousseff’s second term, which started on January 1st, 2015, Brazil has gone through several institutional crises. That year, the economy retracted 3.8%, one of the worst results in history. The nominal public deficit went from 2.97% of GDP in 2013 to 10.38% in 2015, resulting in fiscal deterioration. The unemployment rate rose from 6.2% in the last quarter of 2013 to 11.3% in the second quarter of 2016 (Amorim Neto Citation2016).
In times of crisis, countries tend to reduce public spending to accommodate a more restrictive fiscal environment or adhere to conditions imposed by international institutions when granting loans, which can negatively affect the economy, delaying the recovery (Suhrcke et al. Citation2011). The drop in GDP influences and is influenced by the reduction in society’s consumption, company investments, and government spending. A vicious circle is established in the economy, which leads to the decline in the tax collection carried out by the State. Thus, our results suggest that spending on geospatial technologies has lost priority in purchases with reduced federal spending.
The geospatial market in the Brazilian Federal Government retracted between 2011 and 2019. This result reinforces that companies have not been able to do recurring business with federal institutions. The Government has reduced the consumption of geospatial solutions, most likely due to the unfavorable economic scenario. So, the government is obliged to postpone projects or, in the case of I.T. solutions, rearrange investments toward other critical technologies, such as hardware (computers, servers, etc.) and other software, such as operating systems or software related to the routine activities of public administration.
We can discuss the results of market concentration in two different ways: i) by adding the contracts for all years and considering the total HHI of 0.082, the market is not concentrated, allowing several companies to act competitively; ii) when we analyze HHI annually, the index varies, making the market more or less concentrated in years. From 2013 to 2015, the market remained competitive, and in 2016 it returned to concentration. An explanation for this would be that more companies are hired in years with more federal resources for investments. With contingent budgetary resources, only a few companies are successful in the market throughout the crisis.
6. Conclusions
From both techniques and analysis perspectives, the main contributions of this paper are:
We explained the market dynamics over the years and provided evidence about the commercial relationship between companies and the Brazilian Federal Government.
The proposed methodology made it possible to better understand the application of Geography, combined with technologies, to plan and execute public policies in Brazil, highlighting the role of private companies. The market was decomposed into indicators and sub-indicators, adapting Zhong & Liu’s (2008) methodology.
From the Compound Annual Growth Rate, we identified a trend of market retraction after 2015. Throughout the analysis period, the market retracted by 16% per year.
Considering the entire analysis period, the HHI presented a value of 0.082, which indicates a non-concentrated market, with yearly variations
The Federal Government contracted R$ 804,747,626.99 during the analysis period. Companies such as Fototerra, Imagem, Sisgraph, Funcate, and Engemap dominate the market, providing various products and services, while MME is the primary buyer via Petrobras. Fototerra was the company that sold the most, presenting almost double the sales of Imagem, a company in the second position.
The geospatial industry serves customers who need to analyze geographic information for planning, simulating, and forecasting geographic phenomena. From this perspective, suppliers provide intermediate inputs that support the final activities of these customers. Our research allowed us to understand the market for geospatial technologies in the Federal Government and to explain its dynamics from the years 2011 to 2019, analyzing the expenditures by federal institutions, and identifying the significant projects, the leading suppliers, and the largest consumers.
In addition to MME, MI and MCTI stood out as the main buyers, with Petrobras responsible for almost 39% of purchases. The Rsa – Remote Sensing and Aerophotogrammetry indicator accounted for 50% of acquisitions, followed by GIS – Geographic Information Systems contracts, with 33% of the total. These contracts supported federal actions mainly in Oil & Gas, Infrastructure, and Environment & Natural Resources.
The years between 2011 and 2019 were profound changes for Brazil. Three presidents experienced different moments of a political and economic crisis, in addition to an impeachment process against Dilma Rousseff. The political and economic situation of the mid-2010 impacted several sectors of Brazilian society and public administration and consequently affected the geospatial industry. Simultaneously, technology has advanced, with widespread dissemination of internet access, cloud computing, and mobile telephony, bringing possibilities for the consumption of new products and extending the investment alternatives for the public sector. We expect that with private companies facilitating geoinformation access through intuitive software applications or web-based solutions, the use of geospatial technologies by nonspecialist customers will increase, warming up the market. For future work we recommend advancing this methodology to measure the social, environmental, and economic impacts of geospatial technologies, probably through a case study, and to calculate the financial return on investment for the Federal Government.
This research has contributed in an unprecedented way with a more comprehensive view of the Brazilian geospatial market. We also showed how the most different federal institutions are using remote sensing, GIS, digital cartography, surveying, and, geodesy to comply with their missions, improve social well-being, and contribute to a more developed, less unequal, and fairer country.
Disclosure statement
No potential conflict of interest was reported by the author(s).
Data availability statement
Data derived from public domain resources: The raw data that support the findings of this study are available in Portal da Transparência at https://doi.org/10.1080/10095020.2022.2094288;. Derived data supporting the findings of this study are available from the corresponding author on request.
Additional information
Notes on contributors
André Augusto Gavlak
André Augusto Gavlak received the PhD degree from Universidade de Sao Paulo (USP). His research interests include geospatial technologies, GIS, remote sensing, and business development.
Ligia Vizeu Barrozo
Ligia Vizeu Barrozo is Professor of Universidade de Sao Paulo (USP) and received the PhD degree from Universidade Estadual Paulista (USP). Her research interests include health geography, spatial statistics, and GIS.
Notes
1. Petróleo Brasileiro S.A., better known by the acronym Petrobras is a state-owned Brazilian multinational corporation in the petroleum industry headquartered in Rio de Janeiro, Brazil. The company’s name translates to Brazilian Petroleum Corporation – Petrobras. It is under the Ministry of Mines and Energy management.
References
- Abd-Elrahman, A., G. Barnes, A. Benjamin, K. Britt, B. Dewitt, H.H. Hochmair, S. Smith, and B. Wilkinson. 2019. “Geomatics Education at the University of Florida: A Case Study of Challenges and Adaptation.” Surveying and Land Information Science 78 (1): 5–16. https://www.ingentaconnect.com/content/aags/salis/2019/00000078/00000001/art00002.
- Abreu, R., F. David, L. Segura, H. Formigoni, and F. Mantovani. 2018. “Accounting for Sustainability: The Case Study of Petrobras.” In Building New Bridges Between Business and Society: Recent Research and New Cases in CSR, Sustainability, Ethics and Governance, Organized Por René and Capaldi Nicholas and Zu Liangrong Lu Hualiang and Schmidpeter, 119–134. Cham: Springer International Publishing. doi:10.1007/978-3-319-63561-3_8.
- Aina, Y.A., K.F. Aleem, M.M. Hasan, H. Alghamdi, and A. Mohamed. 2014. “Geomatics Education in the Face of Global Challenges: A Saudi Arabian Case Study.” Surveying and Land Information Science 73 (2): 81–90. https://www.ingentaconnect.com/content/aags/salis/2014/00000073/00000002/art00005.
- Akingbade, A.O., D.D. Navarra, Y. Georgiadou, and J.A. Zevenbergen. 2012. “A Case Study of Geo-ICT for E-Government in Nigeria: Does Computerization Reduce Corruption in the Provision of Land Administration Services?” Survey Review 44 (327): 290–300. doi:10.1179/1752270611Y.0000000023.
- Amani, M., A. Ghorbanian, S.A. Ahmadi, M. Kakooei, A. Moghimi, S.M. Mirmazloumi, S.H.A. Moghaddam, et al. 2020. ”Google Earth Engine Cloud Computing Platform for Remote Sensing Big Data Applications: A Comprehensive Review”. IEEE Journal of Selected Topics in Applied Earth Observations and Remote Sensing 13: 5326–5350. doi:10.1109/JSTARS.2020.3021052.
- Amorim Neto, O. 2016. “A Crise Política Brasileira de 2015-2016: Diagnóstico, Sequelas E Profilaxia [The Brazilian Political Crisis of 2015-2016: Diagnosis, Sequelae and Prophylaxis].” Relações Internacionais 52. https://iberoame.usal.es/wp-content/uploads/2018/03/Amorim-Neto52-2016.pdf.
- Assis, T.O., A.P.D. De Aguiar, C. Von Randow, D.M. De Paula Gomes, J.N. Kury, J.P.H. Ometto, and C.A. Nobre. 2020. “Co2 Emissions from Forest Degradation in Brazilian Amazon.” Environmental Research Letters 15 (10): 104035. doi:10.1088/1748-9326/ab9cfc.
- Birk, R.J., T. Stanley, G.I. Snyder, T.A. Hennig, M.M. Fladeland, and F. Policelli. 2003. “Government Programs for Research and Operational Uses of Commercial Remote Sensing Data.” Remote Sensing of Environment 88 (1): 3–16. doi:10.1016/j.rse.2003.07.007.
- Boyd, M., L. Vaccari, M. Posada Sanchez, and D. Gattwinkel. 2020. An Application Programming Interfaces (APIs) Framework for Digital Government. LU: Publications Office. doi:10.2760/772503.
- Branco, T., I. Bianchi, and F.D. Sá-Soares. 2019. “Cloud Computing Adoption in the Government Sector in Brazil: An Exploratory Study with Recommendations from IT Managers.” In Green, Pervasive, and Cloud Computing, 162–175. Cham: Springer International Publishing. doi:10.1007/978-3-030-19223-5_12.
- Brasil. 2012. Controladoria Geral da União. Portal da Transparência. http://www.portaldatransparencia.gov.br.
- Câmara, G., C. Davis, A.M.V. Monteiro, J.A. Paiva, and J. D’-Alge. 2000. Geoprocessamento: Teoria E Aplicações, 5. São José dos Campos: INPE. Cap.
- Câmara, G., and F. Fonseca. 2007. “Information Policies and Open Source Software in Developing Countries.” Journal of the American Society for Information Science and Technology 58 (1): 121–132. doi:10.1002/asi.20444.
- Câmara, G., L. Vinhas, K.R. Ferreira, G.R.D. Queiroz, R.C.M.D. Souza, A.M.V. Monteiro, et al. 2008. ”TerraLib: An Open Source GIS Library for Large-Scale Environmental and Socio-Economic Applications.” In Open Source Approaches in Spatial Data Handling, 247–270. Berlin, HeidelbergBerlin Heidelberg: Springer. doi:10.1007/978-3-540-74831-1_12.
- Canada, Alberta Office. 2011. Outlook of Taiwan GIS/GPS Industry Market. Report. https://www.albertacanada.com/taiwan/images/TaiwanIndustryOutlook.pdf
- Carvalho, L.R.D., M.A.D. Cruz Motta, and A.P.F.D. Araújo. 2021. “Performance Analysis of Main Public Cloud Big Data Services Processing Brazilian Government Data.” In High Performance Computing. Organized by Harold and Tchernykh Andrei Nesmachnow Sergio and Castro, 49–61. Cham: Springer International Publishing. doi:10.1007/978-3-030-68035-0_4.
- Chatterjee, T., A. Avery, G. Ganapathiraman, and N. Singh. 2016. “Geographic Information System: Global Market Research Study.” Market Analysis and Forecast Through 2020 - Report. Arc Advisory Group.
- Chen, G., Q. Weng, G.J. Hay, and Y. He. 2018. “Geographic Object-Based Image Analysis (GEOBIA): Emerging Trends and Future Opportunities.” GIScience & Remote Sensing 55 (2): 159–182. doi:10.1080/15481603.2018.1426092.
- Coote, A., S. Feldman, and R. McLaren. 2010. “AGI Foresight Study: The UK Geospatial Industry in 2015”. The Association for Geographic Information. May, London.
- Coppa, I., P.W. Woodgate, and Z. Mohamed-Ghouse. 2018. Global Outlook 2018: Spatial Information Industry. Melbourne: Australia and New Zealand Cooperative Research Centre for Spatial Information.
- Costa, T.C.F., D.J.F. de Campos, L.R. Perim, I.C.S. Hoffmann, and C.R.L.P. Resende. 2019. “O Uso de Geotecnologias Na Atualização da Malha Rodoviária Federal Estratégica No Departamento Nacional de Infraestrutura de Transportes – DNIT.” In 33 ANPET - Congresso de Pesquisa e Ensino em Transportes, Balneário Camboriú, SC. Proceedings of 33 ANPET.
- Costa, C., J. Ha, and S. Lee. 2021. “Spatial Disparity of Income-Weighted Accessibility in Brazilian Cities: Application of a Google Maps API.” Journal of Transport Geography 90: 102905. doi:10.1016/j.jtrangeo.2020.102905.
- Cowen, D. 2009. “The Changing Geospatial Landscape: A Report of the National Geospatial Advisory Committee.” Photogrammetric Engineering and Remote Sensing 75 (7): 747–750.
- dos Santos, P.P., W.C. de Jesus Júnior, L.A. de Almeida Telles, M.H. de Souza, S.F. da Silva, and A.R. dos Santosdos Santos. 2021. “Geotechnologies Applied to Analysis of the Rural Environmental Cadastre.” Land Use Policy 101: 105127. doi:10.1016/j.landusepol.2020.105127.
- Dresner, H., and J. Ericson. 2018. Location Intelligence Market Study (Report). Dresner Advisory Services, LLC.
- Favrin, V.G. 2009. “As Geotecnologias Como Instrumento de Gestão Territorial Integrada E Participativa.” Universidade de Sao Paulo, Agencia USP de Gestao da Informacao Academica (AGUIA). doi:10.11606/d.8.2009.tde-07122009-153514.
- Finer, M., S. Novoa, M.J. Weisse, R. Petersen, J. Mascaro, T. Souto, F. Stearns, and R.G. Martinez. 2018. “Combating Deforestation: From Satellite to Intervention.” Science 360 (6395): 1303–1305. doi:10.1126/science.aat1203.
- Fonseca, L.M., J.C.N. Epiphanio, D.M. Valeriano, J.V. Soares, J. Dalge, and M.A. Alvarenga. 2014. “Earth Observation Applications in Brazil with Focus on the CBERS Program.” IEEE Geoscience and Remote Sensing Magazine 2 (2): 53–55. doi:10.1109/MGRS.2014.2320924.
- Frontier. “Frontier Economics”. 2020. Geospatial Data Market Study: Report for the Geospatial Commission. https://assets.publishing.service.gov.uk/government/uploads/system/uploads/attachment_data/file/937025/Frontier_Economics_-_Geospatial_Data_Market_Study.pdf
- Genovese, E., G. Cotteret, S. Roche, C. Caron, and R. Feick. 2009. “Evaluating the Socio-Economic Impact of Geographic Information: A Classification of the Literature.” International Journal of Spatial Data Infrastructures Research 4 (4): 218–238. doi:10.2902/1725-0463.2009.04.art12.
- Georgiadou, Y., G. Miscione, K. Lance, and W. de Vries. 2009. “Framing the Use of Geo-Information in Government: A Tale of Two Perspectives.” Earth Science Informatics 2 (4): 271. doi:10.1007/s12145-009-0036-5.
- Georgiadou, Y., and D. Reckien. 2018. “Geo-Information Tools, Governance, and Wicked Policy Problems.” ISPRS International Journal of Geo-Information 7 (1): 21. doi:10.3390/ijgi7010021.
- Georgiadou, Y., O. Rodriguez-Pabon, and K.T. Lance. 2006. “Spatial Data Infrastructure (SDI) and E-Governance: A Quest for Appropriate Evaluation Approaches.” URISA Journal 18 (2): 43. https://link.gale.com/apps/doc/A214605865/AONE?u=anon f0f533a2&sid=googleScholar&xid=8e15dce4.
- Georgiadou, Y., and J. Stoter. 2010. “Studying the Use of Geo-Information in Government – A Conceptual Framework.” Computers, Environment and Urban Systems 34 (1): 70–78. doi:10.1016/j.compenvurbsys.2009.04.002.
- Gewin, V. 2004. “Mapping Opportunities.” Nature 427 (6972): 376–377. doi:10.1038/nj6972-376a.
- Gromyko, A., B. Balcom, R. Jungdahl, and H.Y. Wai. 2015. Strategy for a Modern Russian Remote Sensing Industry. Washington, DC, USA: International Science and Technology Policy. Elliot School of International Affairs – George Washington University.
- Gupta, R. 2000. “SWOT Analysis of Geographic Information: The Case of India.” Current Science 79 (4): 489–498. http://www.jstor.org/stable/24104427.
- Hansen, H.S., and L. Schrøder. 2019. “The Societal Benefits of Open Government Data with Particular Emphasis on Geospatial Information.” Electronic Government and the Information Systems Perspective, 31–44. doi:10.1007/978-3-030-27523-5_3.
- Harrison, T.M., and D.S. Sayogo. 2014. “Transparency, Participation, and Accountability Practices in Open Government: A Comparative Study.” Government Information Quarterly 31 (4): 513–525. doi:10.1016/j.giq.2014.08.002.
- Harvey, F., A. Iwaniak, S. Coetzee, and A.K. Cooper. 2012. “SDI Past, Present and Future: A Review and Status Assessment.” Spatial Enabling Government, Industry and Citizens. http://hdl.handle.net/10204/5909.
- Herfindahl, O.C. 1959. Copper Costs and Prices: 1870-1957. Baltimore: Published for Resources for the Future by Johns Hopkins Press.
- Holland, M. 2019. “Fiscal Crisis in Brazil: Causes and Remedy.” Brazilian Journal of Political Economy 39 (1): 88–107. doi:10.1590/0101-35172019-2918.
- Karsidi, A. 2012. “The Role of the Ina-SDI in Supporting the Development of the Geospatial Industry in Indonesia.” Geografia-Malaysian Journal of Society and Space 8 (1). http://www.ukm.edu.my/geografia/images/upload/8.geografia-jan%202012-AKarsidi_english-edited%20finalbaru1.pdf.
- Khalifa, N., and N. Abdel-Halim 2013. “An Evaluation of the GIS Industry in Egypt”. In International Conference on Information Technology and Computer Systems Engineering ITCSE, Johannesburg, South Africa.
- Kurwakumire, E. 2014. “Towards a Public Sector GIS Evaluation Methodology.” South African Journal of Geomatics 3 (1): 33–52. doi:10.10520/EJC154834.
- Kwakkel, J.H., S. Carley, J. Chase, and S.W. Cunningham. 2014. “Visualizing Geo-Spatial Data in Science, Technology and Innovation.” Technological Forecasting and Social Change 81: 67–81. doi:10.1016/j.techfore.2012.09.007.
- Lima-de-Oliveira, R. 2020. “Corruption and Local Content Development: Assessing the Impact of the Petrobras’ Scandal on Recent Policy Changes in Brazil.” The Extractive Industries and Society 7 (2): 274–282. doi:10.1016/j.exis.2019.08.004.
- Liporace, F.S. 2013. “Programação Paralela Com GPU Aplicada Ao Registro Automático de Imagens de Satélites.” Simpósio Brasileiro de Sensoriamento Remoto 16: 5978 - 5985.
- Liu, W., and W. Liu. 2015. “GIS: Advancement on Spatial Intelligence Applications in Government.” The Open Cybernetics & Systemics Journal 9 (1). doi:10.2174/1874110x01509010587.
- MacPherson, A., and V. Hartung. 2001. “A Comparison of the Industrial and Market Characteristics of Canadian and US Firms in the Commercial Geographic Information Systems (GIS) Sector.” Canadian Journal of Regional Science 24 (2): 249–268.
- Makumbi, H. 2010. “Investigating the Influence of Resource Dependencies on Compliance to National Policies of Geo-information: A Resource Dependence Perspective: a Case Study of Geo-information in Uganda”. Ph.D. Thesis, University of Twente Faculty of Geo-Information and Earth Observation (ITC).
- Mancebo, D. 2017. “Crise Político-Econômica No Brasil:Breve Análise DA Educação Superior.” Educação & Sociedade: FapUnifesp (SciElo) FapUnifesp (SciElo) 38 (141): 875–892. doi:10.1590/es0101-73302017176927.
- Maragno, L., and J.A. Borba. 2019. “Unearthing Money Laundering at Brazilian Oil Giant Petrobras.” Journal of Money Laundering Control 22 (2): 400–406. doi:10.1108/JMLC-03-2018-0027.
- Martinez, T.S., and V.D.S. Cerqueira. 2013. “Estrutura da Inflação Brasileira: Determinantes E Desagregação Do IPCA.” Economia E Sociedade 22 (2): 409–456. doi:10.1590/s0104-06182013000200005.
- Martins, P.L., and B. de Souza Véspoli. 2013. “O Portal da Transparência Como Ferramenta Para a Cidadania E O Desenvolvimento.” Revista de Administração Do UNIFATEA 6 (6): 93 - 102.
- Matos, P.D.O. 2016. “Sistemas Espaciais Voltados Para Defesa.” Mapeamento da Base Industrial de Defesa 1: 509–595.
- Moutinho, S. 2021. “First Brazilian-Made Satellite Watches the Amazon.” Science 371 (6533): 975. doi:10.1126/science.371.6533.975.
- Murthi, K.R.S. 2018. “New Paradigms for Commercial Benefits from India’s Earth Observation Activities.” New Space 6 (2): 117–124. doi:10.1089/space.2017.0021.
- Murthi, K.R.S., and M. Rao. 2017. “Demand Assessment of RS and GI in India-Opportunities for Industry Services.” 68th International Astronautical Congress (IAC) 1: 25–29.
- Nasirumbi, S. 2006. “Towards Strategy of Spatial Data Infrastructure Development with Focus on the Private Sector Involvement”. Master Thesis Presented at ITC, Netherlands.
- National Geospatial Advisory Committee. 2015. ”The Changing Geospatial Landscape: A Second Look”. National Geospatial Advisory Committee. Reston, VA. https://www.fgdc.gov/ngac/meetings/december-2015/the-changing-geospatial-landscape-second-look.pdf
- Nazário, D.C., P.F.D. Silva, and A.J. Rover. 2012. “Avaliação da Qualidade da Informação Disponibilizada No Portal da Transparência Do Governo Federal.” Revista Democracia Digital E Governo Eletrônico 6: 180 - 199.
- Noongo, E.N. 2007. “The Implementation of Geographic Information Systems in Namibia”. Ph.D. Thesis, Universidade de Joensuu – Publications in Social Sciences, Finland.
- Nunes, F., and C.R. Melo. 2017. “Impeachment, Crisis Política Y Democracia En Brasil.” Revista de Ciencia Política 37 (2): 281–304. doi:10.4067/s0718-090x2017000200281.
- O’-Sullivan, C., N. Wise, and P.P. Mathieu. 2018. “The Changing Landscape of Geospatial Information Markets.” In Earth Observation Open Science and Innovation, 3–23. Springer International Publishing. doi:10.1007/978-3-319-65633-5_1.
- Oliveira, G.A.S. 2014. ”Indicadores de Concorrência. Documentos de Trabalho 001/2014. Report from Conselho Administrativo de Defesa Econômica –CADE”. Departamento de Estudos Econômicos. Brasília.
- Oliveira, M.I.S., H.R.D. Oliveira, L.A.O. Oliveira, and B.F. Lóscio. 2016. “Open Government Data Portals Analysis: The Brazilian Case”. In Proceedings of the 17th International Digital Government Research Conference on Digital Government Research, 415–424. doi:10.1145/2912160.2912163.
- Parente, L., E. Taquary, A.P. Silva, C. Souza, and L. Ferreira. 2019. “Next Generation Mapping: Combining Deep Learning, Cloud Computing, and Big Remote Sensing Data.” Remote Sensing 11 (23): 2881. doi:10.3390/rs11232881.
- Parker, H.D. 1991. “The Role of the Private Sector in GIS.” Photogrammetric Engineering and Remote Sensing 57 (11): 1465–1466.
- Pereira, J., L. Caetano, and A.J. Fazan. 2017. “A Utilização de Uma Arquitetura Orientada a Serviço Para Integração E Acesso a Dados Geográficos Do Departamento Nacional de Infraestrutura de Transportes – DNIT.” Simpósio Brasileiro de Sensoriamento Remoto 18: 1816–1823. http://urlib.net/rep/8JMKD3MGP6W34M/3PSLPD2.
- Pereira, J., E.O. da Silva, T. Batista, F.C. Delicato, P.F. Pires, and S.U. Khan. 2017. “Cloud Adoption in Brazil.” IT Professional 19 (2): 50–56. doi:10.1109/MITP.2017.27.
- Pimentel, P. 2020. “A Governança da Geoinformação No Âmbito Do Governo Federal Do Brasil.” Revista Brasileira de Planejamento E Orçamento, Brasília 10 (1): 80–96.
- Probert, M., and A. Wolfkamp. 2003. “Survey of Key GI Players in Europe.” GINIE: Geographical Information Network in Europe 1: 173–232.
- Prodes, I.P. 2013. Monitoramento da Floresta Amazônica Brasileira Por Satélite. Vol. 25. Sao Jose dos Campos, Brazil: Inst. Nac. De Pesqui. Espac. Proj. Prodes.
- Rajão, R., B. Soares-Filho, F. Nunes, J. Börner, L. Machado, D. Assis, A. Oliveira, et al. 2020. ”The Rotten Apples of Brazil’s Agribusiness.” Science 369 (6501): 246–248. doi:10.1126/science.aba6646.
- Ribeiro, C.G., and A.T. Furtado. 2014. “Government Procurement Policy in Developing Countries: The Case of Petrobras.” Science Technology and Society 19 (2): 161–197. doi:10.1177/0971721814529874.
- Ribeiro, C.G., and E. Inácio. 2019. ”O Mercado de Compras Governamentais Brasileiro (2006-2017): Mensuração E Análise.” Brasília: Instituto de Pesquisa Econômica Aplicada. IPEA.
- Rocha, F. 2010. “Dinâmica da Concentração de Mercado Na Indústria Brasileira, 1996-2003”.” Economia E Sociedade 19: 477–498. doi:10.1590/S0104-06182010000300003.
- Roitman, I., L.C.G. Vieira, T.K.B. Jacobson, M.M. da Cunha Bustamante, N.J.S. Marcondes, K. Cury, L. Silva Estevam. 2018. ”Rural Environmental Registry: An Innovative Model for Land-Use and Environmental Policies”. Land Use Policy 76: 95–102. doi:10.1016/j.landusepol.2018.04.037.
- Rosa, R. 2005. “Geotecnologias Na Geografia Aplicada.” Revista Do Departamento de Geografia 16: 81–90. doi:10.7154/RDG.2005.0016.0009.
- Rosalen, D.L. 2014. “The Impact of the Law 10,267/2001 in the Brazilian Rural Registration.” Engenharia Agrícola 34 (2): 372–384. doi:10.1590/s0100-69162014000200018.
- Rose, L.J. 1990. “Technology Utilization: Managing the Transfer of NASA Aerospace Technology to Other Industries.” Government Information Quarterly 7 (2): 175–183. doi:10.1016/0740-624X(90)90053-Q.
- Sagan, V., K.T. Peterson, M. Maimaitijiang, P. Sidike, J. Sloan, B.A. Greeling, S. Maalouf, and C. Adams. 2020. “Monitoring Inland Water Quality Using Remote Sensing: Potential and Limitations of Spectral Indices, Bio-Optical Simulations, Machine Learning, and Cloud Computing.” Earth-Science Reviews 205: 103187. doi:10.1016/j.earscirev.2020.103187.
- Scheidegger, E., T.C.J. Carneiro, and C.A.S. Araujo. 2013. “Impactos Do Sistema de Informação Geográfica Na Administração Pública Municipal.” Revista Gestão & Tecnologia 13 (1): 3–21. doi:10.20397/2177-6652/2013.v13i1.442.
- Schwabe, C.A.2007. “The Geoinformation Industry in Africa: Prospects and Potentials”. In Proceedings of the Fourth Meeting of the Committee on Development Information (CODI IV) 2005, 23–28. Addis Ababa, Ethiopia.
- Scott, G., and A. Rajabifard. 2017. “Sustainable Development and Geospatial Information: A Strategic Framework for Integrating a Global Policy Agenda into National Geospatial Capabilities.” Geo-Spatial Information Science 20 (2): 59–76. doi:10.1080/10095020.2017.1325594.
- Shaw, A. 2011. “Insurgent Expertise: The Politics of Free/livre and Open Source Software in Brazil.” Journal of Information Technology & Politics 8 (3): 253–272. doi:10.1080/19331681.2011.592063.
- Silva, D.F., I.S. Muraoka, and E.C. Garcia. 2014. “Thermal Control Design Conception of the Amazonia-1 Satellite.” Journal of Aerospace Technology and Management 6 (2): 169–176. doi:10.5028/jatm.v6i2.320.
- Souza, F., C. Roberto, and A.P. Crósta. 2003. “Geotecnologias Aplicadas À Geologia.” Revista Brasileira de Geociências 33 (2): 1–4. doi:10.25249/0375-7536.200333S20104.
- Suhrcke, M., D. Stuckler, J.E. Suk, M. Desai, M. Senek, and M. McKee, S. Tsolova et al. 2011. ”The Impact of Economic Crises on Communicable Disease Transmission and Control: A Systematic Review of the Evidence.” Plos One 6 (6): 1–12. doi:10.1371/journal.pone.0020724.
- Tamiminia, H., B. Salehi, M. Mahdianpari, L. Quackenbush, S. Adeli, and B. Brisco. 2020. “Google Earth Engine for Geo-Big Data Applications: A Meta-Analysis and Systematic Review.” ISPRS Journal of Photogrammetry and Remote Sensing 164: 152–170. doi:10.1016/j.isprsjprs.2020.04.001.
- Tenente Ahmar, M.V., and G.A.A.D. Almeida. 2017. “Brazil: The Transparency Portal of the Federal Government.” In Digital Government: Leveraging Innovation to Improve Public Sector Performance and Outcomes for Citizens, Organized by Andrea and Silverman Michael Falk Svenja and Römmele, 129–147. Cham: Springer International Publishing. doi:10.1007/978-3-319-38795-6_7.
- Tiboni, A.C. 2014. “Software Livre Como Política de Governo”. Graduation Thesis – Especialização em Gestão Pública, Universidade Federal do Rio Grande do Sul, Porto Alegre.
- UN-GGIM. 2015. ”United Nations Committee of Experts on Global Geospatial Information Management.” In: Future Trends in Geospatial Information Management: The Five to Ten Year Vision. New York, USA: Ordnance Survey.
- Vieira, M.S. 2015. “Base Cartográfica Contínua Do Estado Do Amapá.” Revista Digital Simonsen 47: 47 - 61.
- Vullings, W., J. Bulens, and D. Walvoort. 2014. “Use of Geo-Information in Environmental Policy: Limitations, Advantages and Challenges.” International Journal of Agricultural and Environmental Information Systems 5 (1): 38–58. doi:10.4018/ijaeis.2014010103.
- Vurdubakis, T., and R. Rajão. 2020. “Envisioning Amazonia: Geospatial Technology, Legality and the (Dis) Enchantments of Infrastructure.” Environment and Planning E: Nature and Space 5 (1): 81–103. doi:10.1177/2514848619899788.
- Warren, M.S., S.W. Skillman, R. Chartrand, T. Kelton, R. Keisler, D. Raleigh, and M. Turk. 2016. “Data-Intensive Supercomputing in the Cloud: Global Analytics for Satellite Imagery”. In 2016 Seventh International Workshop on Data-Intensive Computing in the Clouds (DataCloud), 24–31. doi:10.1109/DataCloud.2016.007.
- Wood, D., and A. Weigel. 2012. “Charting the Evolution of Satellite Programs in Developing Countries – the Space Technology Ladder.” Space Policy 28 (1): 15–24. doi:10.1016/j.spacepol.2011.11.001.
- Wu, Q., and N. Li. 2016. “Research on Geographic Information Industry in Beijing — Three Cases Study.” Wireless Communication and Network. doi:10.1142/9789814733663_0029.
- Xu, Y.Q., and L. Liu. 2011. “Report on Status of Geographic Information Industry in China”. Beijing, China. Social Sciences Academic Press.
- Yakubailik, O. 2016. “Geospatial Services & Web GIS Software for Environmental Monitoring Problems”. International Multidisciplinary Scientific GeoConference: SGEM 2016: 1657–1664. Albena, Bulgaria.
- Yan, J., Y. Ma, L. Wang, K.K.R. Choo, and W. Jie. 2018. “A Cloud-Based Remote Sensing Data Production System.” Future Generation Computer Systems 86: 1154–1166. doi:10.1016/j.future.2017.02.044.
- Zhang, H., Q. Du, and C. Qiao. 2015. “Present State and Trends of the Geoinformation Industry in China.” Sustainability 7 (3): 2871–2884. doi:10.3390/su7032871.
- Zhong, E., and L. Liu. 2008. “A Study on Geospatial Industry Size in China.” The International Archives of the Photogrammetry: Remote Sensing and Spatial Information Sciences XXXVII (B4): 173 - 179.
- Zuiderwijk, A., and M. Janssen. 2014. “Open Data Policies, Their Implementation and Impact: A Framework for Comparison.” Government Information Quarterly 31 (1): 17–29. doi:10.1016/j.giq.2013.04.003.
Appendices
Appendix A
Table A1. Target companies.
Appendix B
Table B1. Target Federal Institutions.