
 ?Mathematical formulae have been encoded as MathML and are displayed in this HTML version using MathJax in order to improve their display. Uncheck the box to turn MathJax off. This feature requires Javascript. Click on a formula to zoom.
ABSTRACT
Forest Stock Volume (FSV) is one of the key indicators in forestry resource investigation and management on local, regional, and national scales. Limited by the saturation problems of optical satellite remote-sensing imagery in the retrieving of stock volume, and the high cost of Light Detection And Ranging (LiDAR) data, it is still challenging to estimate FSV in a large area using single-sensor remote-sensing data. In this paper, a method integrated multispectral satellite imagery and LiDAR data was developed to map stock volume in a large area. A random forest model was adopted to estimate the stock volume of larch forest in China based on the training samples from the Airborne Laser Scanning (ALS)-derived stock volume and corresponding Sentinel-2 imagery. Validation using National Forest Inventory (NFI) data, ALS-derived stock volume and ground investigation data demonstrated that the estimated stock volume had a high accuracy (R2 = 0.59, RMSE = 59.69 m3/ha, MD = 39.96 m3/ha when validated with NFI data; R2 ranged from 0.77 to 0.85, RMSE ranged from 38.68 m3/ha to 67.38 m3/ha, MD ranged from 24.90 m3/ha to 37.27 m3/ha when validated with ALS stock volume; R2 = 0.42, RMSE = 79.10 m3/ha, MD = 62.06 m3/ha when validated with field investigation data). Results of this paper indicated the applicability of estimating stock volume of larch forest in a large area by combining Sentinel-2 data and airborne LiDAR data.
1. Introduction
Forest Stock Volume (FSV), defined as the total volume of the stems of all living trees with height over 2 m and canopy cover more than 20% per unit forest area (m3/ha), is often used in wood fiber production, forest resource investigation and management (National Forestry Administration Citation2014). In addition, FSV is well correlated with the AboveGround Biomass (AGB) and carbon stocks (Astola et al. Citation2019; Alberdi Citation2021), which is one of the key variables reflecting the total number of forest resources in regional and national scales (Mura et al. Citation2018; Alberdi et al. Citation2020; Venäläinen et al. Citation2020; Santoro et al. Citation2015). Traditionally, FSV is estimated by sampling plots, which cost substantial manpower, materials and financial resources (Astola et al. Citation2019). Remote-sensing technology provides a feasible and flexible way to estimate FSV, and is widely used in the field of forest resources inventory. Airborne Light Detection And Ranging (LiDAR) (Hu et al. Citation2019; Chen et al. Citation2019; Tian et al. Citation2019; Coops et al. Citation2021) data measurements enable FSV inventory and monitoring in high accuracy, but airborne acquisitions are expensive, limited in temporal and spatial coverage, and usually contain some data gaps, which restricting their utility for wall-to-wall mapping of FSV in large areas (Chang et al. Citation2019; Xu et al. Citation2021). In this condition, open satellite imagery becomes appealing for FSV mapping in regional and national scales.
Developments in the earth observation in recent years increased the potential to improve the efficiency of retrieving regional or global forest attributes including stock volume. Many researches have been carried out on the estimate of FSV based on multi-scale optical remote-sensing images, such as Moderate Resolution Imaging Spectroradiometer (MODIS) (Giree et al. Citation2013; Senf et al. Citation2013; Frantz et al. Citation2016), Landsat (Griffiths et al. Citation2014; Zhu, and Woodcock Citation2014; Morresi et al. Citation2019; Hawryło et al. Citation2020; Obata et al. Citation2021), SPOT (Bochenek et al. Citation2018; Ehlers et al. Citation2018; Zhou et al. Citation2020; Huong Citation2022), and Quickbird (Abdollahnejad et al. Citation2017; Stournara, Patias, and Karamanolis Citation2017). The high spatial resolution, short revisiting period, rich spectral information, and free accessing have made Sentinel-2 images a superb data source for FSV estimation in recent years. For instance, Chrysafis et al. (Citation2017) estimated FSV based on Sentinel-2 images using the Random Forest (RF) model and found that Sentinel-2 data provided relatively better accuracy than Landsat-8 Operational Land Imager (OLI) images. Hu et al. (Citation2020) estimated FSV in Hunan Province in China by integrating in situ plot data and Sentinel-2 images using machine-learning models. Combined use of optical multispectral imagery and LiDAR data could integrate the strengths and complement the limitations of different sensors, which may acquire better accuracy and improve the applicability of the retrieving models to estimate FSV (Mauya et al. Citation2019; Coops et al. Citation2021). For example, Hawryło et al. (Citation2018) predicted FSV of Scots Pine using Sentinel-2 images and airborne point clouds from a multiple Linear regression (LR) and RF models. Chen et al. (Citation2021) mapped FSV by Global Ecosystem Dynamics Investigation (GEDI) LiDAR data, and imagery from Sentinel and ALOS, and found that point-line-polygon framework integrating LiDAR as a linear bridge to estimate FSV performed better than traditional point-polygon method. Although some attempts have been made, how to integrate the LiDAR data and multispectral satellite imagery to build a robust model to estimate FSV is still challenging.
As for the methods to estimate FSV, some researchers have shown interests in non-parametric models, such as kernel-based regression methods (Verrelst et al. Citation2019). Relying on less available data and not requesting any fixed functional form, non-parametric methods are considered to be more versatile than traditional parametric methods (Tuia et al. Citation2011). Therefore, non-parametric methods usually perform better in the description of the nonlinear relationship between the remote-sensing features and FSV. Machine-learning methods and deep-learning methods, such as RF, Support Vector Machine (SVM), Convolutional Neural Network (CNN) and Recurrent Neural Network (RNN), have also been widely used in the FSV estimation (Astola et al. Citation2019; Lang, Schindler, and Wegner Citation2019; Hu et al. Citation2020; Rees et al. Citation2021). One of the main factors affecting the accuracy of these models are the quality and quantity of the training dataset (Chen et al. Citation2021). The restricted number of field plots has limited their use in building machine-learning or deep-learning models in FSV estimation. Therefore, studies to acquire plentiful high-quality training samples, and then build a FSV estimation model with strong applicability and robustness in a large area becomes significant.
Larch forest covers about 6% of the total forest area in the world, which is about 250 million hectares (Gauthier et al. Citation2015; Gurmesa et al. Citation2022). Among which, China larch forest covers about 4% of the global larch forest area (about 10 million hectares) (National Forestry and Grassland Administration Citation2021). Some studies have been conducted to retrieve the stock volume of larch forest (Li et al. Citation2019, Citation2020; Hao et al. Citation2022), but few researches focus on the estimation of China larch FSV, which accounted for 7.42% of the total volume of China planted forest. In this case, studying the stock volume in China could provide some information for the global and China forest carbon stock.
The primary objectives of this study are to: (i) explore the possibility and applicability of estimating larch stock volume by combining Sentinel-2 data and LiDAR data in a large area; (ii) build a robust model to generate a FSV map of larch forest in China.
2. Materials and methods
2.1. Study area
Larch forests in China, with the major species of Larix gmelinii, Larix olgensis, Larix principis-rupprechtii, Larix kaempferi, are mainly distributed in northeast of China, Inner Mongolia (“Nei Mongol Zizhiqu” in ), Hebei, Xinjiang, Gansu, Sichuan and Hubei provinces in China (Shang et al. Citation2018), as shown in .
Figure 1. Verification sites and airborne flight area.
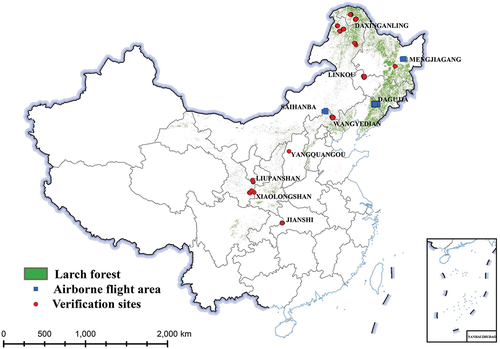
Airborne flight experiment was taken in Mengjiagang Forest Farm (130°32′ ~130°52′ E, 46°20′ ~46°30′ N), Saihanba Forest Farm (117° ~117°36′ E, 42°18′ ~42°36′ N) and Dagujia Forest Farm (124°44′ ~125°16′ E, 42°14′ ~42°27′ N). Mengjiagang Forest Farm was located in Heilongjiang province in China. Coniferous plantations (Larix gmelinii and Pinus syvestris) accounted for about two-thirds of this forest farm, while natural secondary forest accounted for about one-third of the farm. Forest coverage rate was about 81.70% in this area. Saihanba Forest Farm was the largest plantation in China, which was located in northern Hebei Province. Main tree species in this area included Larix principis-rupprechtii, Pinus syvestris, and Betula. Forest coverage rate was about 75.50% in this forest farm. Dagujia Forest Farm was located in Liaoning province in China. Coniferous plantations, such as Larix kaempferi, Pinus koraiensis, Pinus tabuliformis, and Picea asperata, were the dominant tree species in this area.
2.2. Field data
We collected some field plot data of larch FSV in typical larch distribution regions, as shown in . These plots were tallied in during 2017–2021 for multiple research purposes, as shown in . Within each plot area, diameter at breast height (DBH, where breast height = 1.30 m) were measured for all the trees of DBH over 5 cm. Tree height was measured for all the tallied trees or typical trees. The stock volume was calculated using local allometric equation (Xu, Wu, and Ye Citation2009; Doyog et al. Citation2017) for each tally tree and summarized together as the FSV of each plot. Then, the FSV density of each plot was calculated from plot size.
Table 1. Information of the field plot data.
2.3. Remote-sensing data
2.3.1. Sentinel-2 data
A pixel-based compositing algorithm (Griffiths et al. Citation2013) was adopted to generate a cloud-free and radiometrically consistent datasets from Sentinel-2 images. Three parameters, i.e. acquisition year, day of year (DOY), and distance to clouds, were taken into account and a parametric weighting scheme was used in this algorithm, which allowed for utilizing different pixel characteristics for optimized compositing. We obtained the composited reflectance of 10 bands (Blue: 458 nm–523 nm, Green: 543–578 nm; Red: 650 nm–680 nm; Vegetation red edge: 698 nm–713 nm; Vegetation red edge: 733 nm–778 nm; Vegetation red edge: 773 nm–793 nm; NIR: 785 nm–900 nm; Vegetation red edge: 855 nm–875 nm; SWIR: 1565 nm–1655 nm; SWIR: 2100 nm–2280 nm) with a spatial resolution of 20 m from Sentinel-2 data in 2020 in the growing season (from May to October) for the whole distribution area of larch forest. We also obtained the reflectance of 10 bands mentioned above in the growing season in Mengjiagang in 2017 and 2020, in Saihanba in 2018 and in Dagujia in 2018. For the three forest farms shown in , we also composited Sentinel-2 data in the year when airborne data were collected. Vegetation indexes, Normalized Difference Vegetation Index (NDVI), and Enhanced Vegetation Index (EVI) were also calculated in the growing season. NDVI and EVI were described by the following formula:
where is the reflectance of near-infrared band,
is the reflectance of red band, and
is the reflectance of blue band.
Considering that kernel NDVI (kNDVI) is more resistant to saturation, bias and complex phenological cycles, and shows better correlations than NDVI in applications of biomass estimation, kNDVI was also used as a variable to evaluate the larch stock volume (Camps-Valls et al. Citation2021). kNDVI could be described as (Camps-Valls et al. Citation2021):
,which is a length-scale parameter reflects the sensitivity of the index to sparsely or densely vegetated areas.
To evaluate accuracy of composited Sentinel-2 data, we analyzed the spectral consistency of the composited image with the realistic reference image by randomly selecting the samples, and found that a good correlation existed between them. The accuracy could be as high as 90%.
2.3.2. Stock volume maps of larch forest from airborne laser scanning data
We collected the airborne LiDAR data in Mengjiagang Forest Farm in June 2017 and September 2020, Dagujia Forest Farm in July 2018 and Saihanba Forest Farm in September 2018. The CAF-LiCHy airborne observation system, which integrated the RieglLMS-Q680i scanner, was used for the Airborne Laser Scanning (ALS) data collection (Pang et al. Citation2016). Wavelength of this system was 1550 nm, with a 3 ns pulse length and 0.5 m rad beam divergence. The max pulse repetition rate of the sensor is 400 kHz. The ALS datasets included the point density, flight time, relative flight height, and average flight speed. The point density varied from 10 pts/m2 to 35 pts/m2, the above ground flight height varied from 800 m to 1000 m, and the flight speed varied from 130 km/h to 180 km/h (Pang et al. Citation2021).
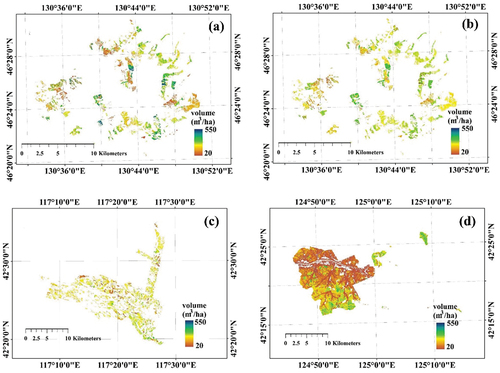
Steps to obtain the stock volume maps of larch forest from ALS data () were as follows: (1) LiDAR metrics, including height and density variables, were extracted from height normalized point cloud. Size of the cells to derive the metrics was 20 m; (2) regression models were built between the extracted metrics and the stock volume accumulated at the field plot; (3) the models were applied to areas deemed as larch forest by a tree species map so as to derive FSV raster map for larch forest. Stock volume in 70% field plots was used to train the regression models in Mengjiagang, Saihanba, and Dagujia, respectively. Cross-validation with the stock volume in the rest 30% field plots demonstrated that the stock volume map from ALS data had high accuracy (R2 ranged from 0.76 to 0.95, RMSE ranged from 32.66 m3/ha to 65.40 m3/ha).
Figure 2. Larch stock volume from ALS data.
2.3.3. Larch forest map in China
Multi-temporal Landsat 8 images in 2020, Digital Elevation Model (DEM), forest resource investigation data were applied in the classification process using the RF, SVM, and neural network. Spectral features (reflectance, NDVI and EVI), textural features (variance, average value, angular second moment, contrast, homogeneity, dissimilarity, correlation and entropy) of larch forest were derived from the multi-temporal Landsat images, and terrain features (slope and aspect) were derived from DEM. Then, Gini coefficient was used to select the main characteristic factors from those features, which were used to train the machine-learning models. Validation with the investigation data in Daxing'anling and Heilongjiang showed that accuracy of larch forest classification map was higher than 70% (Ministry of Science and Technology of China, Citation2021).
3. Methods
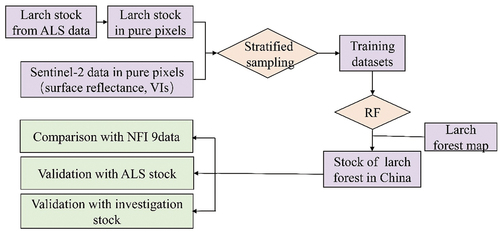
A method integrating multispectral Sentinel-2 imagery and LiDAR data was developed to map stock volume in China. Flowchart of larch stock volume estimation was demonstrated in . The ALS-derived stock volume of larch forest was used as a bridge to relate field plots and full-cover Sentinel-2 multispectral imagery. Firstly, the training datasets were obtained from the homogeneous ALS stock volume and corresponding Sentinel-2 pixels (surface reflectance, vegetation indexes) using a stratified sampling method. The Sentinel-2 data were consistent with the year when the airborne data flew. Then, an RF model was adopted to estimate the stock volume map in China. At last, the results were validated using ALS-derived stock volume and ground investigation data.
Figure 3. Flowchart of larch stock estimation from Sentinel-2 and LiDAR data.
3.1. Estimation of larch stock volume in China from Sentinel-2 data
To obtain some high-quality samples to train the machine-learning model, homogeneous pixels were selected using the coefficients of variation of ALS-derived stock volume in 100 m × 100 m pixels. The coefficient of variation was defined as the ratio of the standard deviation to the mean value in the 100 m × 100 m pixel. The 100 m × 100 m pixels with the minimum 20% coefficient of variation in each forest farm (Mengjiagang, Saihanba and Dagujia) were selected as the pure pixels. In this paper, the coefficient of variation to define pure pixels was 0.42 (in Mengjiagang in 2017), 0.40 (in Mengjiagang in 2020), 0.35 (in Saihanba), 0.38 (in Dagujia), respectively. Then, the training datasets were built based on the ALS-derived stock volume in Mengjiagang, Dagujia, Saihanba and corresponding surface reflectance of 10 bands (band2, band3, band4, band5, band6, band7, band8,band8A,ban11, and band12) and vegetation indexes (NDVI, EVI, and kNDVI) from Sentinel-2 data in the homogeneous pixels. Noting that the surface reflectance and vegetation indexes from Sentinel-2 data in the homogeneous pixels were also aggregated to 100 m × 100 m pixels. To resist the saturation of machine-learning models and obtain high accuracy when the larch stock volume in high values, logarithms were used in the ALS-derived stock volume. Specifically, log(FSV) was used as the response variable and then back-transformed the output. To make the training datasets more representative, a stratified sampling method was adopted in this paper according to the ALS-derived stock volume. Stratum number is 6 according to the ASL ALS FSV. To make a cross-validation, 70% of the pure pixels was used to train the model, and the rest 30% of the pure pixels was used to validate the model. As RF has been extensively used in forest parameter mapping from remote-sensing data and has achieved good accuracy by comparative assessments due to being less sensitive to noise in training samples (Zhao et al. Citation2019; Chen et al. Citation2021), the RF model was used in our research to estimate the stock volume based on the Sentinel-2 data (surface reflectance, vegetation indexes) at the original 20 m resolution. At last, the map of larch stock volume was obtained based on the larch forest mask in China.
3.2. Validation of the larch stock volume from remote sensing data
To assess the accuracy of the Sentinel-2-derived stock volume of larch forest in China, first, we compared the average growing stock in each province with the provincial National Forest Inventory (NFI) 9 stock volume. Then, the results were compared with corresponding ALS-derived stock volume pixel by pixel at Mengjiagang, Dagujia, and Saihanba. Besides, the estimated stock volume was also validated against the ground investigation data. Noting that the mean stock volume values in a 5 pixels *5 pixels window around each field plot were used to compare with the ground investigated data to reduce the co-registration errors between images and field plot sites. The coefficient of determination (R2) and root-mean-square error (RMSE) were used to quantify the accuracy of the stock volume of larch forest from remote-sensing data, and the Mean Difference (MD) (Valbuena et al. Citation2017) was used to evaluate the degree of under or over prediction of the results.
4. Results
4.1. Larch stock map in China
A cross-validation method was used to validate the estimated FSV of larch forest from RF model, which was shown in . High accuracy (R2 = 0.84, RMSE = 54.68 m3/ha, MD = 30.54 m3/ha) was obtained when validated with ALS stock volume, which indicate that the model had a good stability and applicability. Map of stock volume of larch forest in China is shown in . Generally, larch stock volume was high (more than 200 m3/ha) at northeastern areas in China, such as Daxing'anling and Xiaoxing'anling areas, while the larch stock volume was low in the central part of China, such as Hubei province. Total area of larch forest in China was about 2.18 × 10⁷ ha, and the total stock volume of larch forest in China was about 2.76 × 10⁹ m3.
Figure 4. Accuracy of the larch stock estimation model.
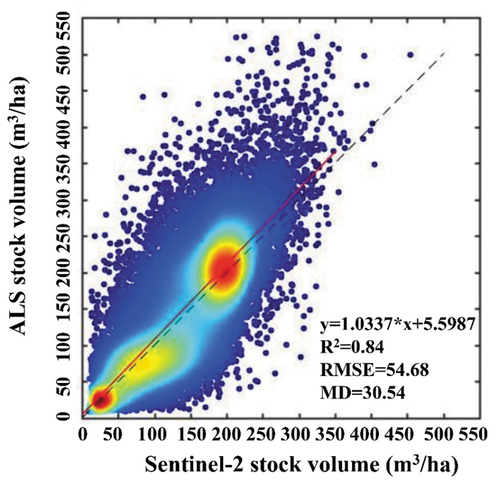
Figure 5. Larch stock map in China from Sentinel-2 data.
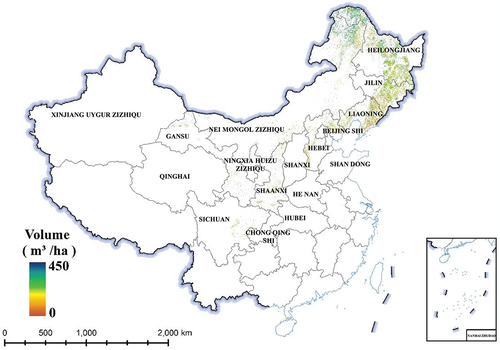
In Xinjiang, Heilongjiang, and Inner Mongolia, stock volume of larch forest derived from Sentinel-2 was more than 140 m3/ha, which were the highest. Followed by Jilin, Beijing, Hebei, Shanxi, and Hubei with the larch FSV ranging from 100 m3/ha to 120 m3/ha. In Chongqing, Qinghai, Gansu, Henan, and Shandong, the larch FSV were less than 90 m3/ha.
4.2. Validation of the larch stock volume
4.2.1. Validation with national forest inventory data
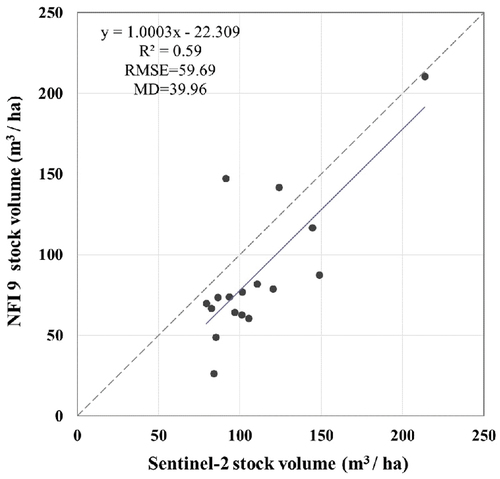
We compared the provincial Sentinel-2 stock volume with the provincial NFI 9 stock volume, as shown in . A good linear relationship existed between the NFI 9 stock volume per hectare and the Sentinel-2 stock volume per hectare (R2 = 0.59, RMSE = 59.69 m3/ha, MD = 39.96 m3/ha). But we could also find that larch stock volume from Sentinel-2 data was overestimated when the NFI 9 volume was less than 100 m3/ha. A relative lower relationship existed between the Sentinel-2 volume and the NFI 9 volume. Reason leading to this may be the errors of larch forest area from remote-sensing data.
Figure 6. Comparison of the provincial volume per hectare.
4.2.2. Validation with ALS stock volume
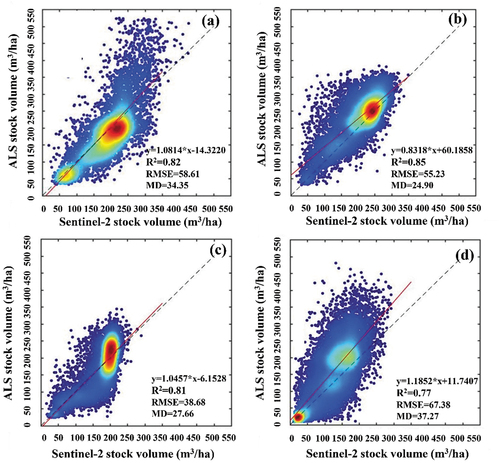
We compared the Sentinel-2-derived stock volume of larch forest with corresponding ALS-derived stock volume pixel by pixel (stock volume from Sentinel-2 data and from ALS data were aggregated to 100 m × 100 m) in Mengjiagang, Dagujia, and Saihanba, as shown in . In general, a good linear relationship exists between Sentinel-2-derived stock volume and ALS-derived stock volume (R2 ranged from 0.77 to 0.85, and RMSE ranged from 38.68 m3/ha to 67.38 m3/ha, MD ranged from 24.90 m3/ha to 37.27 m3/ha), indicating that a Sentinel-2-derived larch stock volume achieved a high accuracy in Mengjiagang, Dagujia, and Saihanba.
Figure 7. Validation with ALS larch stock. (a) Mengjiagang 2017; (b) Mengjiagang 2020; (c) Saihanba 2018; (d) Dagujia 2018.
4.2.3. Validation with field investigation data
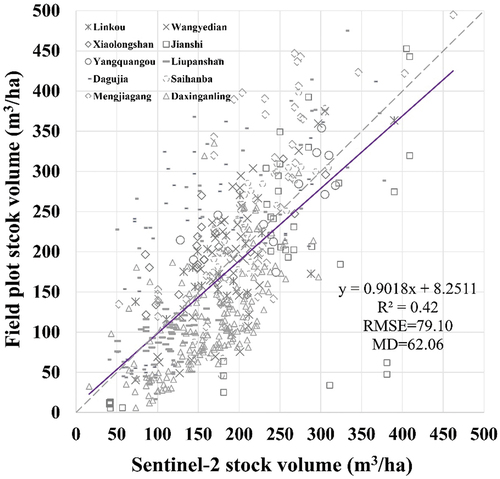
Validation with the ground investigated larch stock volume shown that the Sentinel-2-derived larch stock volume had a high accuracy (R2 = 0.42, RMSE = 79.10 m3/ha, MD = 62.06 m3/ha) (). However, we could find that most of the plots were distributed above the 1:1 line when the ground measurement stock volume was less than 200 m3/ha, indicating that the larch stock volume from Sentinel-2 data was overestimated. While most plots were located under the 1:1 line when the ground investigated stock volume was higher than 200 m3/ha, which demonstrate that Sentinel-2 derived stock volume of larch forest was underestimated.
Figure 8. Validation with field investigated field plot stock volume data.
5. Discussion
5.1. Advantages of integrating LiDAR data and satellite data to estimate FSV
Compared to traditional stock volume modeling approaches directly related to sample plot data with satellite data, integrating airborne LiDAR data and Sentinel-2 satellite images to derive stock volume has some advantages. Specifically, maps of stock volume derived from airborne LiDAR data acted as a link bridge to relate field plots and full-cover Sentinel-2 multispectral imagery, which could greatly enrich the training datasets to build the machine-learning models. The relative error of traditional point-polygon method which directly related to sample plot data with satellite data was about 20% to 40% (Immitzer et al. Citation2016; Xu, Manley, and Morgenroth Citation2018; Dos Reis et al. Citation2019; Liu, Wang, and Wang Citation2019; Hawryło et al. Citation2020), while the relative error was less than 30% of this paper, indicating the applicability and feasibility of mapping larch stock volume in a large area by combining Sentinel-2 data and LiDAR data.
5.2. Influence of data saturation problem on FSV estimation
The data saturation problem of Sentinel-2 images may have some effects on the accuracy of the estimated FSV. Studies have indicated that the spectral reflectance of satellite images tend to be saturated and become less sensitive to high FSV due to the complex forest canopy structure in dense vegetation (Hu et al. Citation2020; Li et al. Citation2021), which would result in the underestimation of satellite-derived FSV. The application of various vegetation indexes, especially the indexes related to red edge, has the ability to overcome the saturation problem and increases the accuracy of estimated FSV (Frampton et al. Citation2013; Nuthammachot et al. Citation2022). In our research, reflectance of three red edge bands (698 nm–713 nm, 733 nm–78 nm, 773 nm–793 nm) was also used to train the machine-learning model. Besides, a new vegetation index kNDVI, which was believed to be more resistant to saturation and complex canopy structure (Camps-Valls et al. Citation2021), was also adopted to improve the performance of machine-learning model in the high FSV estimation to some extent.
Another way to mitigate the data saturation problem was the application of stratification approaches (Zhao et al. Citation2016). But it was still challenging to collect sufficient number of samples in each stratum in the traditional methods. In this paper, the ALS-derived FSV was used to train the sample, which could increase the number of samples effectively. In the future, the stratified sampling strategy may be improved to reduce the impact of data saturation problem in FSV mapping.
5.3. Influence of compositing algorithm of Sentinel-2 images on FSV estimation
Satellite images for large-scale mapping of tree species or relevant parameters should not only rely on single high-quality cloud-free images, but also should be supported by seasonal composites of multi-images (Kollert et al. Citation2021). Studies have demonstrated that seasonal Sentinel-2 data are often used for temporal composites and land surface phenology, which could be as the inputs of machine-learning model (Kollert et al. Citation2021; Shen et al. Citation2021). The composites used in this paper were based on the growing season (from May to October) Sentinel-2 images, and a pixel-based compositing algorithm (Griffiths et al. Citation2013) which was applicable for integrating different pixel characteristics for optimized compositing. Cloud free and radiometrically consistent datasets could be obtained although the data acquired time was mixed. But the accuracy may be influenced when the image was far from the center time of the growing season, which may bring some errors in the compositing, and to the subsequent FSV estimation.
5.4. Limitations and future work
Errors of the training datasets and the limitation of RF model would bring some uncertainties to the results. First, the quality and accuracy of training samples were well related to the performance of RF model. In this paper, the training samples were obtained from the pure pixels from ALS larch stock volume map and corresponding Sentinel-2 data,and the errors of ALS larch stock map would have some influence on the accuracy of the results. To improve this, we may develop some methods to derive stock volume map with higher accuracy with LiDAR data, or to select more representative training samples in the future. Second, the selection of the variables may impact the results of RF model. In this paper, reflectance of 10 Sentinel-2 bands and VIs was used as the independent variables of the RF model. We may enrich the kinds of variables, such as spectral features, textural features, and topographic features, and analyze the of the importance of several kinds of variables to avoid overfitting and to build more robust machine-learning models to estimate FSV. Third, errors in the classification of larch forest would bring some uncertainty when validating with NFI data. Finally, limitations of the RF model may also lead to some errors of the results. More validation work may be carried out to assess the larch forest map used in this paper. Studies have demonstrated that overestimation in the low values and the underestimation in the high values was a common problem in the estimation of FSV or biomass from RF model using multispectral remote-sensing data (Ou et al. Citation2019; Zhang et al. Citation2019; Hu et al. Citation2020; Li et al. Citation2020). In the future, some deep-learning methods based on multiple optical remote-sensing data and LiDAR data may be used, and the parameters of the deep-learning models could be optimized to improve the accuracy.
6. Conclusions
In this paper, a method of integrating airborne LiDAR data and Sentinel-2 satellite images was developed to estimate stock volume of larch forest in China. LiDAR-derived stock volume of larch forest acted as a link to relate field plots and Sentinel-2 multispectral imagery. A machine-learning model with high accuracy was built to map the stock volume of larch forest in China based on the LiDAR-derived stock volume and corresponding Sentinel-2 data in the pure pixels. Comparison with the NFI 9 provincial data, with ALS stock volume, with field investigation data demonstrated that the Sentinel-2 stock volume gained a high accuracy. Results of this paper indicated that combining Sentinel-2 data and airborne LiDAR data could greatly enrich the training datasets and improve the accuracy of machine-learning models of stock volume estimation.
Disclosure statement
No potential conflict of interest was reported by the author(s).
Data availability statement
Sentinel-2 data used in this paper are available at https://doi.org/10.1080/10095020.2022.2105754. The stock volume map of larch forest in China is available at https://doi.org/10.1080/10095020.2022.2105754.
Additional information
Funding
Notes on contributors
Tao Yu
Tao Yu received PhD degree of cartography geographic information system from Beijing Normal University in 2019. He is currently a research assistant at Institute of Forest Resource Information Techniques, Chinese Academy of Forestry. His research interests include remote-sensing modeling and applications in forestry, scale effects, and scaling methods in remote-sensing.
Yong Pang
Yong Pang received PhD degree of cartography and geographic information system from the Institute of Remote-Sensing Applications, Chinese Academy of Science in 2006. He is currently a professor at the Institute of Forest Resource Information Techniques, Chinese Academy of Forestry. His research interests include LiDAR remote-sensing and applications in forestry, data fusion for forest parameters estimation, forest change, and carbon mapping.
Xiaojun Liang
Xiaojun Liang is currently working toward the PhD degree of forestry at Institute of Forest Resource Information Techniques, Chinese Academy of Forestry. His research interests include applications of LiDAR remote-sensing in forestry.
Wen Jia
Wen Jia is currently a research assistant at Institute of Forest Resource Information Techniques, Chinese Academy of Forestry. His research interests include hyperspectral remote-sensing and classification methods.
Yu Bai
Yu Bai is currently working toward the PhD degree of forestry at Institute of Forest Resource Information Techniques, Chinese Academy of Forestry. Her research interests include forest biomass estimation and forest progress model.
Yilin Fan
Yilin Fan is currently working for the M.S. degree at Institute of Forest Resource Information Techniques, Chinese Academy of Forestry. Her research interests include classification methods in remote-sensing.
Dongsheng Chen
Dongsheng Chen received the PhD degree in forest management from Northeast Forestry University, Haerbin, China in 2010. He is currently an associate professor at Research Institute of Forestry, Chinese Academy of Forestry. His research interests include forest cultivation and management.
Xianzhao Liu
Xianzhao Liu is an associate professor at Institute of Forest Resource Information Techniques, Chinese Academy of Forestry. His research interests include forest management.
Guang Deng
Guang Deng received the PhD degree of forest management from Institute of Remote-Sensing Applications, Chinese Academy of Forestry in 2009. He is currently an associate professor at Institute of Forest Resource Information Techniques, Chinese Academy of Forestry. His research interests include big data technology in applications of remote-sensing and forestry.
Chonggui Li received the PhD degree of forest management from Institute of Forest Resource Information Techniques, Chinese Academy of Forestry in 2001. He is currently a professor at College of Geomatics, Xi’an University of Science and Technology.
Chonggui Li
Chonggui Li received the PhD degree of forest management from Institute of Forest Resource Information Techniques, Chinese Academy of Forestry in 2001. He is currently a professor at College of Geomatics, Xi’an University of Science and Technology.
Xiangnan Sun
Xiangnan Sun is currently working toward the PhD degree of forestry at Institute of Forest Resource Information Techniques, Chinese Academy of Forestry. His research interests include inventory methods of forest resources.
Zhidong Zhang
Zhidong Zhang received the PhD degree of forest ecology from Institute of Forest Ecology, Environment and protection, Chinese Academy of Science in 2007. He is currently an associate professor at College of Forestry, Hebei Agricultural University. His research interests include forest management and landscape dynamics.
Weiwei Jia
Weiwei Jia received the PhD degree of forest management from Northeast Forestry University in 2006. He is currently a professor at College of Forestry, Northeast Forestry University. His research interests include forest management and forest growth and yield models.
Zhonghua Zhao
Zhonghua Zhao received the PhD degree of forest cultivation from Chinese Academy of Forestry in 2009. He is currently an associate research fellow at Research Institute of Forestry, Chinese Academy of Forestry. His research interests include forest management and forest structure dynamics.
Xiao Wang
Xiao Wang received the PhD degree of soil and water conservation from Beijing Forestry University in 2016. His research interests include forest hydrological impact, interaction of forest and water, eco-hydrology at different scales, in north and particularly the northwest dryland region of China.
References
- Abdollahnejad, A., D. Panagiotidis, S. Shataee Joybari, and P. Surový. 2017. “Prediction of Dominant Forest Tree Species Using Quickbird and Environmental Data.” Forests 8 (2): 42. doi:10.3390/f8020042.
- Alberdi, I. 2021. “Forest Resources Assessments: Mensuration, Inventory and Planning.” Forests 12 (3): 296. doi:10.3390/f12030296.
- Alberdi, I., S. Bender, T. Riedel, V. Avitable, O. Boriaud, M. Bosela, A. Camia, et al. 2020. “Assessing Forest Availability for Wood Supply in Europe.” Forest Policy and Economics 111: 102032. doi:10.1016/j.forpol.2019.102032.
- Astola, H., T. Häme, L. Sirro, M. Molinier, and J. Kilpi. 2019. “Comparison of Sentinel-2 and Landsat 8 Imagery for Forest Variable Prediction in Boreal Region.” Remote Sensing of Environment 223: 257–273. doi:10.1016/j.rse.2019.01.019.
- Bochenek, Z., D. Ziolkowski, M. Bartold, K. Orlowska, and A. Ochtyra. 2018. “Monitoring Forest Biodiversity and the Impact of Climate on Forest Environment Using High-Resolution Satellite Images.” European Journal of Remote Sensing 51 (1): 166–181. doi:10.1080/22797254.2017.1414573.
- Camps-Valls, G., M. Campos-Taberner, Á. Moreno-Martínez, S. Walther, G. Duveiller, A. Cescatti, M.D. Mahecha, et al. 2021. “A Unified Vegetation Index for Quantifying the Terrestrial Biosphere.” Science Advances 7 (9): eabc7447. doi:10.1126/sciadv.abc7447.
- Chang, T., B.P. Rasmussen, B.G. Dickson, and L.J. Zachmann. 2019. “Chimera: A Multi-Task Recurrent Convolutional Neural Network for Forest Classification and Structural Estimation.” Remote Sensing 11 (7): 768. doi:10.3390/rs11070768.
- Chen, B., Y. Pang, Z. Li, P. North, J. Rosette, G. Sun, J. Suárez, L. Bye, and H. Lu. 2019. “Potential of Forest Parameter Estimation Using Metrics from Photon Counting LiDar Data in Howland Research Forest.” Remote Sensing 11 (7): 856. doi:10.3390/rs11070856.
- Chen, L., C. Ren, B. Zhang, Z. Wang, M. Liu, W. Man, and J. Liu. 2021. “Improved Estimation of Forest Stand Volume by the Integration of GEDI LiDar Data and Multi-Sensor Imagery in the Changbai Mountains Mixed Forests Ecoregion (CMMFE), Northeast China.” International Journal of Applied Earth Observation and Geoinformation 100: 102326. doi:10.1016/j.jag.2021.102326.
- Chrysafis, I., G. Mallinis, S. Siachalou, and P. Patias. 2017. “Assessing the Relationships Between Growing Stock Volume and Sentinel-2 Imagery in a Mediterranean Forest Ecosystem.” Remote Sensing Letters 8 (6): 508–517. doi:10.1080/2150704X.2017.1295479.
- Coops, N.C., P. Tompalski, T.R. Goodbody, M. Queinnec, J.E. Luther, D.K. Bolton, J.K. White, M.A. Wulder, O.R. Lier, and T. Hermosilla. 2021. “Modelling Lidar-Derived Estimates of Forest Attributes Over Space and Time: A Review of Approaches and Future Trends.” Remote Sensing of Environment 260: 112477. doi:10.1016/j.rse.2021.112477.
- Dos Reis, A.A., S.E. Franklin, J.M. de Mello, and F.W. Acerbi Junior. 2019. “Volume Estimation in a Eucalyptus Plantation Using Multi-Source Remote Sensing and Digital Terrain Data: A Case Study in Minas Gerais State, Brazil.” International Journal of Remote Sensing 40 (7): 2683–2702. doi:10.1080/01431161.2018.1530808.
- Doyog, N.D., Y.J. Lee, S.J. Lee, J.T. Kang, and S.Y. Kim. 2017. “Compatible Taper and Stem Volume Equations for Larix Kaempferi (Japanese Larch) Species of South Korea.” Journal of Mountain Science 14 (7): 1341–1349. doi:10.1007/s11629-016-4291-x.
- Ehlers, S., S. Saarela, N. Lindgren, E. Lindberg, M. Nyström, H.J. Persson, H. Olsson, and G. Ståhl. 2018. “Assessing Error Correlations in Remote Sensing-Based Estimates of Forest Attributes for Improved Composite Estimation.” Remote Sensing 10 (5): 667. doi:10.3390/rs10050667.
- Frampton, W.J., J. Dash, G. Watmough, and E.J. Milton. 2013. “Evaluating the Capabilities of Sentinel-2 for Quantitative Estimation of Biophysical Variables in Vegetation.” ISPRS Journal of Photogrammetry and Remote Sensing 82: 83–92. doi:10.1016/j.isprsjprs.2013.04.007.
- Frantz, D., A. Röder, T. Udelhoven, and M. Schmidt. 2016. “Forest Disturbance Mapping Using Dense Synthetic Landsat/modis Time-Series and Permutation-Based Disturbance Index Detection.” Remote Sensing 8 (4): 277. doi:10.3390/rs8040277.
- Gauthier, S., P. Bernier, T. Kuuluvainen, A.Z. Shvidenko, and D.G. Schepaschenko. 2015. “Boreal Forest Health and Global Change.” Science 349 (6250): 819–822. doi:10.1126/science.aaa9092.
- Giree, N., S.V. Stehman, P. Potapov, and M.C. Hansen. 2013. “A Sample-Based Forest Monitoring Strategy Using Landsat, AVHRR and MODIS Data to Estimate Gross Forest Cover Loss in Malaysia Between 1990 and 2005.” Remote Sensing 5 (4): 1842–1855. doi:10.3390/rs5041842.
- Griffiths, P., T. Kuemmerle, M. Baumann, V.C. Radeloff, I.V. Abrudan, J. Lieskovsky, C. Munteanu, K. Ostapowicz, and P. Hostert. 2014. “Forest Disturbances, Forest Recovery, and Changes in Forest Types Across the Carpathian Ecoregion from 1985 to 2010 Based on Landsat Image Composites.” Remote Sensing of Environment 151: 72–88. doi:10.1016/j.rse.2013.04.022.
- Griffiths, P., S. van der Linden, T. Kuemmerle, and P. Hostert. 2013. “A Pixel-Based Landsat Compositing Algorithm for Large Area Land Cover Mapping.” IEEE Journal of Selected Topics in Applied Earth Observations and Remote Sensing 6 (5): 2088–2101. doi:10.1109/JSTARS.2012.2228167.
- Gurmesa, G.A., A. Wang, S. Li, S. Peng, W. de Vries, P. Gundersen, P. Ciais, et al. 2022. “Retention of Deposited Ammonium and Nitrate and Its Impact on the Global Forest Carbon Sink.” Nature Communications 13 (1): 1–9. doi:10.1038/s41467-022-28345-1.
- Hao, Y., F.R.A. Widagdo, X. Liu, Y. Quan, Z. Liu, L. Dong, and F. Li. 2022. “Estimation and Calibration of Stem Diameter Distribution Using UAV Laser Scanning Data: A Case Study for Larch (Larix Olgensis) Forests in Northeast China.” Remote Sensing of Environment 268: 112769. doi:10.1016/j.rse.2021.112769.
- Hawryło, P., B. Bednarz, P. Wężyk, and M. Szostak. 2018. “Estimating Defoliation of Scots Pine Stands Using Machine Learning Methods and Vegetation Indices of Sentinel-2.” European Journal of Remote Sensing 51 (1): 194–204. doi:10.1080/22797254.2017.1417745.
- Hawryło, P., S. Francini, G. Chirici, F. Giannetti, K. Parkitna, G. Krok, K. Mitelsztedt, et al. 2020. “The Use of Remotely Sensed Data and Polish NFI Plots for Prediction of Growing Stock Volume Using Different Predictive Methods.” Remote Sensing 12 (20): 3331. doi:10.3390/rs12203331.
- Hu, Y., F. Wu, Z. Sun, A. Lister, X. Gao, W. Li, and D. Peng. 2019. “The Laser Vegetation Detecting Sensor: A Full Waveform, Large-Footprint, Airborne Laser Altimeter for Monitoring Forest Resources.” Sensors 19 (7): 1699. doi:10.3390/s19071699.
- Hu, Y., X. Xu, F. Wu, Z. Sun, H. Xia, Q. Meng, W. Huang, et al. 2020. “Estimating Forest Stock Volume in Hunan Province, China, by Integrating in situ Plot Data, Sentinel-2 Images, and Linear and Machine Learning Regression Models.” Remote Sensing 12 (1): 186. doi:10.3390/rs12010186.
- Huong, N.T.T. 2022. “Quantify Forest Stand Volume Using SPOT 5 Satellite Image.” In Global Changes and Sustainable Development in Asian Emerging Market Economies, edited by A. T. Nguyen and L. Hens, Vol. 2, 659–670. Cham: Springer.
- Immitzer, M., C. Stepper, S. Böck, C. Straub, and C. Atzberger. 2016. “Use of WorldView-2 Stereo Imagery and National Forest Inventory Data for Wall-To-Wall Mapping of Growing Stock.” Forest Ecology and Management 359: 232–246. doi:10.1016/j.foreco.2015.10.018.
- Kollert, A., M. Bremer, M. Löw, and M. Rutzinger. 2021. “Exploring the Potential of Land Surface Phenology and Seasonal Cloud Free Composites of One Year of Sentinel-2 Imagery for Tree Species Mapping in a Mountainous Region.” International Journal of Applied Earth Observation and Geoinformation 94: 102208. doi:10.1016/j.jag.2020.102208.
- Lang, N., K. Schindler, and J.D. Wegner. 2019. “Country-Wide High-Resolution Vegetation Height Mapping with Sentinel-2.” Remote Sensing of Environment 233: 111347.
- Li, Y., C. Li, M. Li, Z. Liu, and A. Elbe-Bürger. 2020. “Forest Aboveground Biomass Estimation Using Landsat 8 and Sentinel-1A Data with Machine Learning Algorithms.” Scientific Reports 10 (1): 1–12. doi:10.1038/s41598-019-56847-4.
- Li, X., Z. Liu, H. Lin, G. Wang, H. Sun, J. Long, and M. Zhang. 2020. “Estimating the Growing Stem Volume of Chinese Pine and Larch Plantations Based on Fused Optical Data Using an Improved Variable Screening Method and Stacking Algorithm.” Remote Sensing 12 (5): 871. doi:10.3390/rs12050871.
- Li, X., J. Long, M. Zhang, Z. Liu, and H. Lin. 2021. “Coniferous Plantations Growing Stock Volume Estimation Using Advanced Remote Sensing Algorithms and Various Fused Data.” Remote Sensing 13 (17): 3468. doi:10.3390/rs13173468.
- Li, G., Z. Xie, X. Jiang, D. Lu, and E. Chen. 2019. “Integration of ZiYuan-3 Multispectral and Stereo Data for Modeling Aboveground Biomass of Larch Plantations in North China.” Remote Sensing 11 (19): 2328. doi:10.3390/rs11192328.
- Liu, J., X. Wang, and T. Wang. 2019. “Classification of Tree Species and Stock Volume Estimation in Ground Forest Images Using Deep Learning.” Computers and Electronics in Agriculture 166: 105012. doi:10.1016/j.compag.2019.105012.
- Mauya, E.W., J. Koskinen, K. Tegel, J. Hämäläinen, T. Kauranne, and N. Käyhkö. 2019. “Modelling and Predicting the Growing Stock Volume in Small-Scale Plantation Forests of Tanzania Using Multi-Sensor Image Synergy.” Forests 10 (3): 279. doi:10.3390/f10030279.
- Ministry of Science and Technology of China. 2021. Report of National Key Research and Development Program: Growth Prediction of Multi-Scale Larch Plantation. Beijing: Ministry of Science and Technology of China.
- Morresi, D., A. Vitali, C. Urbinati, and M. Garbarino. 2019. “Forest Spectral Recovery and Regeneration Dynamics in Stand-Replacing Wildfires of Central Apennines Derived from Landsat Time Series.” Remote Sensing 11 (3): 308. doi:10.3390/rs11030308.
- Mura, M., F. Bottalico, F. Giannetti, R. Bertani, R. Giannini, M. Mancini, S. Orlandini, D. Travaglini, and G. Chirici. 2018. “Exploiting the Capabilities of the Sentinel-2 Multi Spectral Instrument for Predicting Growing Stock Volume in Forest Ecosystems.” International Journal of Applied Earth Observation and Geoinformation 66: 126–134. doi:10.1016/j.jag.2017.11.013.
- National Forestry Administration. 2014. Technical Regulations for Continuous Forest Inventory. Beijing: Standards Press of China.
- National Forestry and Grassland Administration. 2021. China Forestry and Grassland Statistical Yearbook 2020. Beijing: China Forestry Publishing House.
- Nuthammachot, N., A. Askar, D. Stratoulias, and P. Wicaksono. 2022. “Combined Use of Sentinel-1 and Sentinel-2 Data for Improving Above-Ground Biomass Estimation.” Geocarto International 37 (2): 366–376. doi:10.1080/10106049.2020.1726507.
- Obata, S., C.J. Cieszewski, R.C. Lowe, and P. Bettinger. 2021. “Random Forest Regression Model for Estimation of the Growing Stock Volumes in Georgia, USA, Using Dense Landsat Time Series and FIA Dataset.” Remote Sensing 13 (2): 218. doi:10.3390/rs13020218.
- Ou, G., C. Li, Y. Lv, A. Wei, H. Xiong, H. Xu, and G. Wang. 2019. “Improving Aboveground Biomass Estimation of Pinus Densata Forests in Yunnan Using Landsat 8 Imagery by Incorporating Age Dummy Variable and Method Comparison.” Remote Sensing 11 (7): 738. doi:10.3390/rs11070738.
- Pang, Y., Z. Li, H. Ju, H. Lu, W. Jia, L. Si, Y. Guo, et al. 2016. “LiChy: The Caf’s LiDar, CCD and Hyperspectral Integrated Airborne Observation System.” Remote Sensing 8 (5): 398. doi:10.3390/rs8050398.
- Pang, Y., W. Wang, L. Du, Z. Zhang, X. Liang, Y. Li, and Z. Wang. 2021. “Nyström-Based Spectral Clustering Using Airborne LiDar Point Cloud Data for Individual Tree Segmentation.” International Journal of Digital Earth 14 (10): 1452–1476. doi:10.1080/17538947.2021.1943018.
- Rees, W.G., J. Tomaney, O. Tutubalina, V. Zharko, and S. Bartalev. 2021. “Estimation of Boreal Forest Growing Stock Volume in Russia from Sentinel-2 MSI and Land Cover Classification.” Remote Sensing 13 (21): 4483. doi:10.3390/rs13214483.
- Santoro, M., A. Beaudoin, C. Beer, O. Cartus, J.E. Fransson, R.J. Hall, C. Pathe, et al. 2015. “Forest Growing Stock Volume of the Northern Hemisphere: Spatially Explicit Estimates for 2010 Derived from Envisat ASAR.” Remote Sensing of Environment 168: 316–334. doi:10.1016/j.rse.2015.07.005.
- Senf, C., D. Pflugmacher, S. Van der Linden, and P. Hostert. 2013. “Mapping Rubber Plantations and Natural Forests in Xishuangbanna (Southwest China) Using Multi-Spectral Phenological Metrics from MODIS Time Series.” Remote Sensing 5 (6): 2795–2812. doi:10.3390/rs5062795.
- Shang, G., J. Zhu, T. Gao, X. Zheng, and J. Zhang. 2018. “Using Multi-Source Remote Sensing Data to Classify Larch Plantations in Northeast China and Support the Development of Multi-Purpose Silviculture.” Journal of Forestry Research 29 (4): 889–904. doi:10.1007/s11676-017-0518-0.
- Shen, Y., X. Zhang, W. Wang, R. Nemani, Y. Ye, and J. Wang. 2021. “Fusing Geostationary Satellite Observations with Harmonized Landsat-8 and Sentinel-2 Time Series for Monitoring Field-Scale Land Surface Phenology.” Remote Sensing 13 (21): 4465. doi:10.3390/rs13214465.
- Stournara, P., P. Patias, and D. Karamanolis. 2017. “Evaluating Wood Volume Estimates Derived from Quickbird Imagery with GEOBIA for Pinus Nigra Trees in the Pentalofo Forest, Northern Greece.” Remote Sensing Letters 8 (1): 96–105. doi:10.1080/2150704X.2016.1235806.
- Tian, J., L. Wang, X. Li, D. Yin, H. Gong, S. Nie, C. Shi, R. Zhong, X. Liu, and R. Xu. 2019. “Canopy Height Layering Biomass Estimation Model (CHL-BEM) with Full-Waveform LiDar.” Remote Sensing 11 (12): 1446. doi:10.3390/rs11121446.
- Tuia, D., J. Verrelst, L. Alonso, F. Pérez-Cruz, and G. Camps-Valls. 2011. “Multioutput Support Vector Regression for Remote Sensing Biophysical Parameter Estimation.” IEEE Geoscience and Remote Sensing Letters 8 (4): 804–808. doi:10.1109/LGRS.2011.2109934.
- Valbuena, R., A. Hernando, J.A. Manzanera, E.B. Görgens, D.R.A. Almeida, F. Mauro, A. García-Abril, and D.A. Coomes. 2017. “Enhancing of Accuracy Assessment for Forest Above-Ground Biomass Estimates Obtained from Remote Sensing via Hypothesis Testing and Overfitting Evaluation.” Ecological Modelling 366: 15–26. doi:10.1016/j.ecolmodel.2017.10.009.
- Venäläinen, A., I. Lehtonen, M. Laapas, K. Ruosteenoja, O.P. Tikkanen, H. Viiri, V. Ikonen, and H. Peltola. 2020. “Climate Change Induces Multiple Risks to Boreal Forests and Forestry in Finland: A Literature Review.” Global Change Biology 26 (8): 4178–4196. doi:10.1111/gcb.15183.
- Verrelst, J., Z. Malenovský, C. Van der Tol, G. Camps-Valls, J.P. Gastellu-Etchegorry, and P. Lewis, … J. Moreno. 2019. “Quantifying Vegetation Biophysical Variables from Imaging Spectroscopy Data: A Review on Retrieval Methods.” Surveys in Geophysics 40 (3): 589–629. doi:10.1007/s10712-018-9478-y.
- Xu, C., B. Manley, and J. Morgenroth. 2018. “Evaluation of Modelling Approaches in Predicting Forest Volume and Stand Age for Small-Scale Plantation Forests in New Zealand with RapidEye and LiDar.” International Journal of Applied Earth Observation and Geoinformation 73: 386–396. doi:10.1016/j.jag.2018.06.021.
- Xu, D., H. Wang, W. Xu, Z. Luan, and X. Xu. 2021. “LiDar Applications to Estimate Forest Biomass at Individual Tree Scale: Opportunities, Challenges and Future Perspectives.” Forests 12 (5): 550. doi:10.3390/f12050550.
- Xu, H., M. Wu, and J. Ye. 2009. “Study on Consociation Equation Set Model Method to Establish Duality Standing Tree Volume Model.” Forest Research 22 (6): 788–791.
- Zhang, L., Z. Shao, J. Liu, and Q. Cheng. 2019. “Deep Learning Based Retrieval of Forest Aboveground Biomass from Combined LiDar and Landsat 8 Data.” Remote Sensing 11 (12): 1459. doi:10.3390/rs11121459.
- Zhao, P., D. Lu, G. Wang, C. Wu, Y. Huang, and S. Yu. 2016. “Examining Spectral Reflectance Saturation in Landsat Imagery and Corresponding Solutions to Improve Forest Aboveground Biomass Estimation.” Remote Sensing 8 (6): 469. doi:10.3390/rs8060469.
- Zhao, Q., S. Yu, F. Zhao, L. Tian, and Z. Zhao. 2019. “Comparison of Machine Learning Algorithms for Forest Parameter Estimations and Application for Forest Quality Assessments.” Forest Ecology and Management 434: 224–234. doi:10.1016/j.foreco.2018.12.019.
- Zhou, J., Z. Zhou, Q. Zhao, Z. Han, P. Wang, J. Xu, and Y. Dian. 2020. “Evaluation of Different Algorithms for Estimating the Growing Stock Volume of Pinus Massoniana Plantations Using Spectral and Spatial Information from a SPOT6 Image.” Forests 11 (5): 540. doi:10.3390/f11050540.
- Zhu, Z., and C.E. Woodcock. 2014. “Continuous Change Detection and Classification of Land Cover Using All Available Landsat Data.” Remote Sensing of Environment 144: 152–171. doi:10.1016/j.rse.2014.01.011.