
 ?Mathematical formulae have been encoded as MathML and are displayed in this HTML version using MathJax in order to improve their display. Uncheck the box to turn MathJax off. This feature requires Javascript. Click on a formula to zoom.
ABSTRACT
Oasis cities are deeply affected by human activities in arid and semi-arid regions. Vegetation is an important repository in the carbon cycle of oasis urban ecosystems. The continuous expansion of urban has a disproportionate impact on the carbon sequestration capacity of vegetation. Till now, studies have been conducted to quantify the impact of urbanization on vegetation carbon sequestration capacity, the mechanism of such impact remains unclear and lacks systematic investigations, especially in oasis urban. Understanding the impact mechanism greatly benefits the sustainable development of oasis urban and regional carbon neutrality. To fill this knowledge gap, we design a theoretical framework to analyze the impact of urbanization on vegetation carbon sequestration capacity by isolating the direct and indirect impacts in Urumqi, China. Some results based on Landsat images indicated that the Impervious Surface Areas (ISAs) expanded by 436.98 km2 during 2000 – 2019. The Net Primary Productivity (NPP) calculated using the Vegetation Photosynthesis Model (VPM) was directly caused by the loss of 51.45 Gg C (1 Gg = 109 g). Another important finding proved that the direct carbon loss caused by urbanization did not change the upward trend of the total carbon sequestration capacity of vegetation, but only slowed down this upward trend by 20.86%. Our results provide new insights into urban vegetation carbon sinks and contribute to a better understanding of the uncertainty of urbanization toward carbon neutrality. This study will provide scientific data support and suggestions for the sustainable development of oasis cities and the regional carbon budget.
1. Introduction
Urban ecosystems occupy only a small fraction of the area of terrestrial ecosystems, yet have profound impacts on carbon cycling locally and globally (Jia, Zhao, and Liu Citation2018; Quesada et al. Citation2018; Seto, Güneralp, and Hutyra Citation2012; Shi et al. Citation2021). Since the 21st century, the growth rate of the world’s urban population has been far greater than that of the world’s population, and global urbanization has entered a new stage (Buyantuyev and Wu Citation2009; Cai et al. Citation2022; Li et al. Citation2020). The sustainable development of cities is closely related to the 17 Sustainable Development Goals (SDGs) of the United Nations (Elmqvist et al. Citation2019; Sachs et al. Citation2019). Urbanization is mainly reflected in population growth and geographic expansion (Dlamini et al. Citation2021; Luo et al. Citation2021; Qiu et al. Citation2020; Tong et al. Citation2020). Urban geographic expansion (urban space expansion) is to adapt to the growing population by replacing natural landscapes with concrete and asphalt surfaces, which means an increase in Impervious Surface Areas (ISAs) and a decrease in urban vegetation (Gregg, Jones, and Dawson Citation2003; Guan et al. Citation2019). ISAs mainly include building roofs, roads, parking lots, sidewalks, squares, etc. The construction and expansion of ISAs have affected the urban water cycle (Shao et al. Citation2019; Jiang et al. Citation2022), urban heat islands (Lauko et al. Citation2020; Shen et al. Citation2016; He et al. Citation2021), and urban ecological service functions (Feng et al. Citation2022; Maimaiti et al. Citation2021). Nonetheless, ISAs expansion is featured by high spatial heterogeneity, thus posing great challenges for scholars to elucidate the impact mechanism of urbanization on the vegetation carbon sequestration capacity.
The vegetation is of great significance to people living in the urban environment (Chen et al. Citation2021; Zhao, Liu, and Zhou Citation2016). Urban vegetation can not only increase carbon storage and improve the urban water cycle, but also alleviate the urban heat island effect, air pollution, and weather disasters (Zhong et al. Citation2021; Nassauer and Raskin Citation2014; Wang et al. Citation2022). It even benefits the physical and mental health of urban residents and the improvement of social and economic benefits (Dafforn et al. Citation2015; Li et al. Citation2021; Zhang et al. Citation2021). In analyzing the impact of urbanization on plants, Net Primary Productivity (NPP) is often used to express the carbon sequestration capacity of vegetation (Dela Torre, Jay, and Macinnis-Ng Citation2021; Doughty et al. Citation2015; Song et al. Citation2019; Imhoff et al. Citation2004). NPP refers to the total amount of organic matter accumulated by green vegetation during photosynthesis per unit of time and area (Field, Randerson, and Malmstrom Citation1995; Stocker et al. Citation2019; Weinzettel, Vackaru, and Medkova Citation2019). It is an important ecological indicator that avoids the interference caused by the vegetation type and planting structure (Chazdon et al. Citation2016; Tagesson et al. Citation2020). In light of the above merits, this study used NPP to simulate the carbon sequestration capacity of urban vegetation.
Oasis is the main environment for human survival in arid areas (Sun et al. Citation2021; Zhuang et al. Citation2021). The oasis city is the gathering center of human production and life in the oasis, and it is also the most sensitive and complex area of the human-land relationship (Zhang et al. Citation2020). Compared with other urban, oasis urban have the characteristics of scarce vegetation, fragile ecological environment, and strong water resources constraints (Shi et al. Citation2021). Urumqi is the largest oasis city in Central Asia and an important node on the “Belt and Road” channel (Shi et al. Citation2020). Urbanization has had a huge impact on the regional carbon budget and further affects the sustainable development of the oasis city. Urbanization has caused a series of environmental effects, such as the heat island effect, significantly higher CO2 concentrations, and increased reactive nitrogen compounds. These urban environmental changes are many times higher than the corresponding changes occurring in natural ecosystems. However, previous studies simply focus on the complete or relative damage of urbanization to the carbon sequestration capacity of vegetation (Buyantuyev and Wu Citation2009; Li et al. Citation2017). We think that the impact of urbanization on vegetation needs to be systematically explored.
To address these issues, the main objectives of this study are: (i) to explore the oasis urban expansion dynamics based on Landsat time-series data between 2000 and 2019; (2) to quantify the spatial-temporal variations of vegetation carbon sequestration capacity using NPP simulated by the vegetation photosynthesis model (VPM); (3) to efficiently separate the direct and indirect impacts of urbanization on vegetation carbon sequestration capacity; (4) to declare the mechanism of urbanization’s impact on vegetation carbon sequestration capacity and how to deal with this changing mechanism.
2. Methods and materials
2.1. Study area
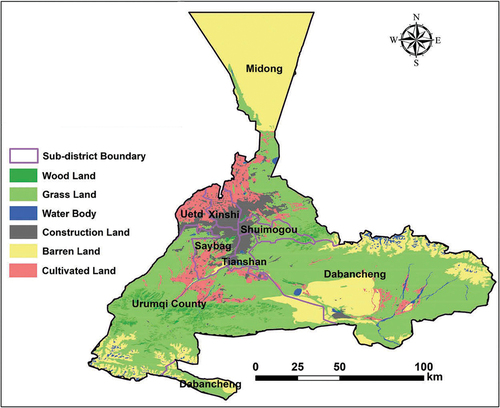
Urumqi (42°45′N to 44°08′N, 86°37′E to 88°58′E) is located in the arid area of Xinjiang and the center of the Eurasian continent. It is located at the northern foot of the middle section of the Tianshan Mountains and the southern edge of the Junggar Basin, which is one of the inland urban far from the ocean and a typical oasis city. The urban area is surrounded by mountains on three sides. The terrain is high in the southeast and low in the northwest, with an average elevation of 800 m. The city has a temperate continental climate with an average annual temperature of 7.3 °C, an average annual precipitation of 236 mm, an average annual evaporation close to 2000 mm, an average annual sunshine of 2775 h, and a frost-free period of 105–168 d.
The city has 7 districts and 1 county under its jurisdiction (). The whole city is in the shape of a vase, narrow in the upper part and wide in the lower part. Among them, Tianshan District, Saybag District, Xinshi District, and Shuimogou District are the central urban areas. Uetd District is the sub-center of the city. Midong District is located in the north of the city. Dabancheng District and Urumqi County area in the south of the city. The implementation of the western development strategy and the “Belt and Road” initiative has promoted the rapid development of Urumqi. The urban registered population increased rapidly from 1.1026 million in 2000 to 2.2262 million in 2018. In order to meet the needs of urban development, the built-up area (which is 494.15 km2 in 2000) expanded to 1012.08 km2 in 2018.
Figure 1. Land use types and sub-district boundary in Urumqi.
2.2 Extraction of impervious surface areas (ISAs)
Due to the heterogeneity of the urban landscape, the undulating terrain shadows from tall buildings and tree canopies seriously interfere with the spectral characteristics of the underlying surface (Shao, Wu, and Li Citation2021). It is difficult to deal with the problem of intra-class variation of spectra only by spectral features (Huang, Yang, and Yang Citation2021). In order to improve the extraction accuracy of ISAs, some typical thematic indices (including normalized difference building index, shadow index, and soil-adjusted vegetation index) and texture features were added to Landsat time-series images to assist in this work. The improved Landsat images are input into the Random Forest (RF) model generated from the training samples to obtain the classification result (). The specific formulas are as follows:
Figure 2. Random forest model flow chart.
where R is the red band; G is the green band; B is the blue band; MIR is the mid-infrared band; NIR is the near-infrared band.
The results were validated for accuracy using the overall accuracy and Kappa coefficient. The overall accuracy, which represents the probability that the classification result of each random sample is consistent with the actual type of the corresponding region, was the number of all cells that were correctly classified for LULC categories divided by the total number of pixels (Tottrup and Rasmussen Citation2004). The kappa coefficient was used to characterize the degree to which the two maps agreed (category maps are consistent with Google Earth high-resolution images or field-measured data or credible classification maps), and was considered both the correct and the incorrect point. The specific formulas are as follows:
where P refers to the overall accuracy; xii represents correctly classified pixels; xi+ andx+i represent the sum of the pixels in the i-th row and the i-th column, respectively; N represents the sum of the pixels of the true reference source; k is the number of categories.
A total of 134 random points were generated on both Landsat images and reference data to evaluate the classification accuracy. We found that the overall accuracy was 92.04% in 2000, 92.00% in 2005, 91.56% in 2010, 92.24% in 2015, and 92.32% in 2019. The kappa coefficient was 0.89 in 2000, 0.87 in 2005, 0.90 in 2010, 0.91 in 2015 and 0.91 in 2019. Both overall accuracy and kappa coefficient indicated that the classification result was reliable.
2.3 Net primary productivity (NPP) retrieval
We selected the VPM to simulate the NPP dataset with a temporal resolution of 8 days. The spatial resolution of the NPP dataset is 500 m × 500 m. To confine all data to a consistent spatial resolution, we interpolated the NPP dataset to a spatial resolution of 30 m × 30 m via an Ordinary Kriging method. The VPM model is a light energy utilization model. Compared with other NPP estimation models, it has several merits, such as concise input parameters, high accuracy, and fast calculation (Pei et al. Citation2020; Walther et al. Citation2016). The equations of VPM are as follows (Xiao Citation2004; Zhuang et al. Citation2022a):
where represents the light energy utilization (g/MJ); PAR represents photo synthetically active radiation (MJ/m2); FPARchl represents the photosynthetic effective radiation ratio absorbed by vegetation photosynthesis;
represents the maximum light energy utilization rate (g/MJ); s represents the ratio of respiration to GPP; Tscalar, Wscalar and Pscalar are the adjustment coefficients of temperature, moisture, and crop phenology for maximum light energy utilization, respectively.
In VPM, FPARchl is usually replaced by enhanced vegetation index (EVI):
where a is the empirical coefficient, which is generally 1.
Tscalar can be calculated using the terrestrial ecosystem model:
where Tmin is the lowest temperature of crops during photosynthesis; Tmax is the maximum temperature of crops during photosynthesis; Topt is the optimum temperature of crops during photosynthesis. When the air temperature is lower than the minimum temperature of photosynthesis, Tscalar was set to 0 in previous studies (Zhuang et al. Citation2022b).
In VPM, Wscalar was calculated using the land surface moisture index (LSWI):
where LSWImax is the largest LSWI of the crop growing season in each grid cell.
The equation of Pscalar is as follows:
where Pscalar is set to 1 after the leaves are fully stretched.
2.4 Isolate the direct and indirect impact of urbanization on NPP
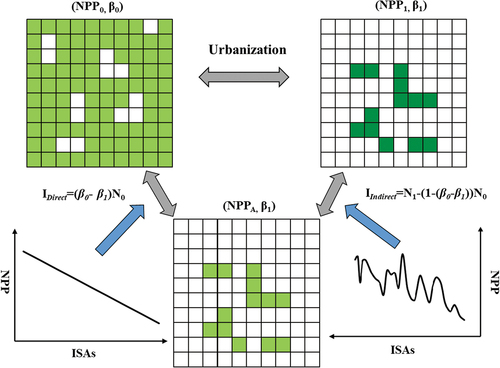
To explore the mechanism of urbanization on the carbon sequestration capacity of vegetation, we developed a theoretical framework that can identify the direct and indirect impacts of urbanization on NPP. The detailed description is as follows:
where NPP (x, t0) is the NEP in pixel x at time t0; RISAs (x, t0) refers to the rate of impervious surface areas (RISAs) in pixel x at time t0; and NPPFV (x, t0) represents the NPP in pixel x when it has full vegetation cover. Under this concept, the direct and indirect effects of impervious surface expansion on NPP can be calculated. Assuming that ISAs expansion has no indirect impact on NPP, NPP from t0 to t1 can be expressed as:
where NPPd (x, t1) refers to the NPP in pixel x at time t1 assuming not to be indirectly affected; RISAs (x, t1) is the RISAs in pixel x at time t1; and NPPFV (x, t0) represents the NPP in pixel x when it has full vegetation cover. Thus, the direct impact Id and indirect impact Ii of urbanization on vegetation carbon sequestration capacity can be calculated:
where NPP (x, t1) is the actual NPP at time t1 after the ISA expanded. NPPd (x, t1) is a hypothetical NPP that only considers the direct impact of urbanization on vegetation carbon sequestration capacity. The difference between NPPd (x, t1) and the initial NPP at time t0 is the direct impact of urbanization on the NPP. During the same period, the difference between the actual NPP (x, t1) and NPPd (x, t1) should be the indirect impact of urbanization on the NPP. Following the above concepts and calculations, we can derive the direct and indirect effects of urbanization on NPP between 2000 and 2019 based on NPP and RISAs time series.
3. Results
3.1. Spatial-temporal dynamics of the impervious surface areas (ISAs)
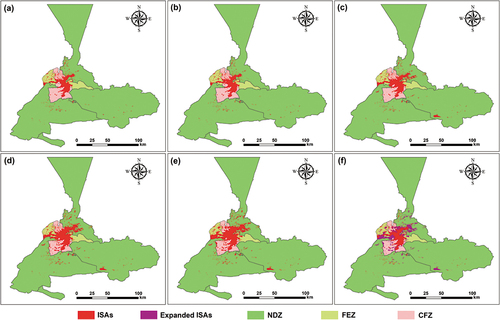
The ISAs were found expanded by 436.98 km2 (465.53 km2 in 2000 and 902.51 km2 in 2019), with an increasing rate of 93.87%. Unsurprisingly, great disparities in ISAs expansion occurred across different function zones (). The new development zone made the largest contribution (net increase of 251.40 km2) to ISAs expansion in Urumqi, specifically, Dabancheng with an increase of 32.04 km2, Midong with an increase of 151.57 km2, and Urumqi with an increase of 67.79 km2. The core functional zone was the second-important contributor, with 121.04 km2 of land converted to ISAs. Saybag contributed 74.41 km2 to the ISAs expansion, accounting for 61.48% of the expanded ISAs in the CFZ. Across the same time dimension, the ISAs of Tianshan expanded by only 7.46 km2, and the remaining expanded ISAs occurred in Xinshi. In addition, the ISAs expansion in the function extended zone (64.54 km2) was the lowest among all function zones. The RISAs is the other indicator that deserves attention. The RISAs of Urumqi increased from 3.00% to 6.40% during the investigated period. Unsurprisingly, as the place where human activities mainly take place, CFZ has the highest RISAs (27.04% in 2000 and 39.74% in 2019). The RISAs of FEZ increased by 8.41% (13.30% in 2000 and 21.71% in 2019). Although NDZ had the largest area of expanded impervious surface, the RISAs was the lowest (0.85% in 2000 and 2.89% in 2019) among the function zones.
Figure 3. Spatial distribution of ISAs in 2000 (a), 2005 (b), 2010 (c), 2015 (d), 2019 (e), and from 2000 to 2019 (f) in CFZ, FEZ, and NDZ of Urumqi.
3.2. Inter-annual spatial-temporal variations of NPP
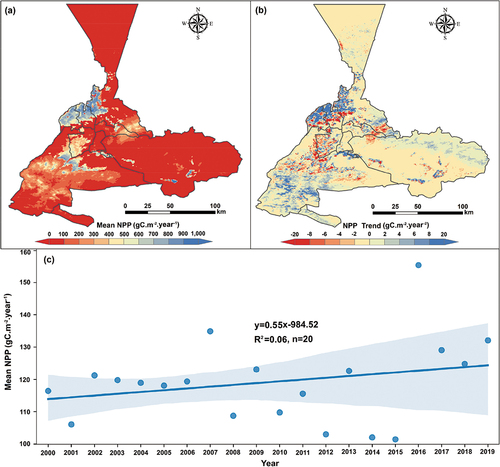
In this study, we conducted a correlation analysis between the measured value of biomass and the NPP obtained by the VPM model inversion. The results show that the simulated value of NPP is considerably consistent with the measured biomass (R2 = 0.72, P < 0.01). To assess the systematic dynamics in vegetation carbon sequestration capacity over the past few decades, the NPP was analyzed from 2000 to 2019. Our results indicated the vegetation carbon sequestration capacity presented an increasing trend during the investigated period, with a pixel-wise increase of 15.64 gC. m−2. year−1 (). From the perspective of spatial distribution, the highest NPP occurred mainly in Uetd (mean pixel-wise NPP reached 526.43 gC. m−2. year−1) and Xinshi (479.44 gC. m−2. year−1). The lowest NPP mainly focused on Dabancheng (45.94 gC. m−2. year−1) and Tianshan (35.35 gC. m−2. year−1). From the percentage of pixel-wise positive and negative changes, pixels with a positive trend of NPP accounted for 24.35%, of which the ones with an increasing rate greater than 4.00 gC. m−2. year−1 accounted for 3.29% (). Pixels with a negative trend of NEP accounted for 75.65%, of which the ones with a reduction rate greater than 4 gC. m−2. year−1 accounted for 8.09%. More specifically, the inter-annual variation trend of NPP can be found in .
Figure 4. (a) Spatial distribution of mean NPP during 2000–2019 in Urumqi; (b) Pixel-wise spatial-temporal trend of annual NPP during 2000–2019 in Urumqi; (c) Inter-annual variations of NPP from 2000 to 2019.
3.3. Impact of urbanization on vegetation carbon sequestration capacity
The ISAs occupy only a small proportion (6.40%) of the Urumqi’s land surface, their expansion can weaken the growth rate of NPP, because of the vegetation reduction due to land cover conversion. Environmental changes (e.g. warming, nitrogen deposition, and CO2 emissions) and increasing the human activity caused by the ISAs expansion can alter the carbon sequestration capacity of terrestrial vegetation. The net increase in total carbon stock during the study period was 195.14 Gg C (1 Gg C = 109 g C, 1422.20 Gg C in 2000, and 1617.34 Gg C in 2019). Vegetation destruction caused by ISAs expansion directly contributed to a carbon loss of 51.45 Gg C. Indirect impact contributed to an increase in vegetation carbon storage with 246.59 Gg C. Carbon loss caused by direct impact offsets 20.86% of the carbon increase caused by indirect impact. For the retained vegetation area, the carbon sequestration capacity also showed different trends. In CFZ, there was a net increase in carbon stocks of 42.97 Gg C. ISAs expansion made a negative contribution (−31.27 Gg C), offsetting 42.12% of the indirect impact (+74.24 Gg C). Indirect impact contributed +47.46 Gg C to carbon storage in the FEZ, which directly offsets by 35.46% (16.83 Gg C) from the ISAs expansion. Direct carbon loss (−24.38 Gg C) offsets 16.89% of the indirect increase (+144.33 Gg C) in the NDZ. Such an indirect effect on the promotion of vegetation photosynthesis is expected to reach a saturation state after the RISAs reaches a certain state.
4. Discussion
4.1. Necessity of isolating the direct and indirect impact of urbanization on NPP
The impact of urbanization on the carbon sequestration capacity of vegetation is a complex system process (). Traditional studies focus on the overall impact of urbanization on the carbon sequestration capacity of vegetation without distinguishing between direct and indirect impacts (Gregg, Jones, and Dawson Citation2003; Chen et al. Citation2017). Therefore, most traditional studies have concluded that urbanization destroyed the carbon sequestration capacity of vegetation (Peng et al. Citation2016; Liu et al. Citation2018). In fact, as an important symbol of social development, urbanization has a very complex impact on vegetation conditions. This process can be roughly divided into two sections: (1) The ISAs expansion prompts a shift in land type, resulting in a reduction in the physical area of vegetation; (2) Environmental effects (e.g. increased temperature and increased CO2 concentration) caused by urbanization and human management (including greening design, conservation management, etc.) may have a positive impact on urban vegetation. We believe that urban can serve as “natural laboratories” for studying changes in the carbon sequestration capacity of vegetation under the background the of global climate change. Therefore, distinguishing the direct and indirect impacts of urbanization on NPP helps us to systematically understand the deep relationship between human activities and ecosystems.
Figure 5. Conceptual diagram that reveals the impact of urbanization on vegetation carbon sequestration capacity in oasis cities.
By isolating the direct and indirect effects of urbanization on the carbon sequestration capacity of vegetation, this study found several interesting phenomena: (1) In the process of rapid urbanization, the total carbon sequestration capacity of urban vegetation has been significantly improved in the past two decades. Our results are consistent with the views of many well-known scholars (Lai et al. Citation2016; Seto, Güneralp, and Hutyra Citation2012; Huang et al. Citation2019). We all agree that expansion of urban land will be detrimental to the carbon sequestration capacity of vegetation. (2) The reduced carbon stock is the result of urban vegetation being replaced by ISAs over the past 20 years. By comprehensively considering the area of destroyed vegetation and the carbon sequestration capacity per unit area, the largest carbon loss occurred in the CFZ of Urumqi. (3) The carbon sequestration capacity of the remaining vegetation was increased after urbanization, with an increase of 20.42 gC. m−2. year−1. Environmental effects caused by urbanization (e.g. artificial irrigation, pruning, and fertilization) and anthropogenic activities (urban heat island, increasing temperature, and CO2 emissions) can create a more favorable living environment for vegetation in urban areas (Brovkin et al. Citation2013). Urbanization changes the living environment of vegetation, which has the potential to indirectly enhance the carbon sequestration capacity of vegetation. These important conclusions can only be obtained by distinguishing the direct and indirect effects of urbanization on vegetation.
4.2. How to offset the impacts of urbanization on the regional carbon budget
Urbanization may lead to some changes in the local carbon budget. The destruction of vegetation by urbanization directly led to the loss of vegetation carbon by 51.45 Gg C during 2000–2019. However, the environmental effects caused by urbanization indirectly increased the vegetation carbon by 246.59 Gg C. It can be seen that the impact of urbanization on the carbon sequestration capacity of vegetation was bidirectional, rather than a single increase or decrease. This view is consistent with some advanced studies (Zhao, Liu, and Zhou Citation2016; Liu et al. Citation2019; Guan et al. Citation2019). From the overall framework of carbon budget, urbanization not only has an impact on the carbon sequestration capacity of vegetation, but also has a significant impact on atmospheric carbon emissions and soil carbon sequestration capacity. Zhang, Li, and Wang (Citation2016) showed that the urban soil organic carbon (SOC) in Urumqi showed a descending gradient along the suburban section line, and the urban SOC was 2.22 times that of the suburban soil. Therefore, urbanization leads to changes in the regional carbon budget in several ways.
We put forward the following recommendations in a targeted manner: (1) Design a new development pattern that couples urban master planning, land use, economic development, and environmental protection; (2) Further study the feasibility and potential of replacing fossil fuels with clean energy, and provide urban Provide reference for the research theory of emission reduction; (3) Systematically study the contribution of urban vegetation to regional carbon sequestration, revealing the carbon sequestration potential of urban vegetation in various climates, and its relationship with factors such as temporal and spatial scales, urbanization degrees, and land use patterns; (4) In the future, a detailed and complete life cycle database of urban vegetation carbon sequestration can be established to explore the impact of different design and maintenance management methods on urban vegetation carbon sequestration.
4.3. Implications for sustainable development of oasis urban
As the main places of human activities in arid areas, oasis urban have more fragile ecosystems and more prominent roles than humid urban. Urbanization leads to changes in the carbon budget of regional ecosystems and brings new challenges to the sustainable development of oasis urban (Tian and Qiao Citation2014; Houghton and Nassikas Citation2017). This study examined the deep relationship between urbanization and the carbon sequestration capacity of vegetation. The findings provide scientific references for the sustainable development of oasis urban and regional carbon budget. ISAs of Urumqi have expansion ratio close to or higher than that of humid urban. In the same time dimension, this ratio was 35.14% in Wuhan (Zhong et al. Citation2021) and 95.12% in Shanghai (Zhong et al. Citation2019). However, extreme droughts threaten the city’s sustainability, and continued urbanization could potentially exacerbate this threat. Therefore, we suggest that relevant agencies and governments should consider a series of environmental effects for the sustainability of urbanization in their middle and long-term planning.
4.4. Limitations and future direction
In this work, we unravel the impact of ISAs expansion on the carbon sequestration capacity of vegetation. Nonetheless, various uncertainties remain in distinguishing between direct and indirect impacts. For example, indirect impacts is are multifaceted, and many environmental factors (e.g. warming, nitrogen deposition, and CO2 emissions) can have notable effects on the spatiotemporal dynamics of NPP (Chen et al. Citation2019; Pan and Dong Citation2018; Pei et al. Citation2020; Rath and Rousk Citation2015). In addition, the transformation from non-urban land to urban land is highly complex and spatially heterogeneous, and a limited number of eddy covariance flux towers may not be sufficient to fully capture its spatiotemporal variable. Besides ISAs expansion, more factors that include soil conditions, vegetation structure, climate change, and nitrogen deposition should be considered in future studies. We also call for the protection and enhancement of urban vegetation. If they continue to be destroyed, it may induce a drastic decline in the carbon sink capacity of vegetation.
5. Conclusion
This study demonstrated that urbanization has a complex impact on vegetation carbon sequestration capacity by isolating the direct and indirect impacts. It is of both theoretical significance and practical implication for the scientific development of oasis urban and regional carbon neutrality. The following conclusions were justified by the results of this study. It can be concluded that the Urumqi has an urbanization rate close to or higher than that of coastal or plain urban, ISAs with a net increase of 436.98 km2. More than half of the expanding ISAs occurred in the new development zones (57.53%). Our results demonstrated that urban expansion did not change the upward trend of vegetation carbon sequestration capacity, but only reduced its growth rate. Specifically, urban expansion directly resulted in a loss of 51.45 Gg C of vegetation carbon, offsetting 20.86% of the carbon increase in vegetation caused by indirect effects. These offsets show significant spatial heterogeneity, with 42.12% in the core functional zones and only 16.89% in the new development zones. This study explored the impact of urbanization on vegetation carbon sequestration capacity by designing a conceptual framework to isolate direct and indirect impacts, providing feasible suggestions for the sustainable development of oasis urban and regional carbon neutrality. In future research, we plan to consider more factors (e.g. soil conditions, vegetation structure, climate change, and nitrogen deposition) to explain the indirect impacts.
Author contributions
Q. Zhuang, Z. Shao and D. Li designed the research; S. Wu performed experiments and computational analysis; Q. Zhuang and X. Huang drafted the paper; Q. Zhuang and O. Altan contributed to the interpretation and the preparation of the manuscript.
Acknowledgments
We would like to extend sincere gratitude to the academic editor and reviewers for their constructive comments which greatly helped us to improve the quality of this manuscript.
Disclosure statement
No potential conflict of interest was reported by the author(s).
Data availability statement
The multi-period Landsat images are available from https://www.usgs.gov/. Annual GPP derived from measurements at flux towers using the eddy covariance technique are available from the FLUXNET 2015 database and ChinaFlux database. Remotely sensed LAI are available from http://www.resdc.cn/data.aspx?DATAID=336. Daily maximum temperature, minimum temperature, solar radiation, precipitation, and daily average relative humidity are available from https://catalogue.ceda.ac.uk/uuid/10d2c73e5a7d46f4ada08b0a26302ef7. Soil datasets are available from http://www.fao.org/nr/lman/abst/lman_080701_en.htm.
Additional information
Funding
Notes on contributors
Qingwei Zhuang
Qingwei Zhuang is a Ph.D candidate in State Key Laboratory of Information Engineering in Surveying, Mapping and Remote Sensing, Wuhan University. He got Master's degree from the University of Chinese Academy of Sciences. His research interest mainly focuses on remote sensing applications. The specific research directions include remote sensing image processing and analysis, key technologies and applications in urban ecosystem.
Zhenfeng Shao
Zhenfeng Shao is a professor in State Key Laboratory of Information Engineering in Surveying, Mapping and Remote Sensing, Wuhan University. He got the PhD degree from Wuhan University in 2004. His research interest mainly focuses on urban remote sensing applications. The specific research directions include high-resolution remote sensing image processing and analysis, key technologies and applications from digital urban to smart urban and sponge urban.
Deren Li
Deren Li is a professor and chair of the Academic Committee of the State Key Laboratory for Information Engineering in Surveying, Mapping, and Remote Sensing, Wuhan University. He was selected as a member of Chinese Academy of Sciences in 1991 and a member of Chinese Academy of Engineering in 1994. He got his PhD degree from University of Stuttgart, Germany. He was awarded the title of honorary doctor from ETH, Switzerland in 2008. His research interests include photogrammetry and remote sensing, global navigation satellite system, geographic information system, and their innovation integrations and applications.
Xiao Huang
Xiao Huang is an Assistant Professor in the Department of Geoscience at the University of Arkansas. He obtained his Bachelor’s degree from Wuhan University in 2015, Master’s degree from Georgia Institute of Technology in 2016, and Ph.D. degree from University of South Carolina in 2020. His research interests cover big geospatial data, deep learning, applied remote sensing, and urban informatics.
Orhan Altan
Orhan Altan is the Honorary Member of ISPRS and Science Academy, and Honorary Fellow of Indian Society of Remote Sensing. He received the master’s degrees in civil engineering at Istanbul Polytechnic University in 1970. He studied at ETH Zurich Institute of Geodest and Photogrammetry from 1972 to 1973. He served as the director of ISPRS from 2000 to 2004. He was the secretary general of ISPRS from 2004 to 2008, chairman of ISPRS from 2008 to 2012; first vice chairman of ISPRS from 2012 to 2016; member of Executive Council of International Council of science from 2011 to 2018.
Shixin Wu
Shixin Wu is a professor in State Key Laboratory of Desert and Oasis Ecology, Xinjiang Institute of Ecology and Geography, Chinese Academy of Sciences. His research interests focus on land use and land cover change and its ecological environment effects.
Yuzhen Li
Yuzhen Li is a lecturer in the School of Emergency Management at Xihua University. She received her PhD degree from the University of Chinese Academy of Sciences in 2020. Her research interests cover land surface models, terrestrial ecosystems and climate change, and remote sensing applications.
References
- Brovkin, V., L. Boysen, V. K. Arora, J. P. Boisier, P. Cadule, L. Chini, M. Claussen, et al. 2013. “Effect of Anthropogenic Land-Use and Land-Cover Changes on Climate and Land Carbon Storage in CMIP5 Projections for the Twenty-First Century.” Journal of Climate 26 (18): 6859–6881. doi:10.1175/jcli-d-12-00623.1.
- Buyantuyev, A., and J. Wu. 2009. “Urbanization Alters Spatiotemporal Patterns of Ecosystem Primary Production: A Case Study of the Phoenix Metropolitan Region, USA.” Journal of Arid Environments 73 (4–5): 512–520. doi:10.1016/j.jaridenv.2008.12.015.
- Cai, B., Z. Shao, S. Fang, and X. Huang. 2022. “Quantifying Dynamic Coupling Coordination Degree of Human–Environmental Interactions During Urban–Rural Land Transitions of China.” Land 11 (3): 935. doi:10.3390/land11060935.
- Chazdon, R. L., E. N. Broadbent, D. M. A. Rozendaal, F. Bongers, A. M. A. Zambrano, T. M. Aide, P. Balvanera, et al. 2016. “Carbon Sequestration Potential of Second-Growth Forest Regeneration in the Latin American Tropics.” Science Advances 2 (5): e1501639. doi:10.1126/sciadv.1501639.
- Chen, Y., X. Feng, H. Tian, X. Wu, Z. Gao, Y. Feng, S. Piao, N. Lv, N. Pan, and B. Fu. 2021. “Accelerated Increase in Vegetation Carbon Sequestration in China After 2010: A Turning Point Resulting from Climate and Human Interaction.” Global Change Biology 27 (22): 5848–5864. doi:10.1111/gcb.15854.
- Chen, T., Q. Huang, M. Liu, M. Li, L. Qu, S. Deng, and D. Chen. 2017. “Decreasing Net Primary Productivity in Response to Urbanization in Liaoning Province, China.” Sustainability 9 (2): 162–170. doi:10.3390/su9020162.
- Chen, J., W. Ju, P. Ciais, N. Viovy, R. Liu, Y. Liu, and X. Lu. 2019. “Vegetation Structural Change Since 1981 Significantly Enhanced the Terrestrial Carbon Sink.” Nature Communications 10 (1): 4259. doi:10.1038/s41467-019-12257-8.
- Dafforn, K. A., T. M. Glasby, L. Airoldi, N. K. Rivero, M. Mayer-Pinto, and E. L. Johnston. 2015. “Marine Urbanization: An Ecological Framework for Designing Multifunctional Artificial Structures.” Frontiers in Ecology and the Environment 13 (2): 82–90. doi:10.1890/140050.dela.
- Dela Torre, D. M. G., G. Jay, and C. Macinnis-Ng. 2021. “Remote Sensing-Based Estimation of Rice Yields Using Various Models: A Critical Review.” Geo-Spatial Information Science 24 (4): 580–603. doi:10.1080/10095020.2021.1936656.
- Dlamini, S., S. G. Tesfamichael, G. D. Breetzke, and T. Mokhele. 2021. “Spatio-Temporal Patterns and Changes in Environmental Attitudes and Place Attachment in Gauteng, South Africa.” Geo-Spatial Information Science 24 (4): 666–677. doi:10.1080/10095020.2021.1976599.
- Doughty, C. E., D. B. Metcalfe, C. A. J. Girardin, F. Farfan Amezquita, D. Galiano Cabrera, W. Huaraca Huasco, J. E. Silva-Espejo, et al. 2015. “Drought Impact on Forest Carbon Dynamics and Fluxes in Amazonia.” Nature 519 (7541): 78–U140. doi:10.1038/nature14213.
- Elmqvist, T., E. Andersson, N. Frantzeskaki, T. McPhearson, P. Olsson, O. Gaffney, K. Takeuchi, and C. Folke. 2019. “Sustainability and Resilience for Transformation in the Urban Century.” Nature Sustainability 2 (4): 267–273. doi:10.1038/s41893-019-0250-1.
- Feng, Y., P. Wu, X. Tong, P. Li, R. Wang, Y. Zhou, J. Wang, and J. Zhao. 2022. “The Effects of Factor Generalization Scales on the Reproduction of Dynamic Urban Growth.” Geo-Spatial Information Science 1–19. doi:10.1080/10095020.2022.2025748.
- Field, C. B., J. T. Randerson, and C. M. Malmstrom. 1995. “Global Net Primary Production - Combining Ecology and Remote Sensing.” Remote Sensing of Environment 51 (1): 74–88. doi:10.1016/0034-4257(94)00066-v.
- Gregg, J. W., C. G. Jones, and T. E. Dawson. 2003. “Urbanization Effects on Tree Growth in the Vicinity of New York City.” Nature 424 (6945): 183–187. doi:10.1038/nature01728.
- Guan, X., H. Shen, X. Li, W. Gan, and L. Zhang. 2019. “A Long-Term and Comprehensive Assessment of the Urbanization-Induced Impacts on Vegetation Net Primary Productivity.” The Science of the Total Environment 669: 342–352. doi:10.1016/j.scitotenv.2019.02.361.
- He, B., J. Wang, H. Liu, and G. Ulpiani. 2021. “Localized Synergies Between Heat Waves and Urban Heat Islands: Implications on Human Thermal Comfort and Urban Heat Management.” Environmental Research 193: 110584. doi:10.1016/j.envres.2020.110584.
- Houghton, R. A., and A. A. Nassikas. 2017. “Global and Regional Fluxes of Carbon from Land Use and Land Cover Change 1850-2015.” Global Biogeochemical Cycles 31 (3): 456–472. doi:10.1002/2016gb005546.
- Huang, M., S. Piao, P. Ciais, J. Penuelas, X. Wang, T. F. Keenan, S. Peng, et al. 2019. “Air Temperature Optima of Vegetation Productivity Across Global Biomes.” Nature Ecology & Evolution 3 (5): 772–779. doi:10.1038/s41559-019-0838-x.
- Huang, X., Q. Yang, and J. Yang. 2021. “Importance of Community Containment Measures in Combating the COVID-19 Epidemic: From the Perspective of Urban Planning.” Geo-Spatial Information Science 24 (3): 363–371. doi:10.1080/10095020.2021.1894905.
- Imhoff, M. L., L. Bounoua, R. DeFries, W. T. Lawrence, D. Stutzer, C. J. Tucker, and T. Ricketts. 2004. “The Consequences of Urban Land Transformation on Net Primary Productivity in the United States.” Remote Sensing of Environment 89 (4): 434–443. doi:10.1016/j.rse.2003.10.015.
- Jiang, C., J. Li, Y. Hu, Y. Yao, and H. Li. 2022. “Construction of Water-Soil-Plant System for Rainfall Vertical Connection in the Concept of Sponge City: A Review.” Journal of Hydrology 605: 127327. doi:10.1016/j.jhydrol.2021.127327.
- Jia, W., S. Zhao, and S. Liu. 2018. “Vegetation Growth Enhancement in Urban Environments of the Conterminous United States.” Global Change Biology 24 (9): 4084–4094. doi:10.1111/gcb.14317.
- Lai, L., X. Huang, H. Yang, X. Chuai, M. Zhang, T. Zhong, Z. Chen, Y. Chen, X. Wang, and J. R. Thompson. 2016. “Carbon Emissions from Land-Use Change and Management in China Between 1990 and 2010.” Science Advances 2 (11): e1601063. doi:10.1126/sciadv.1601063.
- Lauko, I. G., A. Honts, J. Beihoff, and S. Rupprecht. 2020. “Local Color and Morphological Image Feature Based Vegetation Identification and Its Application to Human Environment Street View Vegetation Mapping, or How Green is Our County?” Geo-Spatial Information Science 23 (3): 222–236. doi:10.1080/10095020.2020.1805367.
- Li, W., P. Ciais, S. Peng, C. Yue, Y. Wang, M. Thurner, S. S. Saatchi, et al. 2017. “Land-Use and Land-Cover Change Carbon Emissions Between 1901 and 2012 Constrained by Biomass Observations.” Biogeosciences 14 (22): 5053–5067. doi:10.5194/bg-14-5053-2017.
- Li, X., P. Gong, Y. Zhou, J. Wang, Y. Bai, B. Chen, T. Hu, et al. 2020. “Mapping Global Urban Boundaries from the Global Artificial Impervious Area (GAIA) Data.” Environmental Research Letters 15 (9): 094044. doi:10.1088/1748-9326/ab9be3.
- Li, Z., L. Jiao, B. Zhang, G. Xu, and J. Liu. 2021. “Understanding the Pattern and Mechanism of Spatial Concentration of Urban Land Use, Population and Economic Activities: A Case Study in Wuhan, China.” Geo-Spatial Information Science 24 (4): 678–694. doi:10.1080/10095020.2021.1978276.
- Liu, S., W. Du, H. Su, S. Wang, and Q. Guan. 2018. “Quantifying Impacts of Land-Use/cover Change on Urban Vegetation Gross Primary Production: A Case Study of Wuhan, China.” Sustainability 10 (3): 714. doi:10.3390/su10030714.
- Liu, X., F. Pei, Y. Wen, X. Li, S. Wang, C. Wu, Y. Cai, et al. 2019. “Global Urban Expansion Offsets Climate-Driven Increases in Terrestrial Net Primary Productivity.” Nature Communications 10 (1): 5558. doi:10.1038/s41467-019-13462-1.
- Luo, Y., W. Sun, K. Yang, and L. Zhao. 2021. “China Urbanization Process Induced Vegetation Degradation and Improvement in Recent 20 Years.” Cities 114: 103207. doi:10.1016/j.cities.2021.103207.
- Maimaiti, B., S. Chen, A. Kasimu, Z. Simayi, and N. Aierken. 2021. “Urban Spatial Expansion and Its Impacts on Ecosystem Service Value of Typical Oasis Cities Around Tarim Basin, Northwest China.” International Journal of Applied Earth Observation and Geoinformation 104: 102554. doi:10.1016/j.jag.2021.102554.
- Nassauer, J. I., and J. Raskin. 2014. “Urban Vacancy and Land Use Legacies: A Frontier for Urban Ecological Research, Design, and Planning.” Landscape and Urban Planning 125: 245–253. doi:10.1016/j.landurbplan.2013.10.008.
- Pan, J., and L. Dong. 2018. “Spatio-Temporal Variation in Vegetation Net Primary Productivity and Its Relationship with Climatic Factors in the Shule River Basin from 2001 to 2010.” Human and Ecological Risk Assessment: An International Journal 24 (3): 797–818. doi:10.1080/10807039.2017.1400373.
- Pei, Y., J. Dong, Y. Zhang, J. Yang, Y. Zhang, C. Jiang, and X. Xiao. 2020. “Performance of Four State-of-the-Art GPP Products (VPM, MOD17, BESS and PML) for Grasslands in Drought Years.” Ecological Informatics 56: 101052. doi:10.1016/j.ecoinf.2020.101052.
- Peng, J., H. Shen, W. Wu, Y. Liu, and Y. Wang. 2016. “Net Primary Productivity (NPP) Dynamics and Associated Urbanization Driving Forces in Metropolitan Areas: A Case Study in Beijing City, China.” Landscape Ecology 31 (5): 1077–1092. doi:10.1007/s10980-015-0319-9.
- Qiu, T., C. Song, Y. Zhang, H. Liu, and J. M. Vose. 2020. “Urbanization and Climate Change Jointly Shift Land Surface Phenology in the Northern Mid-Latitude Large Cities.” Remote Sensing of Environment 236: 111477. doi:10.1016/j.rse.2019.111477.
- Quesada, B., A. Arneth, E. Robertson, and N. de Noblet-Ducoudre. 2018. “Potential Strong Contribution of Future Anthropogenic Land-Use and Land-Cover Change to the Terrestrial Carbon Cycle.” Environmental Research Letters 13 (6): 064023. doi:10.1088/1748-9326/aac4c3.
- Rath, K. M., and J. Rousk. 2015. “Salt Effects on the Soil Microbial Decomposer Community and Their Role in Organic Carbon Cycling: A Review.” Soil Biology & Biochemistry 81: 108–123. doi:10.1016/j.soilbio.2014.11.001.
- Sachs, J. D., G. Schmidt-Traub, M. Mazzucato, D. Messner, N. Nakicenovic, and J. Rockström. 2019. “Six Transformations to Achieve the Sustainable Development Goals.” Nature Sustainability 2 (9): 805–814. doi:10.1038/s41893-019-0352-9.
- Seto, K. C., B. Güneralp, and L. R. Hutyra. 2012. “Global Forecasts of Urban Expansion to 2030 and Direct Impacts on Biodiversity and Carbon Pools.” Proceedings of the National Academy of Sciences of the United States of America 109 (40): 16083–16088. doi:10.1073/pnas.1211658109.
- Shao, Z., H. Fu, D. Li, O. Altan, and T. Cheng. 2019. “Remote Sensing Monitoring of Multi-Scale Watersheds Impermeability for Urban Hydrological Evaluation.” Remote Sensing of Environment 232: 111338. doi:10.1016/j.rse.2019.111338.
- Shao, Z., W. Wu, and D. Li. 2021. “Spatio-Temporal-Spectral Observation Model for Urban Remote Sensing.” Geo-Spatial Information Science 24 (3): 372–386. doi:10.1080/10095020.2020.1864232.
- Shen, H., L. Huang, L. Zhang, P. Wu, and C. Zeng. 2016. “Long-Term and Fine-Scale Satellite Monitoring of the Urban Heat Island Effect by the Fusion of Multi-Temporal and Multi-Sensor Remote Sensed Data: A 26-Year Case Study of the City of Wuhan in China.” Remote Sensing of Environment 172: 109–125. doi:10.1016/j.rse.2015.11.005.
- Shi, L., Ü. Halik, A. Abliz, Z. Mamat, and M. Welp. 2020. “Urban Green Space Accessibility and Distribution Equity in an Arid Oasis City: Urumqi, China.” Forests 11 (6): 690. doi:10.3390/f11060690.
- Shi, L., Ü. Halik, Z. Mamat, T. Aishan, and M. Welp. 2021. “Identifying Mismatches of Ecosystem Services Supply and Demand Under Semi-Arid Conditions: The Case of the Oasis City Urumqi, China.” Integrated Environmental Assessment and Management 17 (6): 1293–1304. doi:10.1002/ieam.4471.
- Shi, T., G. Han, X. Ma, W. Gong, W. Chen, J. Liu, X. Zhang, Z. Pei, H. Gou, and L. Bu. 2021. “Quantifying CO2 Uptakes over Oceans Using LIDAR: A Tentative Experiment in Bohai Bay.” Geophysical Research Letters 48 (9): e2020GL091160. doi:10.1029/2020gl091160.
- Song, J., S. Wan, S. Piao, A. K. Knapp, A. T. Classen, S. Vicca, P. Ciais, et al. 2019. “A Meta-Analysis of 1,119 Manipulative Experiments on Terrestrial Carbon-Cycling Responses to Global Change.” Nature Ecology & Evolution 3 (9): 1309–1320. doi:10.1038/s41559-019-0958-3.
- Stocker, B. D., J. Zscheischler, T. F. Keenan, I. C. Prentice, S. I. Seneviratne, and J. Penuelas. 2019. “Drought Impacts on Terrestrial Primary Production Underestimated by Satellite Monitoring.” Nature Geoscience 12 (4): 264±. doi:10.1038/s41561-019-0318-6.
- Sun, Q., L. Zhou, X. Tang, D. Sun, and X. Dang. 2021. “Spatial Influence and Prediction of Oasis Urban Expansion on Cultivated Land in Arid Areas: A Case Study of the Hexi Corridor.” Journal of Natural Resources 36 (4): 1008–1020. doi:10.31497/zrzyxb.20210415.
- Tagesson, T., G. Schurgers, S. Horion, P. Ciais, F. Tian, M. Brandt, A. Ahlstrom, et al. 2020. “Recent Divergence in the Contributions of Tropical and Boreal Forests to the Terrestrial Carbon Sink.” Nature Ecology & Evolution 4 (2): 202–209. doi:10.1038/s41559-019-1090-0.
- Tian, G., and Z. Qiao. 2014. “Assessing the Impact of the Urbanization Process on Net Primary Productivity in China in 1989–2000.” Environmental Pollution 184: 320–326. doi:10.1016/j.envpol.2013.09.012.
- Tong, Z., H. Yang, C. Liu, T. Xu, and S. Xu. 2020. “Quantification of the Openness of Urban External Space Through Urban Section.” Geo-Spatial Information Science 23 (4): 316–326. doi:10.1080/10095020.2020.1846464.
- Tottrup, C., and M. S. Rasmussen. 2004. “Mapping Long-Term Changes in Savannah Crop Productivity in Senegal Through Trend Analysis of Time Series of Remote Sensing Data.” Agriculture, Ecosystems & Environment 103 (3): 545–560. doi:10.1016/j.agee.2003.11.009.
- Walther, S., M. Voigt, T. Thum, A. Gonsamo, Y. Zhang, P. Köhler, M. Jung, A. Varlagin, and L. Guanter. 2016. “Satellite Chlorophyll Fluorescence Measurements Reveal Large-Scale Decoupling of Photosynthesis and Greenness Dynamics in Boreal Evergreen Forests.” Global Change Biology 22 (9): 2979–2996. doi:10.1111/gcb.13200.
- Wang, N., Y. Du, F. Liang, H. Wang, and J. Yi. 2022. “The Spatiotemporal Response of China’s Vegetation Greenness to Human Socio-Economic Activities.” Journal of Environmental Management 305: 114304. doi:10.1016/j.jenvman.2021.114304.
- Weinzettel, J., D. Vackaru, and H. Medkova. 2019. “Potential Net Primary Production Footprint of Agriculture: A Global Trade Analysis.” Journal of Industrial Ecology 23 (5): 1133–1142. doi:10.1111/jiec.12850.
- Xiao, X. 2004. “Modeling Gross Primary Production of Temperate Deciduous Broadleaf Forest Using Satellite Images and Climate Data.” Remote Sensing of Environment 91 (2): 256–270. doi:10.1016/j.rse.2004.03.010.
- Zhang, X., Y. Li, and P. Wang. 2016. “Analysis of Spatial Variability of Soil Organic Carbon in Urumqi.” Journal of Arid Land Resources and Environment 30 (2): 117–121. doi:10.13448/j.cnki.jalre.2016.056.
- Zhang, M., G. Luo, P. Cai, and R. Hamdi. 2020. “Effects on Local Temperature and Energy of Oasis City Expansion in Arid Area of Northwest China.” Journal of Sensors 2020: 3282475. doi:10.1155/2020/3282475.
- Zhang, W., M. Randall, M. B. Jensen, M. Brandt, Q. Wang, and R. Fensholt. 2021. “Socio-Economic and Climatic Changes Lead to Contrasting Global Urban Vegetation Trends.” Global Environmental Change-Human and Policy Dimensions 71: 102385. doi:10.1016/j.gloenvcha.2021.102385.
- Zhao, S., S. Liu, and D. Zhou. 2016. “Prevalent Vegetation Growth Enhancement in Urban Environment.” Proceedings of the National Academy of Sciences of the United States of America 113 (22): 6313–6318. doi:10.1073/pnas.1602312113.
- Zhong, J., J. Liu, L. Jiao, X. Lian, Z. Xu, and Z. Zhou. 2021. “Assessing the Comprehensive Impacts of Different Urbanization Process on Vegetation Net Primary Productivity in Wuhan, China, from 1990 to 2020.” Sustainable Cities and Society 75: 103295. doi:10.1016/j.scs.2021.103295.
- Zhong, Q., J. Ma, B. Zhao, X. Wang, J. Zong, and X. Xiao. 2019. “Assessing Spatial-Temporal Dynamics of Urban Expansion, Vegetation Greenness and Photosynthesis in Megacity Shanghai, China During 2000–2016.” Remote Sensing of Environment 233: 111374. doi:10.1016/j.rse.2019.111374.
- Zhuang, Q., Z. Shao, X. Huang, Y. Zhang, W. Wu, X. Feng, X. Lv, Q. Ding, B. Cai, and O. Altan. 2021. “Evolution of Soil Salinization Under the Background of Landscape Patterns in the Irrigated Northern Slopes of Tianshan Mountains, Xinjiang, China.” Catena 206: 105561. doi:10.1016/j.catena.2021.105561.
- Zhuang, Q., Z. Shao, D. Li, X. Huang, B. Cai, O. Altan, and S. Wu. 2022b. “Unequal Weakening of Urbanization and Soil Salinization on Vegetation Production Capacity.” Geoderma 411: 115712. doi:10.1016/j.geoderma.2022.115712.
- Zhuang, Q., S. Wu, X. Huang, L. Kong, Y. Yan, H. Xiao, Y. Li, and P. Cai. 2022a. “Monitoring the Impacts of Cultivated Land Quality on Crop Production Capacity in Arid Regions.” Catena 214: 106263. doi:10.1016/j.catena.2022.106263.