
ABSTRACT
Decarbonizing transport is one of the core tasks for achieving Net Zero targets, but the COVID-19 pandemic disrupts human mobility and the established transport development strategies. Although existing research has explored the relationship between virus transmission, human mobility, and restrictions policies, few have studied the responses of multimodal human mobility to the pandemic and their impacts on the achievement of decarbonizing transport. This paper employs 32 consecutive biweekly observations of mobile phone application data to understand the influences of the pandemics on multimodal human mobility from February 2020 to April 2021 in London. We here illustrate that multimodal travel behavior and traffic flows significant changed after the pandemic and related lockdowns, but the decline or recovery varies across different travel modes and lockdowns. The car mode has shown the most resilience throughout the pandemic, but the travel modes in the public transit sector were hit hard. Cycle and walk modes remained high at the beginning of the pandemic, but the trend did not continue as the pandemic developed and the season changed. Our findings suggest that the COVID-19 pandemic brought more challenges to travel mode shifting and the achievement of decarbonizing transport rather than opportunities. This analysis will assist transport authorities to optimize the established transport policies and to redistribute limited resources for accelerating the achievement of decarbonizing transport.
1. Introduction
While transportation benefits urban development and social interactions, it also places a huge burden on the whole society and environment. Transport accounts for about one-fifth of global carbon dioxide emissions. In the UK, domestic transport has the largest share of greenhouse gas (GHGs) emissions of any sector across the economy (HM Government Citation2021). It is a challenge for keeping the vitality of people, goods, and services flows while mitigating the negative impacts of climate change. Therefore, decarbonizing transport has become one of the most important tasks to achieve the Net Zero or Carbon Neutrality target all around the world. The UK government has outlined a series of strategic priorities for achieving decarbonizing transport, including accelerating modal shifting to public and active transport and decarbonizing road transport (Department for Transport Citation2021a). Meanwhile, transport and local authorities are working together to redesign transport infrastructure and optimize transport policies for developing a green and healthy transport system. However, the emergence of various unplanned disruptions, such as natural disasters and public health crises, may have impacts beyond the original expectations of decarbonizing transport policies and thus hinder the achievement of these ambitious goals.
The COVID-19 pandemic is the most critical global public health crisis in this century. As of March 2022, the COVID-19 pandemic has resulted in more than 450 million confirmed cases and 6 million deaths worldwide (World Health Organization Citation2020). To control the rapid spread of the virus and support health systems, many countries have implemented large-scale travel restrictions. Although these restrictions and their implementation are varied in different areas, most of them include social distancing, work from home, school closures, mandatory isolation for symptomatic individuals and their contacts, etc. It is widely confirmed that these intervention policies effectively prevent the transmission of SARS-CoV-2 in Europe and Asia countries (Flaxman et al. Citation2020; Kraemer et al. Citation2020; Nouvellet et al. Citation2021), but also profoundly affect human mobility patterns and travel behavior (Basu and Ferreira Citation2021; Przybylowski, Stelmak, and Suchanek Citation2021; Guzman et al. Citation2021). This unprecedented disruption brings a new variable to promote the decarbonization of transport, which is how the travel restrictions and fear of the virus reshape multimodal human mobility. It is also unclear whether the emergence of the COVID-19 pandemic is an opportunity or disaster for accelerating the achievement of decarbonizing transport targets.
A series of studies have been conducted to explore the changes in human mobility in the Global South or North during the pandemic (Kan et al. Citation2021; Kim and Po Kwan Citation2021; Politis et al. Citation2021; Hadjidemetriou et al. Citation2020; Barbieri et al. Citation2021; Passavanti et al. Citation2021). Compared to the pre-COVID period, human mobility has dramatically declined because of the rapid development of the pandemic and various travel restrictions. In the UK, the largest share of human mobility reduction was observed when the government continuously updated its measures until the lockdown (Hadjidemetriou et al. Citation2020). The average daily distance and activity radius also decreased in other European countries in early 2020 (Schmidt et al. Citation2021). Besides, individuals’ activity patterns and rhythms also changed due to the policy of work (or study) from home since the beginning of the lockdown. While the amount of time spent at home has increased, that spent at workplaces and transit location has significant decreased (Beck and Hensher Citation2020).
In addition to the impacts on overall travel behavior, the pandemic also brought divergent influences on different travel modes. Since the COVID-19 may bring a perceived risk of infection, people have increased their usage of alternative modes. Commuters have expressed concerns about using public transit to workplaces both in the US and UK after lockdowns. Besides, car sales data from China shows an increase in car purchases post-lockdown, in contrast to a historically decreasing trend (Basu and Ferreira Citation2021). Active travel, including cycling and walking, also increased during the pandemic when people became aware of the virus threat and when restrictions came into place. About 21% of respondents who commuted by public transit and 10% of respondents who commuted by car are still willing to take more active travel in the future in the UK, because they perceived the personal and environmental benefits of cycling and walking, and the provision to support cycling also increased during the pandemic (Harrington and Hadjiconstantinou Citation2022). On the contrary, the traffic flows have tremendously decreased in the public transit sector. Vickerman (Citation2021) points out that London Underground and Nation Rail fell to below 5% and only recovered to 12–15% by the end of June compared with the pre-COVID period, but car traffic was nearly back to almost 80% by mid-June.
Although the existing studies have provided solid evidence for the impacts of the COVID-19 pandemic on human mobility, it still cannot reveal the changes in multimodal mobility and utilization of transport resources during the pandemic. First, most of the studies analyzed the changes in human mobility based on cross-section data, such as questionnaires or survey data. However, there is a lag in the changes in travel behavior, and the short-term analysis cannot reveal these changes in the different stages of the pandemic. Besides, the small sample of questionnaire or survey data cannot fully reveal the effectiveness of transport and public policies. Second, although some mobile phone data and smart card data covering a larger group of people are employed to explore the long-term changes in human mobility, these datasets only provide a single travel mode and aggregated movement. Moreover, optimizing the transport decarbonization policies requires not only an understanding of changes in individuals’ travel behavior and mode shifting, but also the changes in the multimodal traffic flows and the utilization of road space. However, few have been analyzed from this perspective.
To fill these gaps, this study will explore how multimodal human mobility changes during the COVID-19 pandemic in terms of travel behavior and traffic flow, and how these changes further influence the achievement of decarbonizing targets. The rest of this paper is organized as follows. The next section introduces the study area and the selected dataset. The third section presents the framework of multimodal human mobility analysis. The fourth section illustrates the responses of multimodal travel behavior and traffic flows to the COVID-19 pandemic and their impacts on decarbonizing transport. The fifth section discusses the implication of the changes in multimodal human mobility to the decarbonizing transport strategy during the pandemic. The final section concludes the paper and lists potential biases and future steps.
2. Study area and data
2.1. Study area
London has one of the most complex multimodal transport systems in the world, which supports the daily activities of 13% population in the UK. Besides, London also has the most developed public transport systems integrated tube, train and bus systems spanning the city. These factors make London a great sample for exploring multimodal transport and its changes.
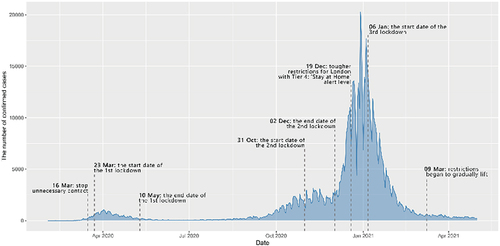
Since the first confirmed case in London on 12 February 2020, London had more than 730,000 confirmed cases and 15,000 death cases by the end of April 2021. During this period, three national lockdowns have been introduced to control the spread of the virus and support the local health system in London, which also influenced the multimodal transport system. presents the COVID-19 confirmed cases in London and key dates of restriction policies.
Figure 1. The COVID-19 confirmed cases from Feb 2020 to Apr 2021 in London and key dates of intervention policies (data source: COVID-19 in the UK).
2.2. Data source
The individual multimodal dataset is generated from GDPR-consented mobile phone application data provided by LSAI by using travel mode detection algorithms (Bolbol et al. Citation2012). Seven travel modes are detected, including bus, car, cycle, tube, train, walk and stationary, which could represent the main daily travel modes in London. Compared with the traditional dataset and other mobile phone datasets, this individual multimodal dataset is not only characterized by massive volume, high spatio-temporal resolution and accuracy, but also provides the corresponding travel modes for each record. The dataset covers all odd-numbered weeks (32 weeks) from 3 February 2020 to 18 April 2021 in London. Week 1 (February − 9 February 2020) will be the baseline week. The data and related timeline are listed in .
Table 1. The periods of selected data and corresponding key stages.
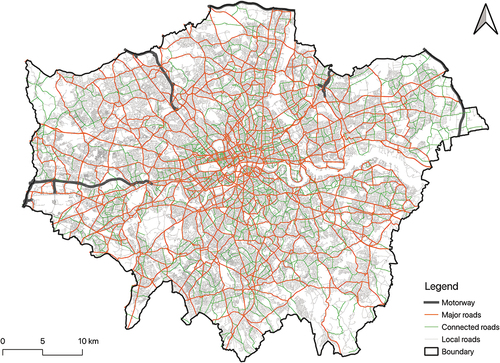
The road network is obtained from the Ordnance Survey. The road classes in the data have been further aggregated into four classes (): Motorway, Major road, Connected road and Local road based on the UK Department of Transport’s definition of each road class (Department for Transport Citation2012). Major roads are intended to provide large-scale transport links between areas; Connected roads are intended to feed the traffic between the Major roads and Local roads; Local Roads are intended for local traffic. In addition, the spatial data of the middle layer super output area (MSOA) is downloaded from the Office for National Statistics.
Figure 2. The road network with different road classes in London.
3. The framework of multimodal human mobility analysis
In this paper, the impacts of the COVID-19 pandemic on multimodal human mobility will be explored on two scales of multimodal travel behavior and multimodal traffic flows. Multimodal travel behavior intends to reveal the responses of individual behavior and mode choice to the pandemic. Multimodal traffic flows aim to uncover the utilization changes of transportation resources and road space in different modes. Besides, the response differences in travel behavior and traffic flow to three lockdowns will also be analyzed on the MSOA level. The diagram of multimodal human mobility analysis is presented in .
Figure 3. The diagram of multimodal human mobility analysis.
Multimodal travel behavior will be analyzed in terms of distance, time, and rhythm for each travel mode. Three travel types, including car, public transit and active travel will be generated from the original six travel modes to provide general insights. Travel distance and time are the basic indicators to measure individual travel behavior. Travel distance and time are from the fields of the individual multimodal dataset that provides the network-based distances between two records and the time differences. Travel distance and time of each travel mode/type are then further summarized by the median value of individuals’ average daily travel distance/time. These results will then be standardized to present the changes in travel distance and time compared to the baseline week. The baseline week is from 3 February to 9 February 2020 (week 1 in the study). In addition, travel rhythm aims to depict the travel behavior changes in temporal dimensions (Zillinger Citation2007). In this study, travel rhythm mainly focuses on revealing the periodic changes in the start and end times of daily travel. It is presented by calculating how many devices start/end their movement in each hour of the day and the proportion relative to the total number of devices. This indicator is crucial to understand the temporal travel demand and specific behavior processes (Nurul Habib, Miller, and Axhausen Citation2008).
Before analyzing multimodal traffic flows, the first thing is to derive the multimodal traffic flows from the individual multimodal dataset. The original individual multimodal data consist of trajectory points. The original trajectory points will be mapped to the corresponding road segments, and the paths between two consecutive points will be found by using Dijkstra’s algorithm. After these processes, the street-level multimodal traffic flows will be produced, which could present how many devices pass through a road segment by certain travel modes in a day. This dataset could be used to analyze multimodal traffic flows and uncover the road utilization of different travel modes. The dataset includes four road-based travel modes, namely bus, car, cycle and walk. Daily multimodal traffic flows will be further summed to the weekly level and standardized to present the changes compared to the baseline week. The analysis of multimodal traffic flows mainly includes two aspects. One is about uncovering the changes in overall traffic flows for different road-based travel modes during the pandemic. The other is to analyze the multimodal traffic flows in three road classes (e.g. major roads, connected roads, and local roads). This analysis could reveal the utilization changes in road space of different travel modes during the pandemic.
Lastly, the responses of multimodal human mobility to three lockdowns will be analyzed at the MSOA level. Travel behavior will be represented by travel distance and time; the traffic flows of each road-based mode will be used to represent traffic flow. In order to reveal the responses at the MSOA level, the first step is to detect the home location of each unique device. Home location detection is usually conducted by using rule-based, probability-based or machine learning methods (Nguyen et al. Citation2020). Given the lack of ground truth in mobile phone application datasets, the rule-based method could effectively detect the home location of each device from massive data volume. Two rules were defined to detect the users’ residence: a. if a device has records from 11:00 pm to 7:00 am, the MSOA with the highest number of records will be assigned as its residence; b. if a device does not have the records during that period, the MSOA that the last record appears in will be its home location. Furthermore, analysis of variance (ANOVA) will be used to reveal the impact differences of three lockdowns on multimodal human mobility, but multiple comparisons between two groups will increase the probability of Type I error and lead to over-fitting. Thus, Tukey’s honestly significant difference (HSD) will be employed to conduct multiple comparisons and control the overall error.
4. The responses of multimodal human mobility to the COVID-19 pandemic
4.1. The changes in multimodal travel behavior: distance, time, and rhythm
4.1.1. Travel distance
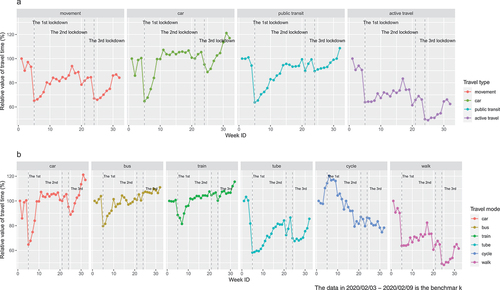
Travel restrictions intended to control the virus transmission have significantly affected daily travel behavior. shows the relative median value of daily average travel distance from February 2020 to April 2021 and is summarized by travel types and travel modes in respectively. After the first national lockdown, the travel distance of overall movement has steeply declined to 30% compared to the baseline in early February 2020, and gradually recovered to about 85% at the end of August with the removal of most restrictions. However, this recovery was interrupted by the second wave of the pandemic, and the relative value of travel distance decreased again after implementing the second lockdown. Compared with the first and third lockdown, the decrease after introducing the second lockdown was relatively small, but the travel distance of movement rebounded quickly after lifting the restriction. It may be the reason why the number of confirmed cases remained stably high during the second lockdown.
Figure 4. The relative median value of daily average travel distance in each travel type (a) and mode (b).
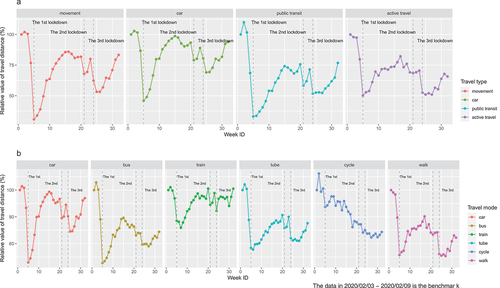
For the different travel types and modes, the overall trends are similar to the movement, but the following differences need to be pointed out.
First, car use presents the greatest resilience. Although the travel distance of car mode quickly declined after introducing the first national lockdown, it was the first mode of transport to quickly recover to pre-pandemic after lifting restrictions. Because of the characteristics of convenience, low infection rate, and non-seasonality, driving is one of the prior travel modes for daily travel during the pandemic.
Second, the public transit sector has suffered an unprecedented shock due to the COVID-19 pandemic and related intervention policies. The relative values of travel distances in the public transit sector confronted a dramatic decrease. While the transport authorities cut the frequency of public transit to control the virus transmission, people also took less public transit for fear of infection. Except for train mode, the relative value of travel distance in the public transit sector does not recover to the normal situation after three lockdowns. It is not easy to find an economical and reliable transport for people who take trains as their daily travel or commute transport. Thus, the travel distance of train mode is almost back to the level of the pre-pandemic period.
Last, the decrease in the active travel sector is smaller than the car and public transit sectors, and cycle and walk modes present different changing trends. Cycling is the only mode that did not steeply decline after introducing the first lockdown. As an alternative travel mode for medium to long distances, the travel distance of cycle remained at a relatively high level during the spring and summer of 2020. However, the trend of cycle and walk modes has been affected by seasonality and shifting attitudes toward the COVID-19 virus. Prior to the second lockdown, the travel distance of cycle and walk modes started declining and remained at a relatively low level until April 2021. According to the response of active travel to the pandemic and interventions, it seems unlikely that cycle and walk could permanently replace driving and public transit.
4.1.2. Travel time
Travel time and distance are two sides of the same coin and are correlated with each other closely. Although the overall trends in travel time are similar to travel distance in different travel types and modes, the magnitude of decrease or recovery is quite different with travel distance (). For example, after implementing the first lockdown, the travel time decrease in each travel type and mode is smaller than the travel distance. Besides, the relative value of travel time in the public transit sector is higher than in the pre-pandemic period. A series of restrictions, such as work/study from home, changed the original travel behavior. The reduction in regular and purposeful travel such as daily commuting has made personal travel more flexible. During the pandemic, some trips may not only achieve a specific purpose, but the trip itself became a valued activity. For example, walking and cycling may be an alternative to indoor exercise during the pandemic. As a result, people are likely to spend more time traveling the same distance during the pandemic. On the other hand, the pandemic and related intervention policies changed the usage of transportation resources and the scheduled timetable. Transport for London (TfL) and local authorities worked together to redesign the road system during the pandemic. Extending cycle lanes, setting Low Traffic Neighborhoods and other transportation interventions are implemented to encourage active travel (Department for Transport Citation2021b; Transport for London Citation2020). The redistribution of road space may increase the travel time of bus and car modes. In addition, the frequency and capacity of public transit have been decreased for controlling the virus transmission. It may increase the travel time for people who must take public transit.
Figure 5. The relative median value of daily average travel time in each travel types (a) and modes (b).
4.1.3. Travel rhythm
Travel rhythm refers to the periodic changes in daily travel behavior within 24 hours cycle. The changes in travel rhythm affected both the utilization and optimization of transportation resources and individual travel behavior. presents the distribution of overall movement start () and end time () in different periods by aggregating daily travel data. The clock was changed to summertime from 29 March to 25 October 2020 (about from Week 5 to Week 20), all activities were therefore brought forward by one hour. It should be noted that the data generation and processing are daily based. The activities of nighttime workers and people with nightlife may across two days, which leads the value slightly higher at the midnight.
Figure 6. The distribution of movement start (a) and end (b) time in different periods.
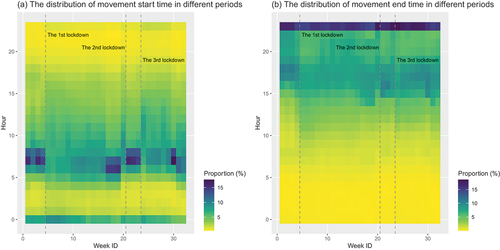
Overall, the impacts of the first and third lockdown on travel rhythm are more significant than after the second lockdown. Compared to a clear peak in the start time of overall movement, the end times are relatively spread out over several hours in the evening. Before introducing the first national lockdown, the peak start time of overall movement spread over the morning hours from 6 am to 9 am, and the end time relatively spread out but still presented a clear peak. After gradually lifting the restrictions, the peak time in the morning emerged again in the middle of August 2020 and almost recovered to the pre-pandemic level. Travel rhythm presents similar patterns after implementing the third lockdown. However, travel rhythm still presents obvious peaks in the morning and afternoon during the second lockdown. This result, together with the analysis of individual travel distance and time, further proves that people continued to maintain their travel behavior during the second lockdown. It partly explained why the second lockdown did not control the spread of the virus and decreased the number of daily new cases.
For different travel modes, the distribution of start and end time follows the patterns of the overall movement (Figure S1). The differences in travel rhythm between different modes are: (1) Train mode presents a stable peak time in the morning and evening during the study period. People who need to take train mode may be hard to find alternative transport and must follow the timetable, which coincides with the analysis in the sections on travel time and distance. (2) car and walks still are the main modes compared with other travel modes at midnight.
4.2. The changes in multimodal traffic flows in the road network
In the city wide, exploring the changes in multimodal traffic flows could uncover the utilization of road space and guide future road space redesign. This section will analyze the traffic flows of four road-based travel modes during the study period, including bus, car, cycle and walk (). After introducing three lockdowns, significant drops in traffic flows occurred in four travel modes, but the decrease varied in different modes and stages. The pandemic did have a serious impact on daily travel, and the traffic flows of the four travel modes did not return to their pre-pandemic level. The first national lockdown dealt the biggest shock to traffic flow. After the Prime Minister asked the people to stop unnecessary contact on 16 March 2020, the traffic flows of four modes quickly decreased to about 50%-60% of the normal level. With the implementation of the first national lockdown, the traffic flows further declined. The traffic flows of bus and car modes fell to 16% and 23%, but cycle and walk modes remained at relatively high levels of 33% and 30% respectively. The traffic flows of bus and car modes gradually recovered after removing the related restrictions, but the bus mode is still at the lower level and had not recovered to the 50% of the pre-pandemic period at the end of April 2021.
Figure 7. The relative value of traffic flows in four road-based travel modes.
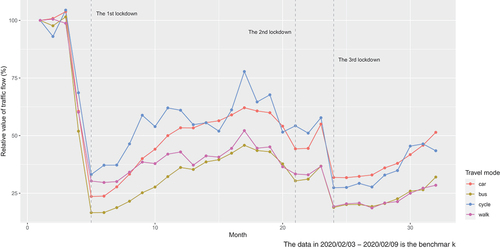
To promote transport decarbonization initiatives, it is important for the government to provide necessary financial support for maintaining the bus service and take actions to rebuild individuals’ confidence in taking public transit. Compared with the shock decreasing in bus modes, the resilience that the cycle and walk modes presented in the spring and summer of 2020 gave transport researchers and authorities a brief illusion. It is widely argued that the pandemic may be an opportunity for the development of sustainable mobility and healthy streets. However, with the change of season and the change of attitude toward the pandemic, the traffic flows of cycle and walk modes did not steadily maintain at a high level after the second pandemic. The traffic flow changes in these four travel modes raise a new question of how to promote daily travel back to normal in the post-pandemic period, especially for bus and active travel.
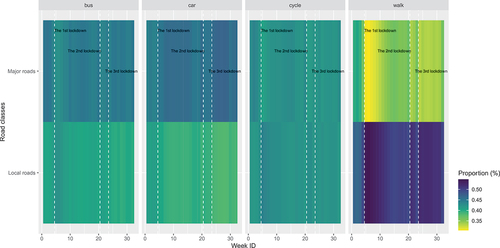
In a road network, different road class severs various roles for daily travel. presents the proportion of traffic flows in different road classes. As there is no significant change in the proportion of connect roads, the result is excluded in . The original is included in the supplementary (Figure S2). For four road-based travel modes, the proportion of traffic flows varies between different road classes at each stage of the pandemic. After introducing the lockdowns, the proportion of walk flows has the most significant changes on different road classes compared with other modes. Walk flows had an obvious increase on local roads after the lockdowns and gradually decreased with the lifting of the restrictions. When the restrictions such as staying at home required people to reduce their daily activity time, people also preferred to walk around in less crowded local areas and minimize cross-area activities to diminish the risk of infection. Although the walk flows gradually increased after removing the restrictions on the major roads, the distribution of walk flows in different road classes was still divergent from the pre-pandemic period. People may still choose to walk on local roads for fear of the infection despite a temporary cease of the pandemic. As another type of active travel, the cycle mode presents similar patterns to walk flows, but the differences between major roads and local roads are not very significant. The reason is that the cycle mode could be an alternative transport for middle or long distance trips during the pandemic. On the contrary, the proportion of car flows decreased on local roads after introducing the lockdowns, which may be caused by the decline of taxis and mobility as a service. Besides, TfL and local authorities rapidly deployed the Low Traffic Neighborhood scheme and other transport interventions to prevent through traffic and encourage active travel, which may also diminish the car flows on local roads and transfer car flows to the major road. Apart from the overall reduction in bus service in the early lockdown, there was not obviously a change in the proportion of bus flows on the different road classes. According to the analysis, the utilization of road spaces has changed in different travel modes during the pandemic, which also demands the transport authorities further optimize transportation resources for promoting the decarbonization of transport.
Figure 8. The proportion of traffic flows in different road classes.
4.3. The responses of multimodal individual travel behavior and traffic flows to three lockdowns
Multimodal travel behavior and traffic flows have various responses to the lockdowns and other restrictions. Compared with the travel behavior and traffic flow that changed after implementing the interventions, it is more important to explain why travel behavior and traffic flow in some modes or stages are stable when implementing or removing the restrictions. shows the ANOVA results for the groups without significant differences, the full results are provided in Table S1. Travel distance and time are selected to represent the travel behavior for analyzing the differences in each stage. Four distinctive features are observed in the results combined with the analysis in sections 3.1 and 3.2: (1) Most implementing or lifting the restrictions have significant impacts on multimodal travel behavior and traffic flows. (2) Insignificant results mainly occurred around the second lockdown, which covers both car, public transit, and active travel modes. (3) Car mode shows greater resilience when the restriction is introduced or removed compared with other modes. These results reaffirm that restrictions such as lockdown have a significant impact on human mobility. The curve of confirmed cases is flattened, and the pressure on the health system is reduced. Meanwhile, human mobility has also seen an adjustment to accommodate these restrictions. However, the overall impact of the restriction on human mobility and the pandemic development was short-lived. In the second and third lockdowns, as fears of the pandemic waned, new virus variants emerged, and lockdown fatigue, travel behavior and traffic flow either remained constant during the lockdown or recovered rapidly to pre-lockdown levels after lifting the restrictions. Besides, the second lockdown was relatively shorter in duration and weaker in control intensity, which may also be the reason that human mobility did not have significant changes. Driving is safer during the pandemic and less affected by the seasonality. On the contrary, traffic flows of cycle and walk modes in the second lockdown did not increase after lifting the restrictions, which may be mainly caused by colder weather.
Table 2. The insignificant group of ANOVA analysis after implementing or removing the lockdowns.
5. The implication of the changes in multimodal human mobility to the decarbonizing transport strategy
While the COVID-19 pandemic has influenced multimodal human mobility unprecedently, the changes in multimodal travel behavior and traffic flows were also become new variables to the established paths for promoting decarbonization of transport. In general, the pandemic brings more challenges rather than opportunities for the development of sustainable mobility and decarbonizing transport based on our analysis. Travel behavior has been temporarily shocked by the pandemic and related restrictions. Besides, although the magnitude of decline and recovery is various in different modes, there is no evidence that a specific travel mode has an irreversible change.
One of the key targets of transport decarbonizing is to accelerate travel mode shifting. Different travel modes have various characteristics, and the pandemic amplifies these characteristics that hinder the decarbonization schemes in the transport sector. Given the convenience and privacy of car mode and the fact that it is not subject to seasonal disruptions, driving becomes the preferred mode for reducing the risk of infecting the virus during the pandemic. The UK government also encouraged essential workers to take private vehicles rather than public transit to control the infection rate (Vickerman Citation2021). Besides, the rapid development of online shopping also generates more freight movement such as home delivery. These conditions are driving up car usage and preference, which may exacerbate the burden of decarbonizing transport. In fact, the characteristics of the car mode presented in the pandemic show that it is difficult to be replaced with other modes. To achieve decarbonization of the car sector, when the pandemic is gradually subsiding, the government needs to optimize the transport regulations for curbing the continued growth of car-dependency in the post-pandemic. In the longer term, development in the transport and energy sectors should be supported (e.g. hydrogen technology and electric vehicle), which will be able to radically reduce GHGs emissions. This is essential to permanently change the negative impact of the car sector on the decarbonization of transport.
In order to achieve the goal of decarbonizing transport, the government and society want people to adopt more public transit and active travel in their daily travel. There is no doubt that public transport is the travel type most affected by the pandemic. Because of the fear of infection, people still have concerns about taking public transit, and the recovery of public transit is still lagging behind car mode. Although the general consensus is that public transit ridership will also return to the pre-pandemic level at a slower pace (Angell and Potoglou Citation2022), the succession of pandemic and eroded confidence in public transit still has the potential to bring damage to the public transport sector. In the UK, the public transit sector includes public, private and franchised services. How to maintain the services of public transit from different sectors is significant to maintain its pivotal role in decarbonizing transport. Financial support from the government can ensure the operation of the public transit sector in the short term. However, it is more important that the government and the public transport sector work together to optimize the services and provide effective incentives to rapidly revive the confidence of people in public transport.
Active travel showed greater resilience in the spring and summer of 2020, which gave transport authorities and researchers a temporary illusion of whether it could replace part of motorized travel and secure a low carbon future. However, this change did not last but gradually started to decline after October 2020 based on our analysis. Understandably, active travel over medium to long distances is not a good option for most people during the winter months. It is therefore unreliable to accelerate mode shifting solely through the pandemic and related restrictions. In addition, transport authorities tried to improve active travel infrastructures to provide a safe road space to encourage active travel. While the investment in active travel infrastructure should be encouraged for promoting decarbonizing transport, it still requires extreme caution to maintain public confidence in the development of sustainable transport. For example, TfL and local authorities also worked together to implement the Low Traffic Neighborhood (the LTNs) scheme to further encourage take active travel and accelerate mode shifting. These schemes were quickly deployed without prior consultation as the government and TfL were eager to maintain social distance and encourage active travel. Although TfL and some local authorities reported that the LTNs scheme indeed brought more active travel and improves living environments, the LTNs scheme has proved highly controversial and provoked strong opposition from local residents.
Furthermore, although people may still follow their long-established travel behavior, the impacts of the pandemic on individuals’ daily life and work may in turn affect the entire multimodal transport systems in the long term. For example, the traffic flows of each mode have not returned to the level of pre-pandemic. A succession of lockdowns has led to a boom of remote-working and online shopping. Although the proportion of work from home has fallen with the removal of the restrictions, it is still much higher than pre-pandemic. Besides, some long-distance travel may be replaced by more cost-effective teleconferencing technology, which may also cut the needs for trains etc. Therefore, the reallocation of transport resources and the design of intervention policies still need to be re-optimized, to adapt to the new situation facing the decarbonizing in transport in the post-pandemic.
6. Conclusions
The COVID-19 pandemic sweeping the world has not only affected multimodal human mobility but has also brought new challenges to decarbonizing transport. This study explores how the COVID-19 pandemic influences multimodal human mobility and analyze the impacts of these changes on the decarbonization of transport. Our results confirm that the pandemic and related lockdowns brought significant impacts on the multimodal travel behavior and traffic flows, but the decline and recovery of travel distance, time and rhythm varies across different stages. The pandemic also changed multimode traffic flows and the utilization of road space.
In addition, different travel modes have various responses to the pandemic. The impacts of the pandemic and related lockdowns on car mode were relatively small, but the short-term hit on public transit was significant. Although active travel remained high at the beginning of the pandemic, this trend did not continue as the pandemic progressed and the seasons changed. Meanwhile, while more active travel appeared on the local roads after introducing the lockdown, more car flows transferred to major roads. Therefore, the COVID-19 pandemic brought more challenges to travel mode shifting and the achievement of decarbonizing transport rather than opportunities. These require the transport authorities to optimize the established development strategies for accelerating modal shifting and achieving the targets of decarbonizing transport.
Although these findings contribute solid evidence on the impacts of the pandemic on multimodal human mobility and decarbonizing transport, there are still two limitations that need to be solved in future research: First, our research assumes that the COVID-19 pandemic is the single variable influencing the changes in multimodal human mobility. However, the implementation of several transport intervention schemes during the pandemic may also affect multimodal mobility. Second, the sociodemographic analysis is not included in this study as the limitation of the data source. Individuals with various sociodemographic features may have different responses to the pandemic and lockdowns, which may further influence their multimodal mobility and the achievement of decarbonizing transport. In future research, we need to clarify the impacts on multimodal mobility from intervention policies with different aims. In addition, the responses of individuals with various sociodemographic to the interventions remain valuable to explore in order to formulate targeted decarbonizing transport strategies in the future.
Supplemental Material
Download MS Word (517.8 KB)Disclosure statement
No potential conflict of interest was reported by the author(s).
Data availability statement
The data that support the findings of this study are available on request from the corresponding author. The data are not publicly available due to the privacy issues.
Supplementary material
Supplemental data for this article can be accessed online at https://doi.org/10.1080/10095020.2022.2122876.
Additional information
Notes on contributors
Xianghui Zhang
Xianghui Zhang is a PhD student at SpaceTimeLab, University College London. His research interests are urban computing, human mobility, and transport policy.
Tao Cheng
Tao Cheng is a Professor in GeoInformatics and the Director of SpaceTimeLab at University College London. Her research interests span Space-Time AI, network complexity, and urban analytics.
References
- Angell, C., and D. Potoglou. 2022. ”An Insight into the Impacts of COVID-19 on Work-Related Travel Behaviours in the Cardiff Capital Region and Following the UK’s First National Lockdown.” Cities 124 (July 2021): 103602. doi:10.1016/j.cities.2022.103602.
- Barbieri, D. M., B. Lou, M. Passavanti, C. Hui, I. Hoff, D. Antunes Lessa, G. Sikka, et al. 2021. ”Impact of COVID-19 Pandemic on Mobility in Ten Countries and Associated Perceived Risk for All Transport Modes.” PLoS ONE 16 (2): 1–18 (2 February). doi:10.1371/journal.pone.0245886.
- Basu, R., and J. Ferreira. 2021. ”Sustainable Mobility in Auto-Dominated Metro Boston: Challenges and Opportunities Post-COVID-19.” Transport Policy 103 (February): 197–210. doi:10.1016/j.tranpol.2021.01.006.
- Beck, M. J., and D. A. Hensher. 2020. ”Insights into the Impact of COVID-19 on Household Travel and Activities in Australia – the Early Days Under Restrictions.” Transport Policy 96 (July): 76–93. doi:10.1016/j.tranpol.2020.07.001.
- Bolbol, A., T. Cheng, I. Tsapakis, and J. Haworth. 2012. ”Inferring Hybrid Transportation Modes from Sparse GPS Data Using a Moving Window SVM Classification.” Computers, Environment and Urban Systems 36 (6): 526–537. doi:10.1016/j.compenvurbsys.2012.06.001.
- Department for Transport. 2012. “Guidance on Road Classification and the Primary Route Network.” UK Department for Transport . https://www.gov.uk/government/publications/guidance-on-road-classification-and-the-primary-route-network/guidance-on-road-classification-and-the-primary-route-network
- Department for Transport. 2021a. “Decarbonising Transport - a Better, Greener Britain.” https://assets.publishing.service.gov.uk/government/uploads/system/uploads/attachment_data/file/1009448/decarbonising-transport-a-better-greener-britain.pdf.
- Department for Transport. 2021b. “Gear Change: One Year on.” https://assets.publishing.service.gov.uk/government/uploads/system/uploads/attachment_data/file/1007815/gear-change-one-year-on.pdf.
- Flaxman, S., S. Mishra, A. Gandy, H. Juliette, T. Unwin, T. A. Mellan, H. Coupland, C. Whittaker, et al. 2020. “Estimating the Effects of Non-Pharmaceutical Interventions on COVID-19 in Europe.” Nature 584 (7820): 257–261. doi:10.1038/s41586-020-2405-7.
- Guzman, L. A., J. Arellana, D. Oviedo, and C. Alberto Moncada Aristizábal. 2021. “COVID-19, Activity and Mobility Patterns in Bogotá. Are We Ready for a ‘15-Minute City’?” Travel Behaviour and Society 24 (April): 245–256. doi:10.1016/j.tbs.2021.04.008.
- Hadjidemetriou, G. M., M. Sasidharan, G. Kouyialis, and A. K. Parlikad. 2020. “The Impact of Government Measures and Human Mobility Trend on COVID-19 Related Deaths in the UK.” Transportation Research Interdisciplinary Perspectives 6: 100167. The Authors. doi:10.1016/j.trip.2020.100167.
- Harrington, D. M., and M. Hadjiconstantinou. 2022. “Changes in Commuting Behaviours in Response to the COVID-19 Pandemic in the UK.“ Journal of Transport and Health 24: 101313. doi:10.1016/j.jth.2021.101313.
- HM Government. 2021. “Net Zero Strategy: Build Back Greener.” Gov.Uk . https://www.gov.uk/government/publications/net-zero-strategy
- Kan, Z., M. Po Kwan, J. Huang, M. Sing Wong, and D. Liu. 2021. “Comparing the Space-Time Patterns of High-Risk Areas in Different Waves of COVID-19 in Hong Kong.” Transactions in GIS 25 (6): 2982–3001. doi:10.1111/tgis.12800.
- Kim, J., and M. Po Kwan. 2021. “The Impact of the COVID-19 Pandemic on People’s Mobility: A Longitudinal Study of the U.S. From March to September of 2020.” Journal of Transport Geography 93: 103039. doi:10.1016/j.jtrangeo.2021.103039.
- Kraemer, M. U. G., C. Hung Yang, B. Gutierrez, C. H. Wu, B. Klein, D. M. Pigott, L. du Plessis, et al. 2020. “The Effect of Human Mobility and Control Measures on the COVID-19 Epidemic in China.” Science 368 (6490): 493–497. doi:10.1126/science.abb4218.
- Nguyen, M. H., J. Armoogum, J. Loup Madre, and C. Garcia. 2020. “Reviewing Trip Purpose Imputation in GPS-Based Travel Surveys.” Journal of Traffic and Transportation Engineering (English Edition) 7 (4): 395–412. Amsterdam: Elsevier. doi:10.1016/J.JTTE.2020.05.004.
- Nouvellet, P., S. Bhatia, A. Cori, K. E. C. Ainslie, M. Baguelin, S. Bhatt, A. Boonyasiri, et al. 2021. “Reduction in Mobility and COVID-19 Transmission.” Nature Communications 12 (1): 1–9. doi:10.1038/s41467-021-21358-2
- Nurul Habib, K. M., E. J. Miller, and K. W. Axhausen. 2008. “Weekly Rhythm in Joint Time Expenditure for All At-Home and Out-Of-Home Activities Application of Kuhn-Tucker Demand System Model Using Multiweek Travel Diary Data.” Transportation Research Record 2054 (1): 64–73. doi:10.3141/2054-08.
- Passavanti, M., A. Argentieri, D. Maria Barbieri, B. Lou, K. Wijayaratna, A. Seyed Foroutan Mirhosseini, F. Wang, et al. 2021. “The Psychological Impact of COVID-19 and Restrictive Measures in the World”. Journal of Affective Disorders 283(January): 36–51. Elsevier B.V. doi:10.1016/j.jad.2021.01.020
- Politis, I., G. Georgiadis, E. Papadopoulos, I. Fyrogenis, A. Nikolaidou, A. Kopsacheilis, A. Sdoukopoulos, and E. Verani. 2021. “COVID-19 Lockdown Measures and Travel Behavior: The Case of Thessaloniki, Greece.” Transportation Research Interdisciplinary Perspectives 10: 100345. The Authors. doi:10.1016/j.trip.2021.100345.
- Przybylowski, A., S. Stelmak, and M. Suchanek. 2021. “Mobility Behaviour in View of the Impact of the COVID-19 Pandemic-Public Transport Users in Gdansk Case Study.” Sustainability 13 (1): 1–12. doi:10.3390/su13010364.
- Schmidt, K., T. Sieverding, H. Wallis, and E. Matthies. 2021. “COVID-19 – a Window of Opportunity for the Transition Toward Sustainable Mobility?” Transportation Research Interdisciplinary Perspectives 10: 100374. The Authors. doi:10.1016/j.trip.2021.100374.
- Transport for London. 2020. “Low Traffic Neighbourhoods.” https://www.ealing.gov.uk/info/201268/low_traffic_neighbourhoods.
- Vickerman, R. 2021. “Will Covid-19 Put the Public Back in Public Transport? A UK Perspective.” Transport Policy 103: 95–102. Elsevier Ltd. doi:10.1016/j.tranpol.2021.01.005.
- World Health Organization. 2020. “WHO COVID-19 Dashboard.” https://covid19.who.int/
- Zillinger, M. 2007. “Tourist Routes: A Time-Geographical Approach on German Car-Tourists in Sweden.” Tourism Geographies 9 (1): 64–83. doi:10.1080/14616680601092915.