
 ?Mathematical formulae have been encoded as MathML and are displayed in this HTML version using MathJax in order to improve their display. Uncheck the box to turn MathJax off. This feature requires Javascript. Click on a formula to zoom.
ABSTRACT
The decreasing of Arctic sea ice is projected to continue with global warming, which makes the summer navigation conditions of the Arctic improve. Based on the multi-source remote-sensing data with inter-sensor calibration processing and the ship-based observational data from R/V Xuelong and M/V Yongsheng, the sea ice conditions of the Arctic Northeast Passage (NEP) during the 2002–2021 summer seasons were analyzed, and the navigability of the NEP between July and October from 2002 to 2021 was discussed. Inter-sensor calibration could effectively reduce the deviation from different passive microwave data. Sea ice extent and thickness in the NEP decreased annually, which resulted in the navigability of the NEP showing a potential tendency toward improvement in navigability. The navigation period was mainly concentrated in early August to early October. The middle part of the NEP was primarily affected by sea ice. This influence decreased over time, while the navigation period increased, especially in the Vilkitsky Strait, which is a key shipping area. This analysis of sea ice conditions and navigability in the past 20 years could provide a reference for future scientific investigations and aid in merchant ship navigation in the Arctic summer.
1. Introduction
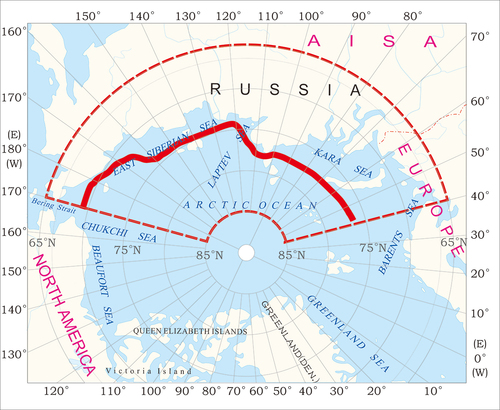
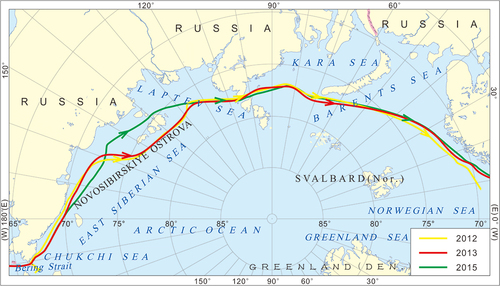
With the acceleration of global warming, Arctic sea ice and glaciers have undergone remarkable mass loss (Chen et al. Citation2019; Gui et al. Citation2019). The Intergovernmental Panel on Climate Change (IPCC) special report on the ocean and cryosphere in a changing climate indicated that the decreasing trend of sea ice would continue, which affecting the global water cycle (Zhang et al. Citation2021). And ice-free regions may soon be periodically present in the Arctic (Fox-Kemper et al. Citation2021). In recent past, the Sea Ice Extent (SIE) and Sea Ice Thickness (SIT) have decreased significantly (Stroeve et al. Citation2007; Polyakov, Walsh, and Kwok Citation2012; Comiso Citation2012), making the opening of the NEP possible. The NEP is a maritime passage starting from Northeast Asia, passing westward through the Chukchi Sea, East Siberia Sea, Laptev Sea, Kara Sea, Barents Sea, until the Nordic regions. The main part of the NEP is located in the offshore area of the Arctic Ocean, such as the northern coastal region of Russia. The primary seas and straits through the NEP and the Eastern Arctic region are shown in . The area highlighted in red is the study area and the red curve shows the NEP.
Figure 1. The primary seas and straits through the NEP and the Eastern Arctic region. The red sector represents the study area and the red curve shows the NEP.
The NEP is the shortest passage connecting Europe and Asia, which acts as a shortcut between the Pacific and Atlantic Ocean. A fully opened NEP would generate huge commercial and economic benefits by shortening the voyage between Asia, Europe and North America (Lei et al. Citation2015). In the summer of 2009, the vessels M/V Vision and M/V Friendship from Germany successfully crossed the entire NEP. The 5th Chinese Natio\nal Arctic Expedition in summer 2012 was the first time that a Chinese scientific expedition ship crossed the NEP (Wang et al. Citation2020). In the summer of 2013 and 2015, M/V YongSheng from China successfully crossed the NEP twice, becoming the first Chinese merchant ship to reach Europe via the NEP, accumulating valuable experience for ocean navigation (Ma et al. Citation2019). In addition, the Arctic sea ice conditions and navigability are priorities that should be given close attention due to their direct influences on the accessibility of Arctic passages (Chen et al. Citation2020).
Rapid and accurate acquisition of large-scale sea ice information around the passage is required to understand the commercial applications of the NEP. Shibata et al. (Citation2011) investigated the navigability of routes through the NEP as a function of sea ice concentration (SIC). The changes of sea ice conditions along the NEP from 1979 to 2012 were analyzed by Lei et al. (Citation2015), which found the navigation period was shorter than expected. Yu et al. (Citation2021) evaluated the influence of air temperature and surface wind on the SIC and determined the navigability of routes. SIT is rarely used in navigability on NEP. Passive microwave remote-sensing data have been widely used in the SIC retrieval and spatiotemporal variation monitoring of sea ice conditions, such as Advanced Microwave Scanning Radiometer-Earth Observation System (AMSR-E), Special Sensor Microwave Imager Sounder (SSMIS) and Advanced Microwave Scanning Radiometer-Enhanced 2 (AMSR2). However, the agreement and consistency of the passive microwave measurements are affected by differences in satellite sensors and platforms, which can lead to discrepancies in the derived long-term brightness temperature and SIC (Liu et al. Citation2018). Sea ice classification based on SAR can also provide a higher resolution reference for NEP (Marbouti et al. Citation2021). Deep learning for change detection in remote sensing is benefit to discriminate different types of sea ice (Heipke and Rottensteiner Citation2020). In this study, the brightness temperature and SIC based on the AMSR-E and AMSR2 are inter-calibrated by the SSMIS, in order to reduce the deviation of different passive microwave remote-sensing data. SIE and SIT were calculated from the inter-calibration results. Subsequently, we analyzed the sea ice conditions and navigability based SIE and SIT in the NEP during the summers from 2002 to 2021, to provide a reference for scientific investigation and merchant ship navigation in the Arctic. Compared with previous studies that mostly concentrated on SIC navigability in the NEP, we took both SIC and SIT into consideration.
2. Data and methods
2.1. Passive microwave remote-sensing data
In this study, we used the passive microwave remote-sensing data from the July to October period from 2002 to 2021, including brightness temperature data for SIC, SIE, and SIT retrieval. The brightness temperature data including AMSR-E data were collected by the Aqua satellite (http://nsidc.org/data/AE_SI12; http://nsidc.org/data/AE_SI6), SSMIS data were collected by the U.S. Defense Meteorological Satellite Program DMSP-17 satellite (http://nsidc.org/data/NSIDC-0001), produced by the US National Snow and Ice Data Center (NSIDC). We also included AMSR2 data (https://seaice.uni-bremen.de/data/amsr2/tb_daygrid_swath/n6250; https://seaice.unibremen.de/data/amsr2/tb_daygrid_swath/n12500) collected by the Japanese GCOM-W1 satellite and produced by the Bremen University.
shows the information of the passive microwave remote -sensing data used in this study. AMSR-E and AMSR2 contains 36 GHz and 89 GHz bands, SSMIS contains 91 GHz and 37 GHz bands. The spatial resolution of 89 GHz is 6.25 km × 6.25 km, 91 GHz and 36 GHz are 12.5 km × 12.5 km, and that of 37 GHz is 25 km × 25 km. The daily SIC data are produced by the Bremen University () and calculated by the ARTIST sea ice (ASI) algorithm. The spatial resolution of these data is 6.25 km × 6.25 km. The NSIDC Sea Ice Polar Stereographic North projection was used in this study.
Table 1. Information of the passive microwave remote-sensing data.
2.2. Ship-based observational SIC data
In this study, the ship-based observational SIC data were produced by R/V Xuelong in 2012 and M/V Yongsheng in 2013 and 2015 during their voyages. These data combined with satellite data were used to analyze the navigability of the NEP in summer. Arctic Ship-based Sea Ice Standardization Tool (ASSIST) was used to generate SIC data, with the observation ship as the center, the sea ice within a radius of 1 km was observed, and the location of ship, SIC, and sea ice type were recorded.
2.3. Inter-calibration method
In this paper, we used three different radiometer datasets, AMSR-E, SSMIS, and AMSR2, to observe the long time series of the NEP. All of these were pretreated by format conversion, resampling, geometric correction, masking and projection definition. It is necessary to calibrate the data from different sensors so that the observed values can be highly consistent, i.e. inter-calibration must be performed (Geng et al. Citation2020). The inter-calibration was based on the overlap time of two kinds of data, and the linear regression model was obtained using all points for fitting regression and calculating the linear regression coefficient.
The specific equations for the inter-calibration of the brightness temperature data are EquationEquations 1(1)
(1) and Equation2
(2)
(2) :
where is the SSMIS brightness temperature,
is the AMSR-E brightness temperature,
is the SSMIS brightness temperature,a and c are the slope, b and d are the intercept.
The inter-calibration formula for the SIC is the same as the inter-calibration formula for the brightness temperature data. To ensure the optimization of the fitting results, linear regression was performed for each month’s data. Each band will get four linear regression model for different months, from July to October, respectively. And the difference between before and after the inter-calibration of the observed data was comprehensively evaluated through the Mean Absolute Deviation (MAD).
2.4. Spatiotemporal variation analysis method
When using the SIC to calculate the SIE, the threshold value used by the Bremen University is generally 15%, which means the SIE is equal to the sum of all grid points greater than 15%. For example, if the image spatial resolution is 6.25 km and the number of SIC points greater than 15 is N, then the SIE is N × 6.25 km × 6.25 km.
Here, we used the thin sea ice thickness algorithm for the Arctic Ocean developed by Iwamoto, Ohshima, and Tamura (Citation2014) to estimate SIT. This method was previously validated in the Chukchi Sea (Iwamoto et al. Citation2013) and has been shown to estimate the SIT to a resolution of up to 0.3 m and is suitable for the entire Arctic Ocean region. The algorithm uses 36 GHz and 89 GHz vertical and horizontal polarization of the brightness temperature data. The polarization ratio (PR) is calculated as the ratio of polarized brightness temperature difference to the polarized brightness temperature sum. Subsequently, the thickness is estimated by the polarization ratio. Taking 36 GHz as an example, can be expressed as
where 36 indicates the band of the brightness temperature data (in GHz), TB is the brightness temperature value, v and h represent the vertical polarization and horizontal polarization, respectively.
The SIT was calculated by the following equations:
where represents the SIT, and
and
represent the polarization ratio of 36 GHz and 89 GHz, respectively.
In the part of SIT calculated by EquationEquation (4)(4)
(4) (
), where the pixels with PR89 greater than 0.11 represent open waters, and the part of SIT calculated by EquationEquation (5)
(5)
(5) (
) represent the SIC is less than 15% but is not open water. EquationEquation (4)
(4)
(4) was used to calculate the SIT less than 0.1 m, and EquationEquation (5)
(5)
(5) was used to calculate the SIT more than 0.1 m.
2.5. NEP navigability analysis method
In the analysis of navigability in the NEP, we consider that the impact of SIC and SIT are the most important parameters affecting ship navigation; thus, in this paper, we combined the two parameters to establish a navigation standard.
The SIC threshold was set at 50% (Lei et al. Citation2015), while the SIT threshold is 30 cm (Liu et al. Citation2015). That is, regions where the SIC is less than or equal to 50% and the SIT is less than or equal to 30 cm are defined as navigable. The navigation standard is used to calculate the number of navigation period days per year in each region of the passage, reflecting the navigable conditions of each region.
3. Results
3.1. Inter-calibration of brightness temperature data
3.1.1. AMSR-E and SSMIS
The brightness temperature data observed during the overlap period between AMSR-E and SSMIS (From 1 July 2010 to 4 October 2011) were used to construct the inter-calibration model (EquationEquations 1(1)
(1) and Equation2
(2)
(2) ). shows the model coefficients. The R2 of linear regression model for each band are above 0.65, indicating a strong data match. The slopes of all the 36 GHz models are close to 1, which has a better consistency than the 89 GHz models.
Table 2. Linear regression coefficients for AMSR-E and SSMIS brightness temperature data.
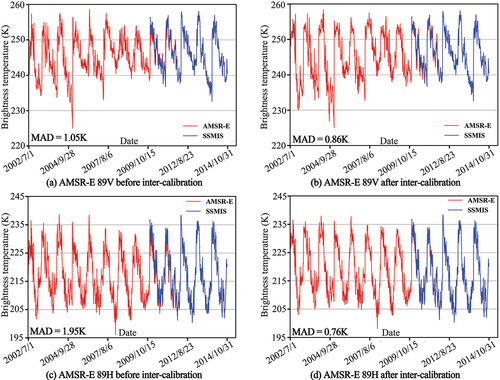
shows the daily average brightness temperature profile of 89 GHz band and comparative results before and after inter-calibration. The AMSR-E and SSMIS brightness temperature data have a certain degree of deviation before calibration, but there is obvious consistency in the overall trend. After inter-calibration, it can be found that the decrease of MAD in V polarization band is small, and the MAD of 89 GHz was reduced by 0.19 K ()). The decrease in H polarization band is larger, and the MAD of 89 GHz was reduced by 1.19 K ()).
Figure 2. Comparison of daily average brightness temperature before and after inter-calibration for AMSR-E and SSMIS.
3.1.2. AMSR2 and SSMIS
The overlap period between AMSR2 and SSMIS ran from 1 July 2012 to 31 October 2014, and the inter-calibration model coefficients are shown in . The R2 of linear regression model for each band is above 0.68, indicating strong correlation of the matching data. Except for the 89 V band, the slopes of the bands are close to 1, indicating that most of the data had a strong consistency.
Table 3. Linear regression coefficients for AMSR2 and SSMIS brightness temperature data.
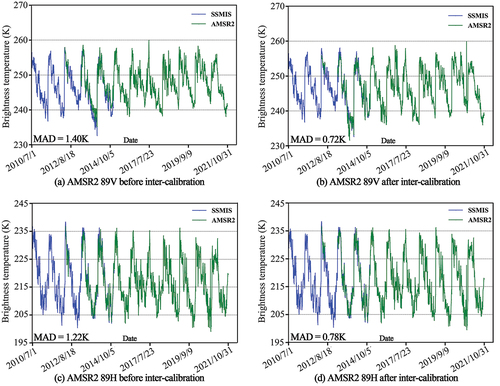
shows the daily average brightness temperature profile of 89 GHz band and comparative results before and after inter-calibration. After inter-calibration, the consistency of the two data sets improved significantly. The decrease of V polarization band was larger, and the MAD of 89 GHz was reduced by 0.68 K (). The decrease of the H polarization band is smaller, and the MAD of 89 GHz was reduced by 0.44 K ()). This indicates that the difference between multi-generation and multi-series passive microwave remote-sensing data is significantly reduced by inter-calibration, and the long time series observation with better consistency is obtained, which lays a foundation for the retrieval of SIE and SIT.
Figure 3. Comparison of daily average brightness temperature before and after calibration for AMSR2 and SSMIS.
3.2. Spatiotemporal variation of SIE in the NEP
3.2.1. Variation of daily SIE
shows the daily SIEs in the NEP from 2002 to 2016 summer (July to October), which were calculated by the brightness temperature data after inter-calibration (based on the method in Section 2.4).
Figure 4. Variation of daily SIE from July to October of 2002–2006.
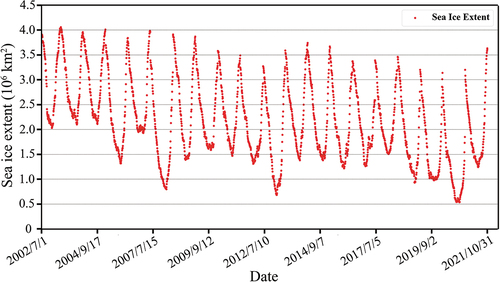
These results show that the larger SIE appears in early July or the end of October, indicating that sea ice begun to melt in early July, and begun to freeze in the end of October. The smaller SIE appears in the mid- or late September, which falls at the end of the melting process. The SIE in summer decreased annually and this trend is consistent with the Special Report on the Ocean and Cryosphere in a Changing Climate released by the IPCC 2019 (Pörtner et al. Citation2019).
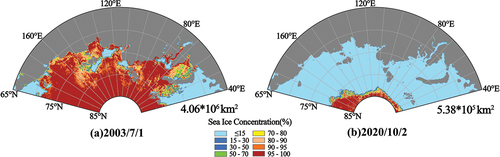
The maximum SIE value over the past 20 years was 4.06 × 10⁶ km2 on 1 July 2003, and the minimum SIE value was 0.538 × 10⁶ km2 on 2 October 2020 (). Our results show that the SIC is mostly greater than 90% on the maximum day (1 July 2003), making it impossible to navigate in the NEP, while on the minimum day (2 October 2020), the NEP is essentially opened and ships are free to sail.
Figure 5. Maximum and minimum SIC during 2002–2021.
3.2.2. Inter-annual variation of monthly average SIE
shows the time series variation of the monthly average SIE from 2002 to 2021 in summer (from July to October). During the study period, the monthly average SIE in the NEP presented a decreasing trend. The maximum monthly average SIE was 4 × 10⁶ km2 appears in July 2003, and the minimum monthly average SIE was 0.685 × 10⁶ km2 in September 2020, with a difference of 3.315 × 10⁶ km2.
Figure 6. Variation of Monthly average SIE from July to October of 2002–2021.
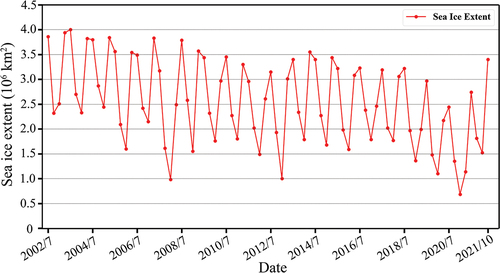
Except for 2002, September was the month with the smallest SIE in each year during the study period, and is therefore the optimum time for navigation. In order to analyze the navigability each year, the inter-annual variation of monthly average SIE in September is ploted in .
Figure 7. Monthly average SIE in September of 2002–2021.
The SIE decreased as a whole during the past 20 years, but changed greatly from year to year. The SIC was larger than other years in September of 2002, 2003, 2004, and 2006. During those times, the key area affecting the opening of the NEP was the sea areas around Severnaya Zemlya where the straits are covered by sea ice, where the SIC is more than 50%. In addition, although the SIE is fairly small in 2007 and 2013, there are some sea ice around the Severnaya Zemlya, affecting thesis accessibility through the Strait. In other years in September, the ship can basically sail along the NEP.
3.2.3. Variation of multi-year average SIE
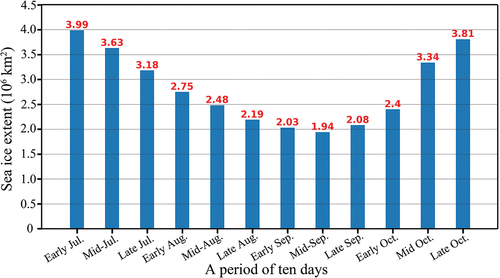
The multi-year average SIE for each ten-day period from 2002 to 2016 summer (July to October) was calculated from the multi-year average SIC (). It can be seen that the maximum SIE appears in early July and the minimum SIE appears in mid-September. The range of SIE varies between 2.03× and 3.99×
. The SIE in the NEP showed obvious seasonal variation; the sea ice begins to melt in early July, the SIE reaches the minimum in mid-September, then sea ice freezes and expands from mid-September to late October.
Figure 8. Variation of multi-year average SIE per ten days from July to October of 2002–2021.
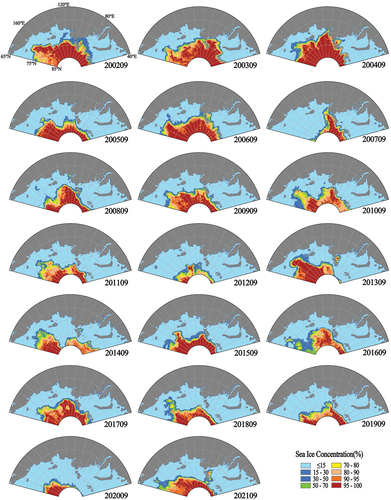
In order to show the multi-year average SIE per ten days and SIC distribution in the NEP area in more detail, the spatial distribution of multi-year average SIC per ten days was obtained ().
Figure 9. Multi-Year average SIC per ten days from July to October of 2002–2021.
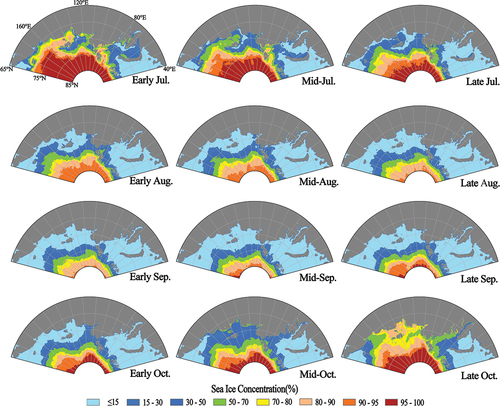
From early July to mid-July, all the sea areas and straits were largely covered by sea ice with a large SIC, except for the Barents Sea and the sea areas around Novaya Zemlya. By the end of July, the melting of sea ice in the De Lang Strait and straits near the New Siberian Islands is significant, and the SIC falls below 50%, meaning the opening of the NEP is becoming possible. At this time, the key area that affects the complete opening of the NEP is the sea and straits around Severnaya Zemlya. In early August, the melting of sea ice in the Vilkitskogo Strait is significant; in early September, the SIC falls below 15%, and the sea ice basically disappeared, the NEP is widely opened. In early October, the refreezing of sea ice is significant, and in mid-October the passage is completely covered by sea ice at a concentration of more than 40%. At that time, The Shokalsky Strait, the Red Army Strait, the Yansk Strait are covered by sea ice, and the SIC falls between 30% and 40%, even when the sea ice condition is best. Thus, using SIC as the only factor to determine navigability, the most likely time for the fully opened NEP is from early August to mid-October.
3.3. Spatiotemporal variation of SIT in the NEP
3.3.1. Estimation of daily SIT
Based on the brightness temperature data after inter-calibration, the spatial distribution of daily SIT from July to October of 2002–2021 was calculated using the thin sea ice thickness algorithm for the Arctic Ocean. shows the daily average thin SIT time series.
Figure 10. Variation of daily average thin SIT from July to October of 2002–2021.
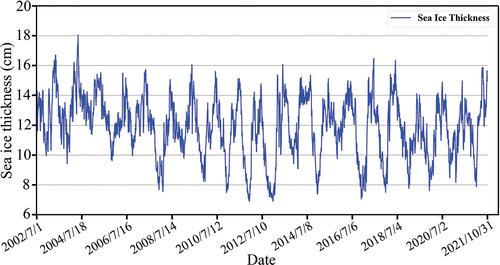
The maximum thin SIT falls in early July or the end of October, and the minimum value falls in the end of August or early September. The variation of thin SIT with time is similar to that of SIC with time during summer. The maximum SIT was 18.04 cm, which was observed in 27 October 2003, and the minimum value was 6.89 cm which was observed in 3 September 2011().
Figure 11. Spatial distribution of the maximum and minimum SIT.
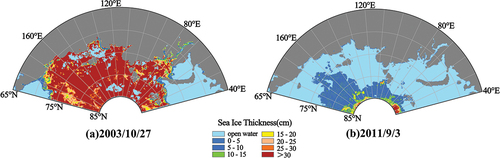
In contrast to ), it can be seen that all the areas are basically covered by sea ice with thickness greater than 30 cm at the maximum day (27 October 2003), except for the Chukchi Sea, the western part of Kara Sea and Barents Sea, meaning navigation is impossible at this time. At the minimum day (3 September 2011), the passage is comprised of open water, meaning ships are free to sail.
3.3.2. Variation of multi-year average SIT
shows the spatial distribution of the multi-year average SIT per ten days, which reflects the spatiotemporal variation of SIT during past 20 years.
Figure 12. Spatial distribution of multi-year average SIT per ten days from July to October of 2002–2021.
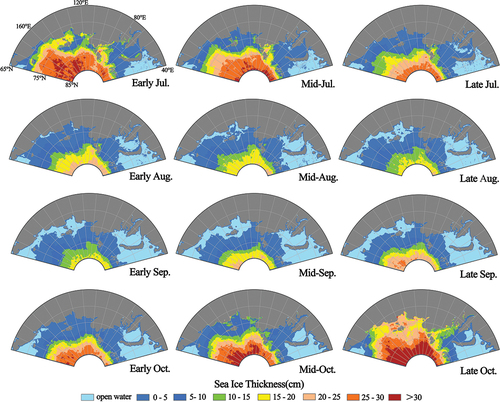
The thicker sea ice begins to melt in early July and refreezes in mid-October. In early July and mid-July, the sea ice in the Chukchi Sea, the western part of Kara Sea and the Barents Sea is thin, while the east side of the Novaya Zemlya is covered by thicker sea ice, and other sea areas and straits are covered by sea ice with a thickness of more than 30 cm. By the end of July, except for the northeastern part of the Kara Sea and the sea areas around Severnaya Zemlya, sea ice in other areas begins to melt. Hence, the possibility of the NEP opening in these areas becomes larger. At that time, the key area affecting the complete opening of the NEP is the area around Severnaya Zemlya. In early August, thick sea ice in the Vilkitskogo Strait begins to melt and the SIT dropped below 10 cm, until early October, when the sea ice start to refreeze. In mid-October, the passage is basically covered by sea ice greater than 30 cm in thickness; many regions, including the Shokalsky Strait, the Red Army Strait, the Yansk Strait, and the Arctic Cape in the north side of the Severnaya Zemlya are completely covered by thick sea ice, until mid-September, when the SIT decreases to the lowest level of about 10 cm. This period of thin sea ice is very short, and as soon as early October, these areas are covered by thick ice. In order to analyze the navigation of the NEP, the SIC and SIT should be considered together.
3.4. Navigability analysis of the NEP
3.4.1. Navigation period of the NEP in summer
The SIC after inter-calibration and SIT retrieved by passive microwave remote-sensing data were used to calculate the navigable days from July to October of 2002 to 2021 in the NEP; the spatiotemporal distribution is shown in
Figure 13. Navigation period of the NEP in summer seasons of 2002–2021.
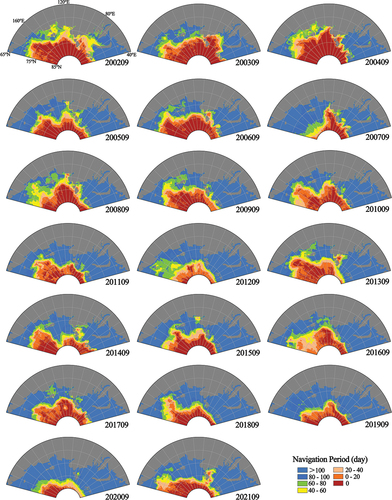
The eastern part of the NEP, including the Chukchi Sea, the De Lang Strait, the East Siberian Sea, the straits near the New Siberian Islands, and the eastern part of the Laptev Sea are easily navigable. From 2002 to 2021, the navigation period of the eastern part remained more than 40 days, while there was no significant change overall. The year of 2020 presented the longest navigation period.
The middle part of the NEP, including the western part of the Laptev Sea, the sea areas and straits around Severnaya Zemlya, and the eastern part of the Kara Sea are relatively hard to navigate. Except for 2003, the navigation in the western Laptev Sea between 2002 and 2021 was more difficult than the eastern part of the Kara Sea, which is a key area affecting the opening of the NEP. The low-latitude route across the Velikitsky Strait was basically navigable in all years except 2003 and 2004, while the high-latitude route bypassing the Arctic Cape in the northern side of the Severnaya Zemlya was basically navigable in 2005, 2009, 2011–2014, and 2016. The navigation period in the middle of NEP varied greatly from year to year, sometimes reaching more than 60 days (2012), and sometimes extending less than 20 days (2004). The navigation of the middle of the NEP showed an overall trend of improving over time, with the navigation period extending.
The western part of the NEP, including the west of the Kara Sea, the sea areas around the Novaya Zemlya and the Barents Sea, is the best route with the least amount of sea ice and the longest navigation period. The length of the navigation period reached 80 days each year, accounting for more than 65% of the summer days from 2002 to 2021. The overall navigation performance of this route shows an ideal trend to shipping. Overall, the length of navigation period increased continuously, except 2013.
3.4.2. Navigability analysis based on the data observed in cruises
The sea areas and straits through which R/V XueLong during 21 July 2012 to 1 August 2012 and M/V YongSheng during 28 August 2013 to 4 September 2013 and 2 August 2015 to 12 August 2015 passed in this study are shown in .
Figure 14. Navigation routes for the NEP in 2012, 2013, and 2015.
Using the navigation period map of 2012, 2013, and 2015 as the base maps, and overlaying the ship route with observed SIC data to the base map, we plotted the pathway maps ().
Figure 15. Navigation period and ship routes in 2012, 2013, and 2015. (a) Navigation period and R/V XueLong route in 2012; (b) Navigation period and M/V YongSheng route in 2013; (c) Navigation period and M/V YongSheng route in 2015.
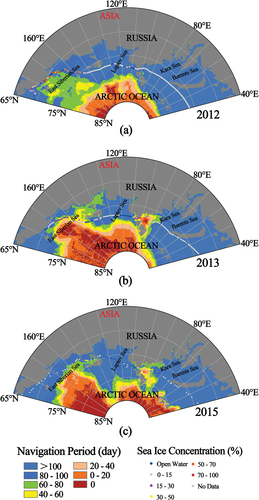
In ), sea ice and navigation conditions were relatively good in 2012, but in the western part of the Delang Strait, the SIC reached more than 70%, which is consistent with the distribution of the navigation period. As shown in ), the navigation period in the northern part of the New Siberian Islands reached more than 60 days; thus, in 2013, M/V Yongsheng was able to reach the northern part of the New Siberian Islands directly. In the western part of the Vilkitskogo Strait, M/V Yongsheng encountered sea ice with more than 70% SIC, for which the navigation period in the summer was less than 20 days. From , it can be found that sea ice conditions in 2015 was better than in 2013. When entering the Sannikov Strait from the East Siberian Sea, the SIC reached 40%, but this had little impact on ship navigation. In the western part of the Vilkitskogo Strait, which was full of sea ice in 2013, there was almost no sea ice in 2015 and navigation conditions were significantly improved. According to the above analysis based on the data of three routes, the SIC measured by ships essentially corresponds to the classification of the navigation period distribution, and the sailing routes of ships were essentially consistent.
4. Conclusions
Herein, based on the inter-calibration of multi-generation and multi-series passive microwave remote-sensing data, the SIE and SIT of the NEP were retrieved during the summer of 2002 to 2021, and we subsequently analyzed the spatiotemporal variation and navigation of the NEP. The main conclusions are as follows:
There is a certain degree of deviation among AMSR-E, SSMIS, and AMSR2 passive microwave brightness temperature data, and the deviation is significantly reduced by inter-calibration, which can obtain long time series brightness temperature data with better consistency.
The SIE and SIT of the NEP decrease year by year and regularly change with the season. Sea ice begins to melt in early July and reaches its minimum extent in mid-September. On the whole, the sea ice from early August to early October is relatively sparse and navigation conditions are good; thus, this is the optimal time window for safe navigation in the NEP. The middle section of the NEP is the key area limiting navigation. Over the past 20 years, from 2002 to 2021, the influence of sea ice on the eastern and middle parts of the NEP has decreased significantly, and the navigation period has consequently increased over time.
For the NEP, the key areas affected by the SIE and SIT are the same, including the Vilkitskogo Strait, the Shokalsky Strait, the Red Army Strait, and the Yansk Strait. The sea ice varies greatly in the Vilkitskogo Strait; therefore, it should be carefully monitored to guarantee the safe navigation of ships in the NEP. This study quantified and evaluated the sea ice conditions and navigability of the NEP in the past 20 years, provided theoretical and data support for the further research about navigation and sea ice in the Arctic.
Acknowledgements
The authors would like to thank the NSIDC and the Bremen University for providing SSMIS, AMSR-E, and AMSR2 data. The authors acknowledge R/V Xuelong and M/V Yongsheng for providing SIC observation data for validation. Comments from anonymous referees and the subject editor are also gratefully appreciated.
Disclosure statement
No potential conflict of interest was reported by the author(s).
Data availability statement
The AMSR-E and SSMIS dataset that support the findings of this study is openly available in https://nsidc.org/data/AE_SI12 and https://nsidc.org/data/NSIDC-0001 by the NSIDC, and the AMSR2 dataset that support the findings of this study is openly available in https://seaice.uni-bremen.de/data/amsr2 by the Bremen University. The ship-based SIC dataset that support the findings of this study is available from the corresponding author, upon reasonable request.
Additional information
Funding
Notes on contributors
Xiaoping Pang
Xiaoping Pang is a Professor with Chinese Antarctic Center of Surveying and Mapping, Wuhan University. She received the PhD from Wuhan University. Her research interests are polar remote sensing and mapping.
Chenlei Zhang
Chenlei Zhang is currently working toward the PhD in Wuhan University. His research field includes snow parameter remote sensing.
Qing Ji
Qing Ji is an associate professor with Chinese Antarctic Center of Surveying and Mapping, Wuhan University. He received the PhD from Wuhan University. His research interests are polar sea ice and snow cover remote sensing.
Yizhuo Chen
Yizhuo Chen is currently working toward the PhD in Wuhan University. He is interested in satellite altimetry application.
Zeng Zhen
Zeng Zhen is currently working toward the master degree in Wuhan University. Her research field includes polar surveying and mapping.
Yamin Zhu
Yamin Zhu received her master degree from Wuhan University. Her research interests are polar snow cover remote sensing.
Zhongnan Yan
Zhongnan Yan is currently working toward the PhD degree in Wuhan University. He is interested in passive microwave remote sensing.
References
- Chen, J., S. Kang, C. Chen, Q. You, W. Du, M. Xu, X. Zhong, W. Zhang, and J. Chen. 2020. “Changes in Sea Ice and Future Accessibility Along the Arctic Northeast Passage.” Global and Planetary Change 195: 103319. doi:10.1016/j.gloplacha.2020.103319.
- Chen, J., S. Kang, X. Meng, and Q. You. 2019. “Assessments of the Arctic Amplification and the Changes in the Arctic Sea Surface.” Advances in Climate Change Research 10 (4): 193–202. doi:10.1016/j.accre.2020.03.002.
- Comiso, J. 2012. “Large Decadal Decline of the Arctic Multiyear Ice Cover.” Journal of Climate 25 (4): 1176–1193. doi:10.1175/JCLI-D-11-00113.1.
- Fox-Kemper, B., H. Hewitt, C. Xiao, G. Aðalgeirsdóttir, S. Drijfhout, T. Edwards, N. Golledge, et.al. 2021. “Ocean, Cryosphere and Sea Level Change. In Climate Change 2021: The Physical Science Basis. Contribution of Working Group I to the Sixth Assessment Report of the Intergovernmental Panel on Climate Change.” Cambridge University Press. In Press. https://www.ipcc.ch/report/ar6/wg1/downloads/report/IPCC_AR6_WGI_Chapter09.pdf.
- Geng, J., W. Gan, J. Xu, R. Yang, and S. Wang. 2020. “Support Vector Machine Regression (SVR)-Based Nonlinear Modeling of Radiometric Transforming Relation for the Coarse-Resolution Data-Referenced Relative Radiometric Normalization (RRN).” Geo-Spatial Information Science 23 (3): 237–247. doi:10.1080/10095020.2020.1785958.
- Gui, D., X. Pang, R. Lei, and X. Zhao. 2019. “Changes in Sea Ice Kinematics in the Arctic Outflow Region and Their Associations with Arctic Northeast Passage Accessibility.” Acta Oceanologica Sinica 38 (8): 101–110. doi:10.1007/s13131-019-1451-1.
- Heipke, C., and F. Rottensteiner. 2020. “Deep Learning for Geometric and Semantic Tasks in Photogrammetry and Remote Sensing.” Geo-Spatial Information Science 23 (1): 10–19. doi:10.1080/10095020.2020.1718003.
- Iwamoto, K., K. Ohshima, and T. Tamura. 2014. “Improved Mapping of Sea Ice Production in the Arctic Ocean Using AMSR‐E Thin Ice Thickness Algorithm.” Journal of Geophysical Research: Oceans 119 (6): 3574–3594. doi:10.1002/2013JC009749.
- Iwamoto, K., K. Ohshima, T. Tamura, and S. Nihashi. 2013. “Estimation of Thin Ice Thickness from AMSR-E Data in the Chukchi Sea.” International Journal of Remote Sensing 34 (2): 468–489. doi:10.1080/01431161.2012.712229.
- Lei, R., H. Xie, J. Wang, M. Leppäranta, I. Jónsdóttir, and Z. Zhang. 2015. “Changes in Sea Ice Conditions Along the Arctic Northeast Passage from 1979 to 2012.” Cold Regions Science and Technology 119: 132–144. doi:10.1016/j.coldregions.2015.08.004.
- Liu, Y., H. Fan, X. Jiang, and Q. Zhao. 2015. “Evaluation on Northern Sea Route Navigation Environment.” In 2015 International Conference on Mechatronics, Electronic, Industrial and Control Engineering (MEIC-15), 515–521. Atlantis Press. doi:10.2991/meic-15.2015.119.
- Liu, Q., Q. Ji, X. Pang, X. Gao, X. Zhao, and R. Lei. 2018. “Inter-Calibration of Passive Microwave Satellite Brightness Temperatures Observed by F13 SSM/I and F17 SSMIS for the Retrieval of Snow Depth on Arctic First-Year Sea Ice.” Remote Sensing 10 (1): 36. doi:10.3390/rs10010036.
- Ma, L., L. An, X. Zhang, Z. Zheng, Z. Li, and G. Chen. 2019. “Navigable Window Dataset of the Arctic Northeast Passage (2006-2015).” Global Change Research Data Publishing & Repository 3: 244–251. doi:10.3974/geodp.2019.03.04.
- Marbouti, M., O. Antropov, J. Praks, P. B. Eriksson, V. Arabzadeh, E. Rinne, and M. Leppäranta. 2021. “TanDem-X Multiparametric Data Features in Sea Ice Classification Over the Baltic Sea.” Geo-Spatial Information Science 24 (2): 313–332. doi:10.1080/10095020.2020.1845574.
- Polyakov, I., J. Walsh, and R. Kwok. 2012. “Recent Changes of Arctic Multiyear Sea Ice Coverage and the Likely Causes.” Bulletin of the American Meteorological Society 93 (2): 145–151. doi:10.1175/BAMS-D-11-00070.1.
- Pörtner, H., D. Roberts, V. Masson-Delmotte, P. Zhai, M. Tignor, M. Poloczanska, and N. Weyer. 2019. “The Ocean and Cryosphere in a Changing Climate: An IPCC Special Report 2019.” The Intergovernmental Panel on Climate Change (IPCC). http://academics.casad.cas.cn/xsjl/kxyjsqylt/2020/d106c/202101/t20210109_4560199.html.
- Shibata, H., K. Tateyama, H. Enomoto, and S. Takahashi. 2011. “Interannual Changes in Sea-Ice Conditions on the Arctic Sea Route Obtained by Satellite Microwave Data.” Annals of Glaciology 52 (58): 237–247. doi:10.3189/172756411797252329.
- Stroeve, J., M. Holland, W. Meier, T. Scambos, and M. Serreze. 2007. “Arctic Sea Ice Decline: Faster Than Forecast.” Geophysical Research Letters 34 (9). doi:10.1029/2007GL029703.
- Wang, D., J. Guo, A. Chen, L. Bian, M. Ding, L. Liu, Y. Lv, J. Li, X. Guo, and Y. Han. 2020. “Temperature Inversion and Clouds Over the Arctic Ocean Observed by the 5th Chinese National Arctic Research Expedition.” Journal of Geophysical Research: Atmospheres 125 (13): e2019JD032136. doi:10.1029/2019JD032136.
- Yu, M., P. Lu, Z. Li, Q. Wang, and X. Cao. 2021. “Sea Ice Conditions and Navigability Through the Northeast Passage in the Past 40 Years Based on Remote-Sensing Data.” International Journal of Digital Earth 14 (5): 555–574. doi:10.1080/17538947.2020.1860144.
- Zhang, J., Q. Hu, Y. Li, H. Li, and J. Li. 2021. “Area, Lake-Level and Volume Variations of Typical Lakes on the Tibetan Plateau and Their Response to Climate Change, 1972–2019.” Geo-Spatial Information Science 24 (3): 458–473. doi:10.1080/10095020.2021.1940318.