
 ?Mathematical formulae have been encoded as MathML and are displayed in this HTML version using MathJax in order to improve their display. Uncheck the box to turn MathJax off. This feature requires Javascript. Click on a formula to zoom.
ABSTRACT
Urban Green Spaces (UGSs) can provide social and ecological benefits, and the coordination of these two functions will largely advance human-nature harmony in cities. As such, we proposed a comprehensive framework to evaluate UGSs multifunctionality, i.e. the coupling coordination relationship of ecological connectivity and spatial accessibility of UGSs. Wuhan City in Central China was taken as a case study, and multiple ecosystem service values of green space patches and the disordered use of UGSs multifunctionality were explored. The results demonstrated low-level coupling coordination of UGSs multifunctionality in Wuhan. More than 70% of UGSs were imbalanced, 27.91% of which featured small sizes, low connectivity and accessibility. We suggest that planners should optimize UGSs arrangement to improve species reachability, especially for species with dispersal distance less than 4 km, and to create 15-minute community life circles for residents at the same time. Our findings are expected to support the promotion of UGSs multifunctionality and the balance of urban development and habitat conservation.
1. Introduction
Urban Green Spaces (UGSs) can simultaneously provide social and ecological functions (Barbosa et al. Citation2007; Cetin Citation2015). On the one hand, green space sustains various ecosystem services supporting sustainable urban development, for instance, oxygen release and carbon storage, cooling and humidification, pollutants absorption, water and soil conservation, and biodiversity protection (Lovell and Taylor Citation2013; Aronson et al. Citation2017; Immergluck and Balan Citation2018; Zhan, Yang, and Liu Citation2022). On the other hand, it also benefits urban residents with various social services in terms of recreation, aesthetics culture, disaster prevention and science popularization (Douglas, Lennon, and Scott Citation2017; Cetin et al. Citation2018). However, green spaces in cities have been largely threatened by rapid urban expansion and excessive population agglomeration (Chi, Shi, and Kuang Citation2015), which have led to the degradation of UGS ecosystem services such as biodiversity conservation, pollination, and plant evolution (Carrete et al. Citation2009; Zhao et al. Citation2015). Meanwhile, human needs for social and cultural services provided by UGSs have been greatly accelerated by urban development (Nielsen and Hansen Citation2007). In this context, comprehensive utilization of scarce UGS resources to better provide social and ecological services has become an urgent issue (Cetin Citation2015; Li, Liu, and He Citation2022).
Among various social and ecological functions of UGSs, biodiversity conservation and recreation provision are two key functions for urban species and residents. These two functions usually demonstrate a significant trade-off with each other. For example, trampling of green spaces by tourists may reduce soil organic carbon, water content, and the biomass of fallen leaves, thereby undermining the natural vegetation structure and threatening species’ survival (Sarah and Zhevelev Citation2007). In turn, UGSs conservation may weaken its recreational function for citizens (Dearborn and Kark Citation2010). This trade-off relationship will be increasingly intensified with the degradation and loss of UGSs. However, traditional urban planning usually highlights separated UGS functions demanded by different government departments while overlooks the interrelationship of UGSs multi-functions. To address this issue, active human interventions with respect to multifunctional coordination should be incorporated into urban green space planning (Setala et al. Citation2014).
Effective measurement of biodiversity conservation and recreational services of UGSs can provide a scientific basis for the multi-functional promotion of UGSs. Scholars have widely adopted landscape connectivity as a type of measurement approach for biodiversity conservation to indicate how urban UGSs facilitate or impede species movements (Taylor et al. Citation1993; Beninde, Veith, and Hochkirch Citation2015), as well as mitigate the urban heat island effect (Yu et al. Citation2021). The measurement of landscape connectivity can be categorized into observation-based approaches and model simulation approaches. In contrast, model simulation approaches, e.g. graph theory and minimum cumulative resistance analysis, have attracted increasing attention due to their low data requirement. These methods can identify potential ecological sources and dispersal corridors of the target species (Kong et al. Citation2010; Wang and Liu Citation2019), and can also provide biodiversity conservation guidelines via multiple scenario analysis (Zhang et al. Citation2019; Ayram et al. Citation2016; Dai et al. Citation2017; Selim and Demir Citation2019). Spatial accessibility, a general evaluation of recreational service, indicates the social equity of UGSs exposure to different resident groups (Rigolon Citation2016; Van Herzele and Wiedemann Citation2003; Ekkel and de Vries Citation2017; Rigolon, Browning, and Jennings Citation2018; Nesbitt et al. Citation2019). The promotion of spatial accessibility of UGSs will also benefit human health, primarily for stress reduction and attention recovery in mental health, as well as risk reduction of chronic diseases and human microbiome enrichment in physical health(Zhang et al. Citation2022). Although the biodiversity conservation and recreational service of UGSs have been extensively measured, their coordination relationships still need an in-depth exploration (Belmeziti, Cherqui, and Kaufmann Citation2018; Derkzen, van Teeffelen, and Verburg Citation2015).
To narrow the above-mentioned research gap, this article proposes an integrated evaluation framework of ecological connectivity and spatial accessibility of UGSs. Wuhan city in Central China was taken as a case study due to its urgent requirement for biodiversity protection and high-quality development. Specifically, we evaluated the ecological connectivity of UGSs for different target species based on the InVEST and Minimum Cumulative Resistance (MCR) model and assessed the spatial accessibility through different travel modes using Gaussian-based Floating Catchment Area (GFCA) analysis. Then, we calculated the degree of coordination between the two ecosystem services to inform differentiated protection of UGSs.
2. Study area and data
2.1. Study area
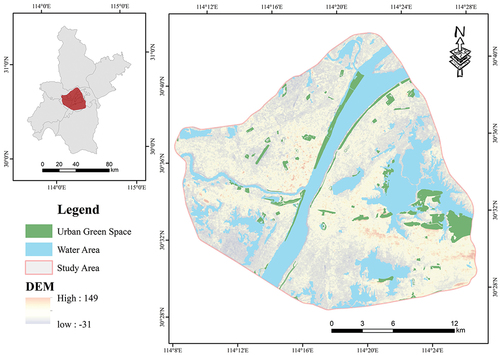
The urban center of Wuhan City was selected as the study area (). This region covers 678 km2 and features the maximum population density in Wuhan. The area of UGSs reaches 224 km2 with a total of 81 parks, and the per capita area is approximately 9.61 m2 due to a series of green space protection policies since 2001. However, the region has faced several challenges concerning fair exposure and species conservation of UGSs (Xing, Liu, and Liu Citation2018; Xing et al. Citation2018). Rapid urban expansion has caused an evident gap in supply and demand of UGSs and significant habitat fragmentation.
Figure 1. Spatial distribution of green space in Wuhan.
2.2. Data sources and processing
The vector data of UGSs in 2018 were downloaded from the Open Street Map (http://download.geofabrik.de/). The Points of Interests (POI) of UGSs were collected from Baidu POI, indicating Park Green Spaces (PGSs) and Attached Green Spaces (AGSs, referred to as golf courses, colleges, museums, and squares). Land use map in 2018 at a spatial resolution of 30 m was obtained from the Resource and Environmental Science Data Center of the Chinese Academy of Sciences (http://www.resdc.cn), categorized into seven types: water area, forestland, grassland, cultivated land, residential land, industrial and transportation land, and unused land. The overall accuracy of the land-use data classification assessed via field survey was reported to be higher than 91.20% (Yang and Huang Citation2021). We incorporated vector data of UGSs, UGSs POI and land use map together to promote data accuracy, and the area threshold of UGSs was set to 3 ha according to the fragmented landscape and local species’ habitat demand. In addition, 11 green belts were excluded during the evaluation of spatial accessibility but remained for the ecological connectivity assessment due to the low contribution of green belts along roads to human recreation. Overall, 91 UGSs patches were extracted with a total area of 3080.61 ha, including 47 PGSs and 33 AGSs. The large-sized UGSs patches are mainly distributed along the Yangtze River, Hanjiang River and East Lake indicating the spatial proximity of UGSs to water bodies in Wuhan. To calculate the spatial accessibility of UGSs, the geometric centroids of residential areas and UGSs were extracted as the starting and ending points of resident traveling.
Road networks, species characteristics and population censuses were also included in this work. The vector data of the road networks for walking and cycling in 2018 were collected from the open street map website and modified according to the land-use data. Bird species characteristics, i.e. average weight, habitat preference, and dispersal capability, were obtained from the China Bird Watching Data Center (http://www.birdreport.cn), the Red Data List of Chinese species, and the China Animal Theme Database (http://www.zoology.csdb.cn/). The population censuses at the community level were obtained from the sixth population census of Wuhan.
3. Methods
3.1. Framework overview
The framework for the evaluation of coordination relationships of social and ecological benefits of UGSs is presented in . It comprised three stages: assessment of the Spatial Accessibility (SA) of UGSs, calculation of the Ecological Connectivity (EC) of UGSs, and coupling analysis of SA-EC. In the first stage, four travel scenarios were designed based on the combinations of two travel modes (i.e. walking and cycling) and two travel time thresholds (i.e. 15 min and 30 min). The spatial accessibility of UGSs under the four scenarios was calculated using Gaussian-based Floating Catchment Area (GFCA) analysis. Then, ecological networks of UGSs were constructed, and the ecological connectivity index of each UGS patch was calculated. The third stage was to analyze the coordination relationships between spatial accessibility and ecological connectivity of UGSs based on the analysis of coupling coordination degrees. The policy implications for UGSs planning will be concluded based on this framework.
Figure 2. Coupling coordination analysis framework for spatial accessibility and ecological connectivity of UGSs.
3.2. Evaluating spatial accessibility based on the GFCA method
Here, we defined the spatial accessibility of UGSs as the relative difficulty for residents traveling from residential areas to UGSs sites, which highlighted the transportation cost and time cost resulting from physical spatial barriers (Rigolon Citation2016). Based on the existing definition of accessibility (Kwan et al. Citation2003), we used the potential service population of a UGS patch to represent its spatial accessibility. A large potential service population of a UGS patch indicates its high accessibility to urban residents.
The Floating Catchment Area (FCA) method evaluates spatial accessibility with urban road data (Wang Citation2000; Luo Citation2004). The Gaussian-based Floating Catchment Area (GFCA) method is an extension of the FCA method. It enables us to assess UGSs’ spatial accessibility by corporating the heterogeneous influence of distance factors on UGSs demand. We assumed that the potential travel modes of residents included walking and cycling, and the travel speed was set to 5 km/h and 15 km/h, respectively. We set the travel time thresholds to 15 min or 30 min considering both the community life circle and the travel limit time and eliminated the roads not conforming to the above travel scenarios, like cross-river expressways. The shortest traveling distance from one community to a certain UGS site can be calculated as follows:
where is the spatial accessibility level of
;
is the shortest travel distance from community
to
;
is the longest distance from community
to
;
is the weighted population size of community
within the travel distance (
); and
is the Gaussian equation considering the distance decay effect. The
can be divided into five levels using the natural break’s method: low, lower-middle, middle, higher-middle, and high level.
3.3. Assessing ecological connectivity by the MCR model
We employed the MCR model to construct the ecological networks of UGSs for different species and assess the ecological connectivity grades. Originating from graph theory, this method can identify the optimal corridor with a minimum dispersal resistance for a target species based on the distribution of ecological sources, the distances between the sources, and the sources’ landscape surface characteristics. Specifically, UGSs patches are considered ecological sources. The corridors connect neighboring ecological sources to provide paths for species movements and the exchange of materials, energy, and information. The habitat quality determined by land-use types represents a resistance surface for species dispersal (Wang and Liu Citation2019; Chetkiewicz, Clair, and Boyce Citation2006). The MCR model can be formulated as follows:
where is the minimum cumulative resistance value for species dispersal;
indicates the positive correlation of
with the species dispersal process;
is the distance from source
to landscape unit
; and
is the ecological resistance coefficient of landscape unit
to the dispersal of the target species.
Five typical birds, i.e. brown-headed crow finch (Sinosuthora webbiana), white-headed bulbul (Pycnonotus sinensis), gray magpie (Cyanopica cyana), black thrush (Turdus merula), and bead-necked turtle dove (Spilopelia chinensis), were selected as target species due to their wide distribution in the study area and significance in biodiversity maintaining (). These birds feature theoretical dispersal distances from 1 km to 5 km, allowing us to test the sensitivity of ecological networks. The distances were calculated according to their biological characteristics, such as average weights and diets (Sutherland et al. Citation2000; Bowman Citation2003).
Table 1. Ecological characteristics of target species.
The functional connectivity indexes, i.e. Probability of Connectivity (PC), the variation of the Probability of Connectivity (dPC) and Betweenness Centrality (BC), were used to evaluate the ecological connectivity of UGSs at the landscape and patch levels (). Compared with structural connectivity, the functional connectivity index can represent the ecological behaviors of species between different UGSs patches and their organic connections in ecological processes (Zhang et al. Citation2019).
Table 2. Functional connectivity index and their expressions.
We determined habitat quality and generated the resistance surface between 91 green space patches using the InVEST model. According to the model principle, forestland, grassland, and water areas were identified as patches with relatively-high habitat suitability, while residential, industrial and transportation areas, cultivated land, and unused land were regarded as threats to habitat quality (Baral et al. Citation2014). The InVEST model was parameterized based on existing studies as shown in Table S1 and Table S2 in Appendix A. According to the median dispersal distances of the target species, the distance threshold was set to 1 km, 2 km, 3 km, 4 km, and 5 km. Linkage Mapper, a development tool of ArcGIS, was used to identify the least cumulative resistance path between source patches (Beier et al. Citation2011), and Conefor Sensinode 2.6 was used to calculate the functional connectivity index (Saura and Torne Citation2009).
3.4. Coupling and coordination analysis between ecological connectivity and spatial accessibility of UGSs
The coupling theory originating from physics can describe the interactions between two or more systems, e.g. biodiversity conservation and the recreational service of ecosystems. The coordinated degree model can evaluate the interacting strength and the coordinated development between ecological connectivity and spatial accessibility of UGSs (Ariken et al. Citation2021). The Coupling and Coordination Degree (CCD) between the spatial accessibility of four travel modes and ecological connectivity of five dispersal distances can be calculated as follows:
where and
are the normalized values of spatial accessibility and ecological connectivity of each UGS patch;
denotes the coupling degree, ranging from 0 to 1;
signifies a comprehensive coordination index;
and
are the weights of two UGSs indicators that equal to 0.5 in this study; and
represents the CCD of spatial accessibility and ecological connectivity for each UGS patch between 0 and 1, and 1 indicates the maximum coordination of the two ecosystem services. The CCD can be divided into five categories: severe imbalance [0,0.2], moderate imbalance (0.2, 0.4], basic coordination (0.4,0.6], moderate coordination (0.6, 0.8], and high coordination (0.8,1) based on the study (Ariken et al. Citation2021).
4. Results
4.1. Spatial accessibility of UGSs
As shown in , the Spatial Accessibility (SA) of PGSs and AGSs were different, but would be both promoted as the travel mode changes and the service time increases. The SA of PGSs was superior to that of AGSs, and the potential population served by PGSs was, on average, twice that of AGSs. By walking for 15 min, PGSs served 785,753 people, with a service area of 72.30 km2, covering 13.75% of the study area, while AGSs served 360,707 people, with a service area of 48.46 km2, covering 9.22% of the study area. By cycling for 15 min, the served people of PGSs and AGSs would increase by 988.43% and 1068.39%, and the served area would increase by 292.58% and 398.48%. The potential service population would increase by four times under the mode of walking and more than ten times under that of cycling as the time increases from 15 min to 30 min.
Table 3. The statistical description of spatial accessibility of UGSs in Wuhan.
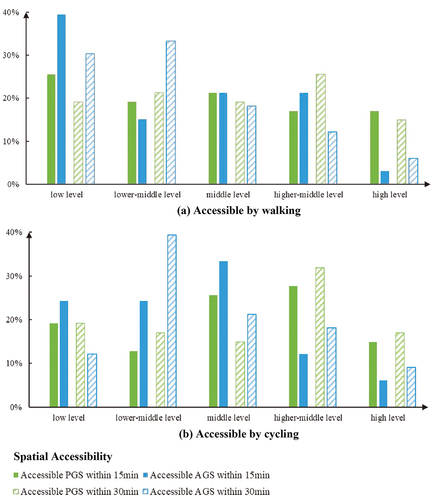
Based on the natural break’s method, the SA of UGSs in urban center of Wuhan was poor, and that of PGSs was slightly better than that of AGSs (). Only 15% of UGSs had a high-level service capability, which will drop to 11.25% within the 15-minute community life circle. By walking, nearly 50% of UGSs had lower accessibility than average, while this proportion still reached 40% by cycling. Specifically, the proportion of PGS with high-level SA (approximately 15%) was higher than that of AGS (less than 10%).
Figure 3. Distribution of PGSs and AGSs under different accessibility levels.
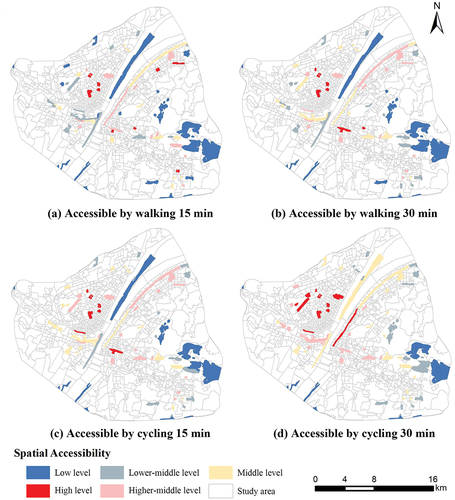
The SA of UGSs exhibited a similar pattern under different scenarios, gradually declined from the urban center to the periphery (). UGSs in the central and western parts of the urban center had high accessibility, while that in the periphery, especially the AGSs near the eastern boundary, featured low accessibility. Notably, the barrier effect of water areas, e.g. Hanjiang River, Yangtze River, and Donghu Lake, caused spatial heterogeneity of UGSs accessibility in the urban center. This phenomenon was evident within the 15-minute community life circles.
Figure 4. Spatial distribution of SA of UGSs in the urban center of Wuhan.
4.2. Ecological connectivity of UGSs
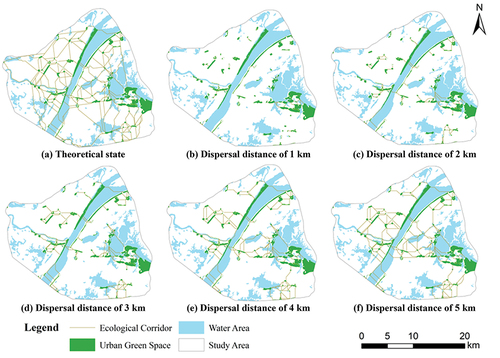
As shown in , 235 potential ecological corridors existed between 91 UGSs patches, with a total length of 456.43 km. The number of corridors would increase as the dispersal distance increases. At the distance of 1 km, only 67 ecological corridors in two separate spatial clusters were created in the central and eastern regions. The corridor number increased by nearly 70% at the distance threshold of 2 km, which was the maximum growth rate across all distance thresholds. When the distance threshold reached 5 km, UGSs patches connected in a complex ecological network with 198 ecological corridors.
Figure 5. Ecological network of UGSs in the urban center of Wuhan under different dispersal distance thresholds.
The Ecological Connectivity (EC) needed improvement, for its PC value under various dispersal distances did not exceed 0.5 (). As the dispersal distance increases from 1 km to 5 km, PC increased 123.78% and dPC increased 24.20%, showing the positive impacts of dispersal ability on ecological connectivity at the landscape and patch scale. Meanwhile, over 90% of UGSs experienced the EC promotion, and the number of patches with non-zero BC value increased by 196.15%.
Table 4. Ecological connectivity of UGSs patches in Wuhan.
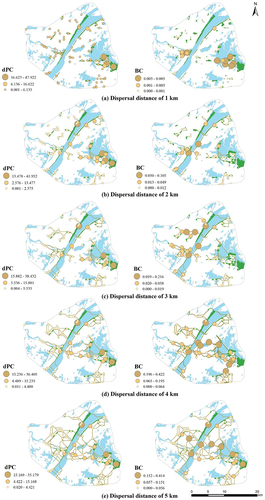
The EC of UGSs also showed a similar pattern in different scenarios, with high dPC and BC levels near the Yangtze River and in the east and low levels in the west and the south (). River beach parks, i.e. Hanyang River Beach, Hankou River Beach, and Wuchang River Beach, were ranked high. As the dispersal distance increased, the separated UGSs clusters in the east and the west gradually connected, increasing the whole region’s connectivity intensity. PGSs and AGSs featured distinct ecological connectivity under different scenarios, for PGSs had higher connectivity at the dispersal distance exceeding 2 km, while AGSs featured higher BC and dPC values at that lower than 1 km. Notably, BC could better illustrate the importance of small-sized UGSs patches in maintaining UGSs connectivity, for example, Neisha Lake Park, Youth Park, and Lingjiao Lake Park.
Figure 6. Spatial distribution of ecological connectivity of UGSs across all dispersal distance thresholds in Wuhan.
4.3. Coupling and coordination degree of UGSs
The Coupling and Coordination Degree (CCD) between SA and EC of UGSs were further evaluated under 20 scenarios based on the combinations of four travel modes and five dispersal distances of species (see Table S3 in Appendix A for detailed information). The CCD of UGSs patches in the urban center of Wuhan was mainly imbalanced, and the mean CCD under 20 scenarios was only between 0.31 and 0.42. Only 7.50% of UGSs patches had a high level of CCD, while more than 70% of UGSs were imbalanced, and over 10% were severely imbalanced. Different types of scenarios and green spaces featured distinct coordination. The highly coordinated UGSs patches only existed in the scenario accessible by cycling for 30 min. The overall CCD was at a high level, and only 1.25% were severely imbalanced in the scenario assessable by cycling for 30 min and dispersal distance greater than 2 km, which was the optimal coordination scenario of the coordination of socio-ecological benefits. The largest proportion of the severely imbalanced UGSs distributed in the scenario accessible by walking for 15 min and dispersal distance of 1 km. For different types of UGSs, the PGS featured higher CCD than the AGS, and only 6.50% were severely imbalanced. In contrast, no highly coordinated patches existed among all AGSs, and more than 80% and approximately 18% of AGSs were in a state of imbalance and severe imbalance.
The CCD of UGSs exhibited a spatial pattern of high center and low outside (). The coordinated UGSs were primarily distributed in the central and eastern regions, especially central Wuchang River Beach Park, which reached moderate coordination 16 times under 20 scenarios. The imbalanced UGSs were primarily shown in the periphery, and the frequency of severe imbalance was as high as 18 times. As shown in and Table S4 in appendix A, 24 severely imbalanced patches and 23 moderate coordinated patches existed under all 20 scenarios.
Figure 7. Numerical distribution of CCD under different traffic modes.
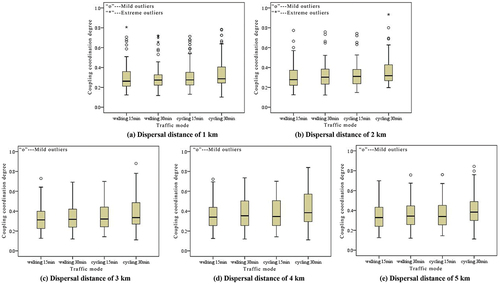
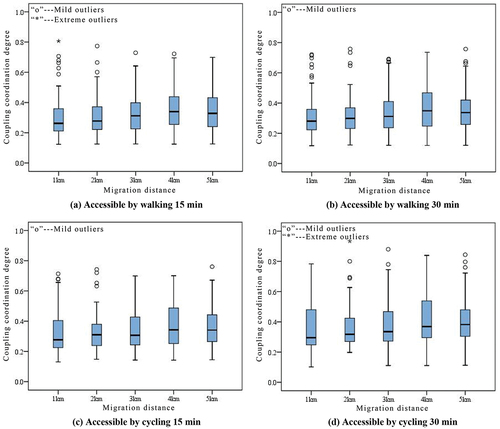
The dispersal distance significantly impacted the CCD of UGSs compared with the travel mode (). Under the same travel mode, the overall CCD showed a significant trend of first increasing and then decreasing across all dispersal distances. When the dispersal distance was 4 km, the CCD reached the peak with few outliers in numerical distribution. At the same dispersal distance, however, the overall CCD was slightly improved with the increase in the travel time, and the average increase of median CCD was only 3.86%. Notably, a better level of CCD was observed under the travel mode of cycling for 30 min.
Figure 8. Numerical distribution of CCD under different species dispersal distances.
5. Discussion
5.1. Policy implications for urban planning
Our results showed that the spatial accessibility of UGSs in Wuhan, especially in the east of the city, needs to be improved to achieve the planning of a 15-minute community-life circle, for only 11.25% of UGSs featured high-level spatial accessibility. We suggest two solutions according to the different accessibility between PGSs and AGSs. For the large UGSs with low accessibility, particularly in the eastern boundary, their spatial accessibility can be promoted by the improvement of the urban slow traffic system, like walking and cycling. For the others, it is necessary to construct AGSs and small-sized community parks within the community life circle. Notably, campus green spaces can satisfy the recreational demands of urban residents and serve as patches or corridors from the urban landscape (Li and Sullivan Citation2016; Zhao, He, and Meng Citation2015). In Wuhan, a city with more than 90 colleges and universities, campus green spaces will provide the potential service to their surrounding communities. Thus, the local government can incorporate the impacts of campus green spaces into the planning of community-life circles, allowing residents to share UGSs from the neighboring schools (Ioja et al. Citation2014; Cetin et al. Citation2021; Onac et al. Citation2021).
The results also indicated that Wuhan urban form may hinder the bird’s movements with a low dispersal capability of less than 4 km with the PC value of 0.36. It is less than the distance to form an intact ecological network. The arrangement of large-scale UGSs is an important strengthener, but it is infeasible in the urban center area (Tan, Guy, and Li Citation2011). With the higher BC and dPC values at the dispersal distance lower than 1 km, AGSs show the potential role of ecological connectivity in the low-dispersal-distance ecological networks. It is necessary for future planning of UGSs system to emphasize the accurate location of key nodes and corridors from the graph perspective, primarily the existing small-sized green patches within the stepping-stone effect.
Moreover, we found that more than 70% of UGSs social-ecological benefits were imbalanced, and the optimal coordination showed in the scenarios of 30-minute cycling and 4 km dispersal distance for the potential service population growth and ecological connectivity enhancement. Based on the regional coordination analysis, we identified the characteristics of green patches in different imbalanced states to develop targeted strategies. The correlation between UGSs patch size and CCD was examined according to the study (Fan et al. Citation2017; Capotorti et al. Citation2019). 43 unbalanced green patches were identified and divided into 7 types based on the study (Ariken et al. Citation2021) (). Among them, 12 green patches featured small-sized, low EC, and low SA, accounting for 27.91%. As shown in and Table S5 in Appendix A, the imbalanced green patches with low EC accounted for 25.58%, mostly distributed on the northern bank of the Yangtze River, while those with low SA accounted for 13.95%, primarily distributed in the periphery of the southern bank of the Yangtze River.
Figure 9. Coordination degree of UGSs in Wuhan.
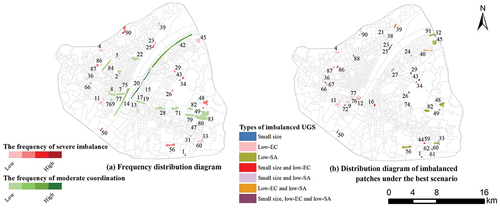
Table 5. Types of imbalanced green patches and key patches.
5.2. Strengths of coordinating UGS multifunctionality
UGSs’ multifunctionality will maximize their potential socio-ecological benefits (Meerow and Newell Citation2017; Belmeziti, Cherqui, and Kaufmann Citation2018). As scarce ecological components in urban systems, green spaces sustain various ecosystem services and maintain the urban quality of life, as well as create public spaces with biodiversity and ecosystem for citizens, to enhance environmental justice (Fan et al. Citation2017; Kabisch and Haase Citation2013). However, social inequity causes changes in the urban ecosystem, with profound impacts on global biodiversity (Schell et al. Citation2020). As two of the social and ecological benefits, spatial connectivity and ecological connectivity show a typical luxury effect. They positively correlate with community wealth (Schell et al. Citation2020). On the other hand, they also exhibit a particularly remarkable trade-off relationship. Therefore, the research can provide suggestions for sustainable urban green space planning from the perspective of socio-ecological synergies promotion.
UGSs’ multifunctionality has attracted the increasing attention of scholars and urban planners. However, the existing primary assessment is based on a weighted aggregation of UGSs merits, which may thus largely ignore the coordinated relationships of multiple UGSs functions (Meerow and Newell Citation2017; Liu et al. Citation2018). It is mainly due to the separated governance of different departments. For example, ecology and environment management may highlight the ecological functions of UGSs, while housing and urban development will emphasize their capabilities of providing cultural tourism and leisure services. Based on the previous assessment, the integrated analysis not only evaluates the recreational function and biodiversity maintaining respectively, but also measures their coupling and coordination relationships from trade-off and synergic relationships. The result eliminated the influence of the subjective weight between different services affected by governance separation. Additionally, besides strategic UGSs layout design, it can provide a multi-objective integration planning scheme, namely ecological protection and transportation network planning incorporating the effects of species dispersal capability and resident travel modes.
5.3. Limitations and future research
A few theories on UGSs suggest that for urban residents, high-quality and multi-functional urban green spaces can support quality of life (Van Herzele and Wiedemann Citation2003). Given the standard, the guiding principles of UGSs multifactorial evaluation are developed as follows (Van Herzele and Wiedemann Citation2003).
From the perspective of the citizen-based principle, it is necessary to include small-sized UGSs patches and various modes of transportation. Residents use lots of green space less than 3 ha, and part of the study chose 2 ha as the minimum area widely accepted in western cities(Fan et al. Citation2017). It will not only get a better assessment of spatial accessibility, but also help to capture the role of small patches as stepping stones in the ecological network, deepening the study of ecological connectivity. On the other hand, considering the vigorous development of public transportation, residents have diversified and convenient ways to reach green spaces. Including the subway, bus and other travel modes, as well as travel behavior and other social data will improve the research results. Regarding UGSs quality, the study focused on urban green spaces’ accessibility and biodiversity. The latter was evaluated by ecological connectivity from the perspective of typical species conservation. Based on five typical birds’ biological characteristics, the MCR model constructed the ecological networks of species dispersal distances from 1 km to 5 km, partly reflecting the conservation of various species. However, water areas make a significant impact on ecological connectivity as important sites for species dispersal. Although the effect was considered in terms of water’s habitat suitability and its sensitivity to threat, the study mainly evaluated the ecological networks of birds and, to some extent, ignored the waters that could not be used as bird habitats. In addition, as an important aesthetic feature affecting UGSs quality and an important open space widely recognized by residents, water areas can be included in the evaluation of spatial accessibility (Fan et al. Citation2017; Giles-Corti et al. Citation2005; Hartig and Kahn Citation2016).
Furthermore, a clear distinction of UGSs functions between green spaces can be observed in different parts of the city. The previous study claimed the small park in the urban center has close connections with the local everyday life because that its nearby residents can enjoy sports and other activities, while the vast forest in the urban periphery is crucial to weekend recreation and other important ecological merits (Van Herzele and Wiedemann Citation2003). Although the latter space is beyond the scope of this study, it needs to be valued and integrated with the former one in future work because the UGSs system of functional synergy is beneficial to the overall socio-ecological benefits. Therefore, future works may concentrate on the integration of multiple urban green spaces, combining various interest-related sectors, representing multiple merits of UGSs’ socio-ecological benefits, and enhancing functions synergies based on the big spatial data and accurate quantification to achieve the socio-ecological benefits maximum of urban green spaces system(Trinder and Liu Citation2020; Huang and Wang Citation2020).
6. Conclusions
From a systematic perspective, we proposed an evaluation framework for coordinating multiple functions of UGSs, which can synthesize the socio-ecological benefits and serve as a general tool for sustainable UGSs design and support for urban multi-department decision planning. Different from previous research, this framework can identify UGSs patches at a low level of coordination between spatial accessibility and ecological connectivity and gives relevant suggestions on ecological conservation and transportation planning.
Our results showed that Wuhan features low spatial accessibility, and UGSs patches cannot provide sufficient social services under 15 min travel mode by walking. Meanwhile, the UGSs ecological promotion is required for enhancing the dispersal capability of less than 4 km, thereby forming an intact ecological network. Although the socio-ecological benefits of PGSs are more significant than those of AGSs, small-sized AGS patches cannot be ignored due to their stepping-stone effect as connectivity providers for their higher connectivity at the lower dispersal distance. Moreover, the coupling coordination of the two functions also remains at a low level. On average, only 7.50% of the UGSs patches reached a moderate coordination level, and over 70% and 10% were in a state of imbalance and severe imbalance. UGSs will reach their peak coordination degree at the dispersal distance of 4 km. Under the optimal coordination scenario (i.e. the combination of 30 min cycling and 4 km dispersal distance), 43 green patches were identified in a state of imbalance. Compared with the single-merit evaluation, the multifunctional coupling analysis of UGSs can assist in comprehensive multifunctional planning and management of UGSs. More importantly, planners should highlight the arrangement of small-sized UGSs patches to improve the dispersal probability of low dispersal distance, i.e. less than 4 km, for its significant impacts on UGSs’ CCD compared with the travel mode.
Disclosure statement
No potential conflict of interest was reported by the author(s).
Data availability statement
The data that support the findings of this study are available from the corresponding author, upon reasonable request.
Additional information
Funding
Notes on contributors
Dianfeng Liu
Dianfeng Liu is currently a Professor at Wuhan University. He is engaged in research on the theory, method and application of land use optimization, including sustainable land use, land use change and ecological effect, optimal allocation and change simulation, application of land space planning and regional sustainable development.
Huiying Li
Huiying Li received her M.S. degree in human geography from Wuhan University in 2022. Her research focuses on the high-quality development of the new urbanization, from the perspective of multifunctionality of urban green spaces.
Mingli Qiu
Mingli Qiu is currently pursuing the PhD degree in human geography with Wuhan University. Her research interest is bringing trade-offs between ecosystem services into coordinated multisectoral planning to achieve the Sustainable Development Goals (SDGs) directly related to land-sector sustainability.
Yaolin Liu
Yaolin Liu is currently a Professor at Wuhan University. He is engaged in research on sustainable land use and geographic information science.
References
- Ariken, M., F. Zhang, N. W. Chan, and H. T. Kung. 2021. “Coupling Coordination Analysis and Spatio-Temporal Heterogeneity Between Urbanization and Eco-Environment Along the Silk Road Economic Belt in China.” Ecological Indicators 121: 107014. doi:10.1016/j.ecolind.2020.107014.
- Aronson, M. F. J., C. A. Lepczyk, K. L. Evans, M. A. Goddard, S. B. Lerman, J. S. MacIvor, C. H. Nilon, and T. Vargo. 2017. “Biodiversity in the City: Key Challenges for Urban Green Space Management.” Frontiers in Ecology and the Environment 15 (4): 189–196. doi:10.1002/fee.1480.
- Ayram, C. A. C., M. E. Mendoza, A. Etter, and D. R. P. Salicrup. 2016. “Habitat Connectivity in Biodiversity Conservation: A Review of Recent Studies and Applications.” Progress in Physical Geography-Earth and Environment 40 (1): 7–37. doi:10.1177/0309133315598713.
- Baral, H., R. J. Keenan, S. K. Sharma, N. E. Stork, and S. Kasel. 2014. “Spatial Assessment and Mapping of Biodiversity and Conservation Priorities in a Heavily Modified and Fragmented Production Landscape in North-Central Victoria, Australia.” Ecological Indicators 36: 552–562. doi:10.1016/j.ecolind.2013.09.022.
- Barbosa, O., J. A. Tratalos, P. R. Armsworth, R. G. Davies, R. A. Fuller, P. Johnson, and K. J. Gaston. 2007. “Who Benefits from Access to Green Space? A Case Study from Sheffield, UK.” Landscape and Urban Planning 83 (2–3): 187–195. doi:10.1016/j.landurbplan.2007.04.004.
- Beier, P., W. Spencer, R. F. Baldwin, and B. H. McRae. 2011. “Toward Best Practices for Developing Regional Connectivity Maps.” Conservation Biology 25 (5): 879–892. doi:10.1111/j.1523-1739.2011.01716.x.
- Belmeziti, A., F. Cherqui, and B. Kaufmann. 2018. “Improving the Multi-Functionality of Urban Green Spaces: Relations Between Components of Green Spaces and Urban Services.” Sustainable Cities and Society 43: 1–10. doi:10.1016/j.scs.2018.07.014.
- Beninde, J., M. Veith, and A. Hochkirch. 2015. “Biodiversity in Cities Needs Space: A Meta-Analysis of Factors Determining Intra-Urban Biodiversity Variation.” Ecology Letters 18 (6): 581–592. doi:10.1111/ele.12427.
- Bowman, J. 2003. “Is Dispersal Distance of Birds Proportional to Territory Size?” Canadian Journal of Zoology-Revue Canadienne De Zoologie 81 (2): 195–202. doi:10.1139/Z02-237.
- Capotorti, G., M. M. A. Orti, R. Copiz, L. Fusaro, B. Mollo, E. Salvatori, and L. Zavattero. 2019. “Biodiversity and Ecosystem Services in Urban Green Infrastructure Planning: A Case Study from the Metropolitan Area of Rome (Italy).” Urban Forestry & Urban Greening 37: 87–96. doi:10.1016/j.ufug.2017.12.014.
- Carrete, M., J. L. Tella, G. Blanco, and M. Bertellotti. 2009. “Effects of Habitat Degradation on the Abundance, Richness and Diversity of Raptors Across Neotropical Biomes.” Biological Conservation 142 (10): 2002–2011. doi:10.1016/j.biocon.2009.02.012.
- Cetin, M. 2015. “Using GIS Analysis to Assess Urban Green Space in Terms of Accessibility: Case Study in Kutahya.” International Journal of Sustainable Development and World Ecology 22 (5): 420–424. doi:10.1080/13504509.2015.1061066.
- Cetin, M., T. Aksoy, S. N. Cabuk, M. A. S. Kurkcuoglu, and A. Cabuk. 2021. “Employing Remote Sensing Technique to Monitor the Influence of Newly Established Universities in Creating an Urban Development Process on the Respective Cities.” Land Use Policy 109. doi:10.1016/j.landusepol.2021.105705.
- Cetin, M., A. K. Onac, H. Sevik, U. Canturk, and H. Akpinar. 2018. “Chronicles and Geoheritage of the Ancient Roman City of Pompeiopolis: A Landscape Plan.” Arabian Journal of Geosciences 11 (24): 798. doi:10.1007/s12517-018-4170-6.
- Chetkiewicz, C. L. B., C. C. S. Clair, and M. S. Boyce. 2006. “Corridors for Conservation: Integrating Pattern and Process.” Annual Review of Ecology, Evolution, and Systematics 37 (1): 317–342. doi:10.1146/annurev.ecolsys.37.091305.110050.
- Chi, W. F., W. J. Shi, and W. H. Kuang. 2015. “Spatio-Temporal Characteristics of Intra-Urban Land Cover in the Cities of China and USA from 1978 to 2010.” Journal of Geographical Sciences 25 (1): 3–18. doi:10.1007/s11442-015-1149-z.
- Dai, E. F., X. L. Wang, J. J. Zhu, and W. M. Xi. 2017. “Quantifying Ecosystem Service Trade-Offs for Plantation Forest Management to Benefit Provisioning and Regulating Services.” Ecology and Evolution 7 (19): 7807–7821. doi:10.1002/ece3.3286.
- De Montis, A., S. Caschili, M. Mulas, G. Modica, A. Ganciu, A. Bardi, A. Ledda, L. Dessena, L. Laudari, and C. R. Fichera. 2016. “Urban-Rural Ecological Networks for Landscape Planning.” Land Use Policy 50: 312–327. doi:10.1016/j.landusepol.2015.10.004.
- Dearborn, D. C., and S. Kark. 2010. “Motivations for Conserving Urban Biodiversity.” Conservation Biology 24 (2): 432–440. doi:10.1111/j.1523-1739.2009.01328.x.
- Derkzen, M. L., A. J. A. van Teeffelen, and P. H. Verburg. 2015. “REVIEW Quantifying Urban Ecosystem Services Based on High-Resolution Data of Urban Green Space: An Assessment for Rotterdam, the Netherlands.” The Journal of Applied Ecology 52 (4): 1020–1032. doi:10.1111/1365-2664.12469.
- Douglas, O., M. Lennon, and M. Scott. 2017. “Green Space Benefits for Health and Well-Being: A Life-Course Approach for Urban Planning, Design and Management.” Cities 66: 53–62. doi:10.1016/j.cities.2017.03.011.
- Ekkel, E. D., and S. de Vries. 2017. “Nearby Green Space and Human Health: Evaluating Accessibility Metrics.” Landscape and Urban Planning 157: 214–220. doi:10.1016/j.landurbplan.2016.06.008.
- Fan, P. L., L. H. Xu, W. Z. Yue, and J. Q. Chen. 2017. “Accessibility of Public Urban Green Space in an Urban Periphery: The Case of Shanghai.” Landscape and Urban Planning 165: 177–192. doi:10.1016/j.landurbplan.2016.11.007.
- Giles-Corti, B., M. H. Broomhall, M. Knuiman, C. Collins, K. Douglas, K. Ng, A. Lange, and R. J. Donovan. 2005. “Increasing Walking - How Important is Distance To, Attractiveness, and Size of Public Open Space?” American Journal of Preventive Medicine 28 (2): 169–176. doi:10.1016/j.amepre.2004.10.018.
- Hartig, T., and P. H. Kahn. 2016. “Living in Cities, Naturally.” Science 352 (6288): 938–940. doi:10.1126/science.aaf3759.
- Huang, B., and J. H. Wang. 2020. “Big Spatial Data for Urban and Environmental Sustainability.” Geo-Spatial Information Science 23 (2): 125–140. doi:10.1080/10095020.2020.1754138.
- Immergluck, D., and T. Balan. 2018. “Sustainable for Whom? Green Urban Development, Environmental Gentrification, and the Atlanta Beltline.” Urban Geography 39 (4): 546–562. doi:10.1080/02723638.2017.1360041.
- Ioja, C. L., S. R. Gradinaru, D. A. Onose, G. O. Vanau, and A. C. Tudor. 2014. “The Potential of School Green Areas to Improve Urban Green Connectivity and Multifunctionality.” Urban Forestry & Urban Greening 13 (4): 704–713. doi:10.1016/j.ufug.2014.07.002.
- Kabisch, N., and D. Haase. 2013. “Green Spaces of European Cities Revisited for 1990-2006.” Landscape and Urban Planning 110: 113–122. doi:10.1016/j.landurbplan.2012.10.017.
- Kong, F. H., H. W. Yin, N. Nakagoshi, and Y. G. Zong. 2010. “Urban Green Space Network Development for Biodiversity Conservation: Identification Based on Graph Theory and Gravity Modeling.” Landscape and Urban Planning 95 (1–2): 16–27. doi:10.1016/j.landurbplan.2009.11.001.
- Kwan, M., A. Murray, M. O’Kelly, and M. Tiefelsdorf. 2003. “Recent Advances in Accessibility Research: Representation, Methodology and Applications.” Journal of Geographical Systems 5: 129–138. doi:10.1007/s101090300107.
- Li, H. Y., D. F. Liu, and J. H. He. 2022. “Exploring Differentiated Conservation Priorities of Urban Green Space Based on Tradeoffs of Ecological Functions.” Sustainability 14 (3): 1845. doi:10.3390/su14031845.
- Li, D. Y., and W. C. Sullivan. 2016. “Impact of Views to School Landscapes on Recovery from Stress and Mental Fatigue.” Landscape and Urban Planning 148: 149–158. doi:10.1016/j.landurbplan.2015.12.015.
- Liu, H. X., Y. H. Hu, F. Li, and L. X. Yuan. 2018. “Associations of Multiple Ecosystem Services and Disservices of Urban Park Ecological Infrastructure and the Linkages with Socioeconomic Factors.” Journal of Cleaner Production 174: 868–879. doi:10.1016/j.jclepro.2017.10.139.
- Lovell, S. T., and J. R. Taylor. 2013. “Supplying Urban Ecosystem Services Through Multifunctional Green Infrastructure in the United States.” Landscape Ecology 28 (8): 1447–1463. doi:10.1007/s10980-013-9912-y.
- Luo, W. 2004. “Using a GIS-Based Floating Catchment Method to Assess Areas with Shortage of Physicians.” Health & Place 10 (1): 1–11. doi:10.1016/S1353-8292(02)00067-9.
- Meerow, S., and J. Newell. 2017. “Spatial Planning for Multifunctional Green Infrastructure: Growing Resilience in Detroit.” Landscape and Urban Planning 159: 62–75. doi:10.1016/j.landurbplan.2016.10.005.
- Nesbitt, L., M. J. Meitner, C. Girling, S. R. J. Sheppard, and Y. H. Lu. 2019. “Who Has Access to Urban Vegetation? A Spatial Analysis of Distributional Green Equity in 10 US Cities.” Landscape and Urban Planning 181: 51–79. doi:10.1016/j.landurbplan.2018.08.007.
- Nielsen, T. S., and K. B. Hansen. 2007. “Do Green Areas Affect Health? Results from a Danish Survey on the Use of Green Areas and Health Indicators.” Health & Place 13 (4): 839–850. doi:10.1016/j.healthplace.2007.02.001.
- Onac, A. K., M. Cetin, H. Sevik, P. Orman, A. Karci, and G. G. Sutcuoglu. 2021. “Rethinking the Campus Transportation Network in the Scope of Ecological Design Principles: Case Study of Izmir Katip Celebi University Cigli Campus.” Environmental Science and Pollution Research 28 (36): 50847–50866. doi:10.1007/s11356-021-14299-2.
- Rigolon, A. 2016. “A Complex Landscape of Inequity in Access to Urban Parks: A Literature Review.” Landscape and Urban Planning 153: 160–169. doi:10.1016/j.landurbplan.2016.05.017.
- Rigolon, A., M. Browning, and V. Jennings. 2018. “Inequities in the Quality of Urban Park Systems: An Environmental Justice Investigation of Cities in the United States.” Landscape and Urban Planning 178: 156–169. doi:10.1016/j.landurbplan.2018.05.026.
- Sarah, P., and H. M. Zhevelev. 2007. “Effect of Visitors’ Pressure on Soil and Vegetation in Several Different Micro-Environments in Urban Parks in Tel Aviv.” Landscape and Urban Planning 83 (4): 284–293. doi:10.1016/j.landurbplan.2007.05.001.
- Saura, S., and L. Pascual-Hortal. 2007. “A New Habitat Availability Index to Integrate Connectivity in Landscape Conservation Planning: Comparison with Existing Indices and Application to a Case Study.” Landscape and Urban Planning 83 (2–3): 91–103. doi:10.1016/j.landurbplan.2007.03.005.
- Saura, S., and J. Torne. 2009. “Conefor Sensinode 2.2: A Software Package for Quantifying the Importance of Habitat Patches for Landscape Connectivity.” Environmental Modelling & Software 24 (1): 135–139. doi:10.1016/j.envsoft.2008.05.005.
- Schell, C. J., K. Dyson, T. L. Fuentes, S. Des Roches, N. C. Harris, D. S. Miller, C. A. Woelfle-Erskine, and M. R. Lambert. 2020. “The Ecological and Evolutionary Consequences of Systemic Racism in Urban Environments.” Science 369 (6510): 1446±. doi:10.1126/science.aay4497.
- Selim, S., and N. Demir. 2019. “Detection of Ecological Networks and Connectivity with Analyzing Their Effects on Sustainable Urban Development.” International Journal of Engineering and Geosciences 4 (2): 63–70. doi:10.26833/ijeg.443114.
- Setala, H., R. D. Bardgett, K. Birkhofer, M. Brady, L. Byrne, P. C. de Ruiter, F. T. de Vries, et al. 2014. “Urban and Agricultural Soils: Conflicts and Trade-Offs in the Optimization of Ecosystem Services.” Urban Ecosystems 17 (1): 239–253. doi:10.1007/s11252-013-0311-6.
- Sutherland, G. D., A. S. Harestad, K. Price, and K. P. Lertzman. 2000. “Scaling of Natal Dispersal Distances in Terrestrial Birds and Mammals.” Conservation Ecology 4 (1): 16. doi:10.5751/es-00184-040116.
- Tan, M. H., M. R. Guy, and X. B. Li. 2011. “Urban Spatial Development and Land Use in Beijing: Implications from London’s Experiences.” Journal of Geographical Sciences 21 (1): 49–64. doi:10.1007/s11442-011-0828-7.
- Taylor, P. D., L. Fahrig, K. Henein, and G. Merriam. 1993. “Connectivity is a Vital Element of Landscape Structure.” Oikos 68 (3): 571–573. doi:10.2307/3544927.
- Trinder, J., and Q. X. Liu. 2020. “Assessing Environmental Impacts of Urban Growth Using Remote Sensing.” Geo-Spatial Information Science 23 (1): 20–39. doi:10.1080/10095020.2019.1710438.
- Van Herzele, A., and T. Wiedemann. 2003. “A Monitoring Tool for the Provision of Accessible and Attractive Urban Green Spaces.” Landscape and Urban Planning 63 (2): 109–126. doi:10.1016/s0169-2046(02)00192-5.
- Wang, F. H. 2000. “Modeling Commuting Patterns in Chicago, in a GIS Environment: A Job Accessibility Perspective.” Professional Geographer 52 (1): 120–133. doi:10.1111/0033-0124.00210.
- Wang, B. Y., and Z. C. Liu. 2019. “Functional Connectivity Analyses and Construction Strategies of the Structure of Green Space Network in Haidian District of Beijing.” Landscape Architecture Frontiers 7 (1): 34–51. doi:10.15302/J-Laf-20190104.
- Xing, L. J., Y. F. Liu, and X. J. Liu. 2018. “Measuring Spatial Disparity in Accessibility with a Multi-Mode Method Based on Park Green Spaces Classification in Wuhan, China.” Applied Geography 94: 251–261. doi:10.1016/j.apgeog.2018.03.014.
- Xing, L. J., Y. F. Liu, X. J. Liu, X. J. Wei, and Y. Mao. 2018. “Spatio-Temporal Disparity Between Demand and Supply of Park Green Space Service in Urban Area of Wuhan from 2000 to 2014.” Habitat International 71: 49–59. doi:10.1016/j.habitatint.2017.11.002.
- Yang, J., and X. Huang. 2021. “The 30 M Annual Land Cover Dataset and Its Dynamics in China from 1990 to 2019.” Earth System Science Data 13 (8): 3907–3925. doi:10.5194/essd-13-3907-2021.
- Yu, Z. W., J. U. Zhang, G. Y. Yang, and J. Schlaberg. 2021. “Reverse Thinking: A New Method from the Graph Perspective for Evaluating and Mitigating Regional Surface Heat Islands.” Remote Sensing 13: 1127. doi:10.3390/rs13061127.
- Zhan, Q. M., C. Yang, and H. M. Liu. 2022. “How Do Greenspace Landscapes Affect PM2.5 Exposure in Wuhan? Linking Spatial-Nonstationary, Annual Varying, and Multiscale Perspectives.” Geo-Spatial Information Science. doi:10.1080/10095020.2022.2085187.
- Zhang, Z. Z., S. Meerow, J. P. Newell, and M. Lindquist. 2019. “Enhancing Landscape Connectivity Through Multifunctional Green Infrastructure Corridor Modeling and Design.” Urban Forestry & Urban Greening 38: 305–317. doi:10.1016/j.ufug.2018.10.014.
- Zhang, J. G., Z. W. Yu, Y. Y. Cheng, X. H. Sha, and H. Y. Zhang. 2022. “A Novel Hierarchical Framework to Evaluate Residential Exposure to Green Spaces.” Landscape Ecology 37 (3): 895–911. doi:10.1007/s10980-021-01378-5.
- Zhao, D. X., B. J. He, and F. Q. Meng. 2015. “The Green School Project: A Means of Speeding Up Sustainable Development?” Geoforum 65: 310–313. doi:10.1016/j.geoforum.2015.08.012.
- Zhao, G. S., J. Y. Liu, W. H. Kuang, Z. Y. Ouyang, and Z. L. Xie. 2015. “Disturbance Impacts of Land Use Change on Biodiversity Conservation Priority Areas Across China: 1990-2010.” Journal of Geographical Sciences 25 (5): 515–529. doi:10.1007/s11442-015-1184-9.